Chapter 07 – Optimal Risky Portfolios
7-19
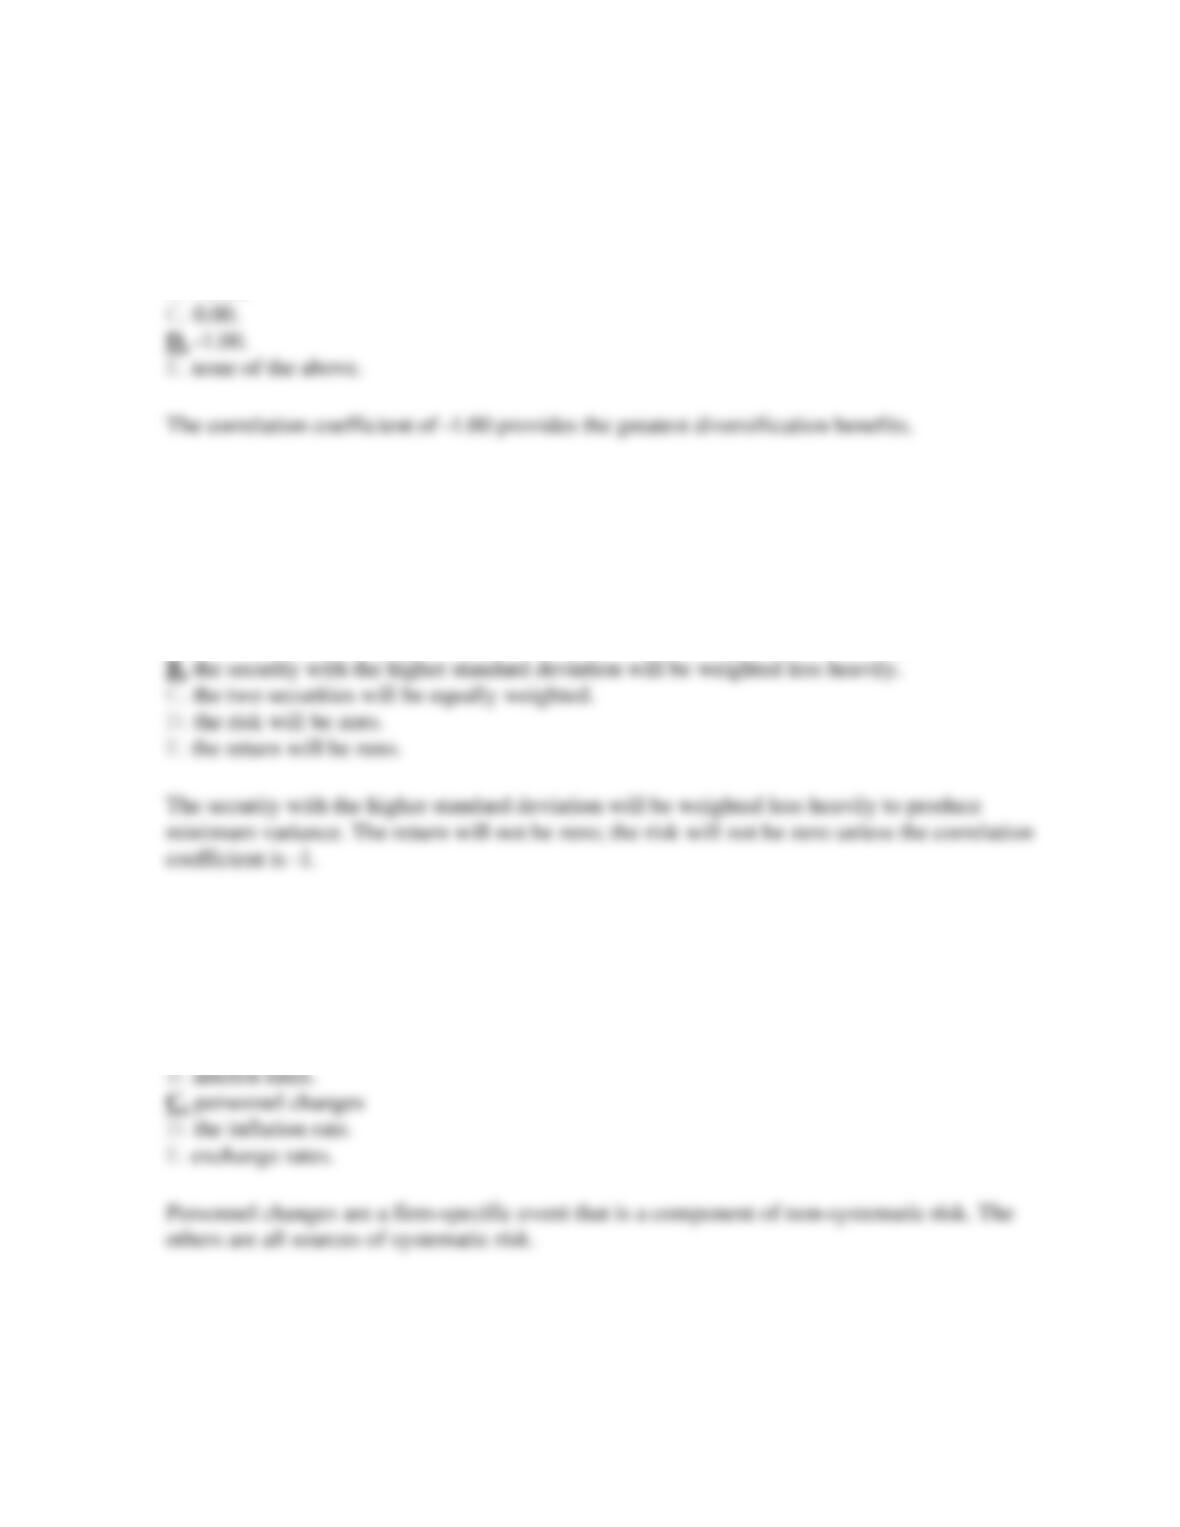
42. For a two-stock portfolio, what would be the preferred correlation coefficient between the
two stocks?
A. +1.00.
B. +0.50.
Difficulty: Moderate
43. In a two-security minimum variance portfolio where the correlation between securities is
greater than -1.0
A. the security with the higher standard deviation will be weighted more heavily.
Difficulty: Difficult
44. Which of the following is not a source of systematic risk?
A. the business cycle.
Difficulty: Easy
Chapter 07 – Optimal Risky Portfolios
7-20
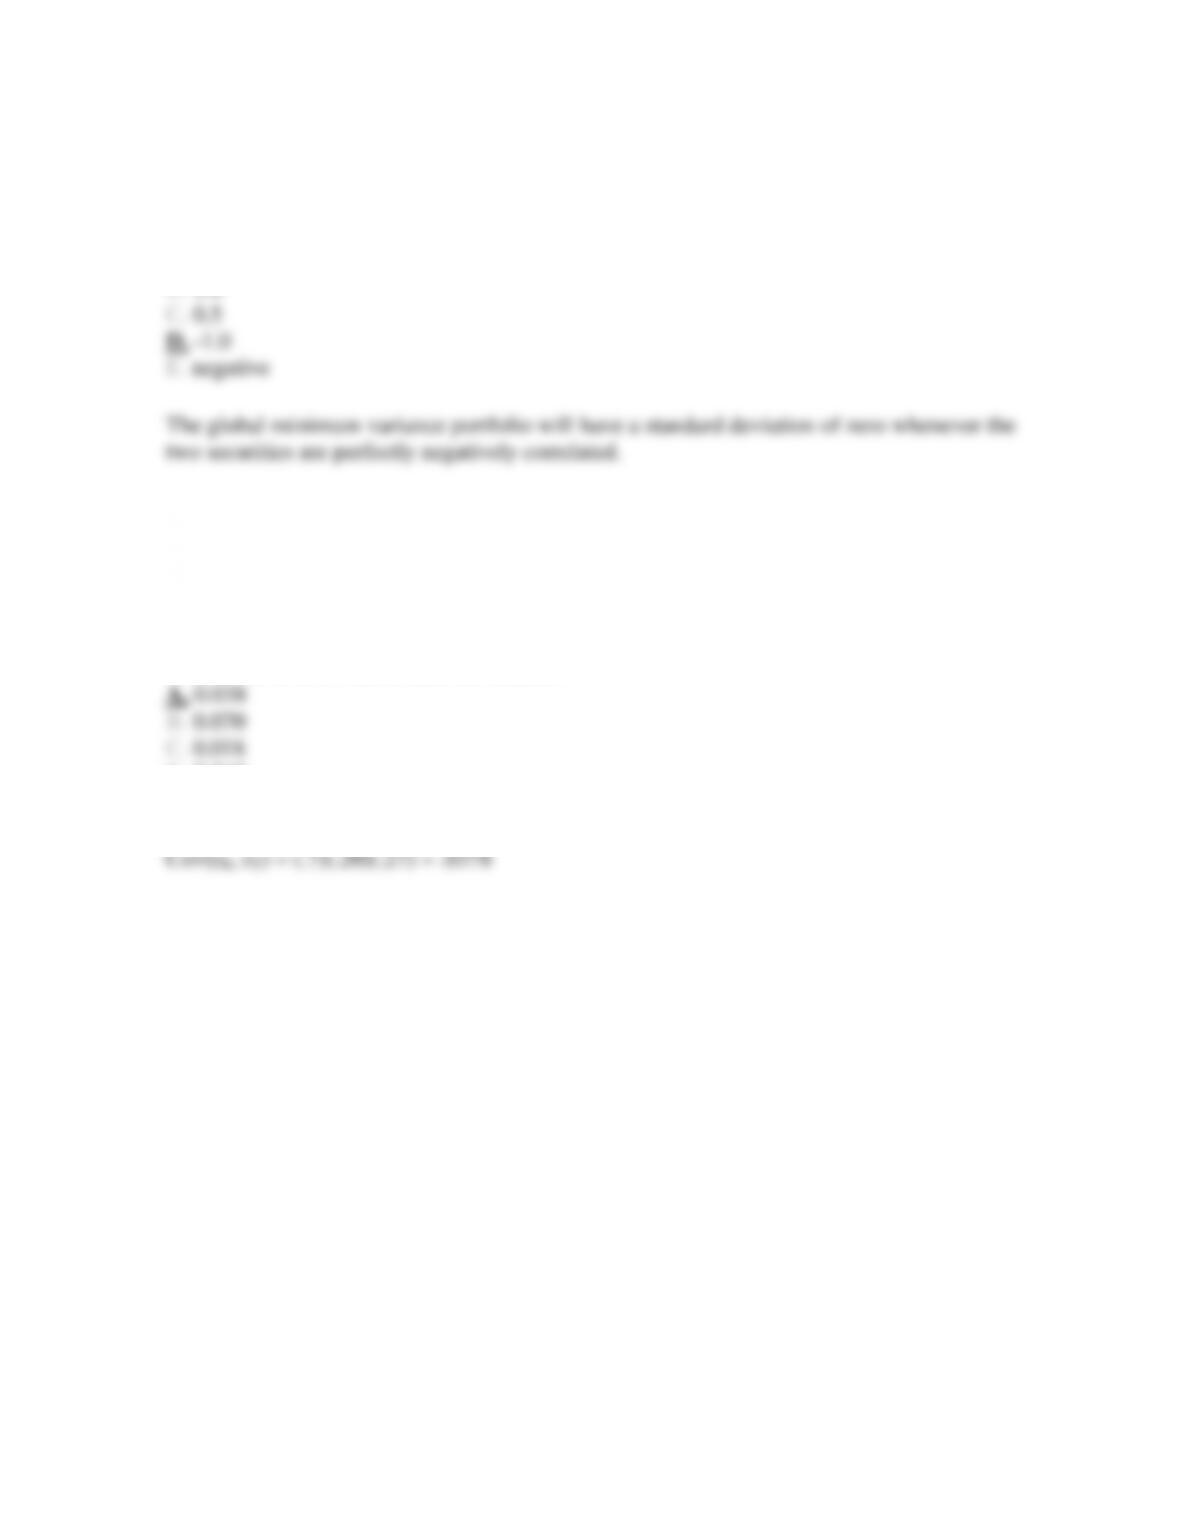
45. The global minimum variance portfolio formed from two risky securities will be riskless
when the correlation coefficient between the two securities is
A. 0.0
B. 1.0
Difficulty: Moderate
46. Security X has expected return of 12% and standard deviation of 20%. Security Y has
expected return of 15% and standard deviation of 27%. If the two securities have a correlation
coefficient of 0.7, what is their covariance?
D. 0.013
E. 0.054
Difficulty: Moderate
Chapter 07 – Optimal Risky Portfolios
7-21
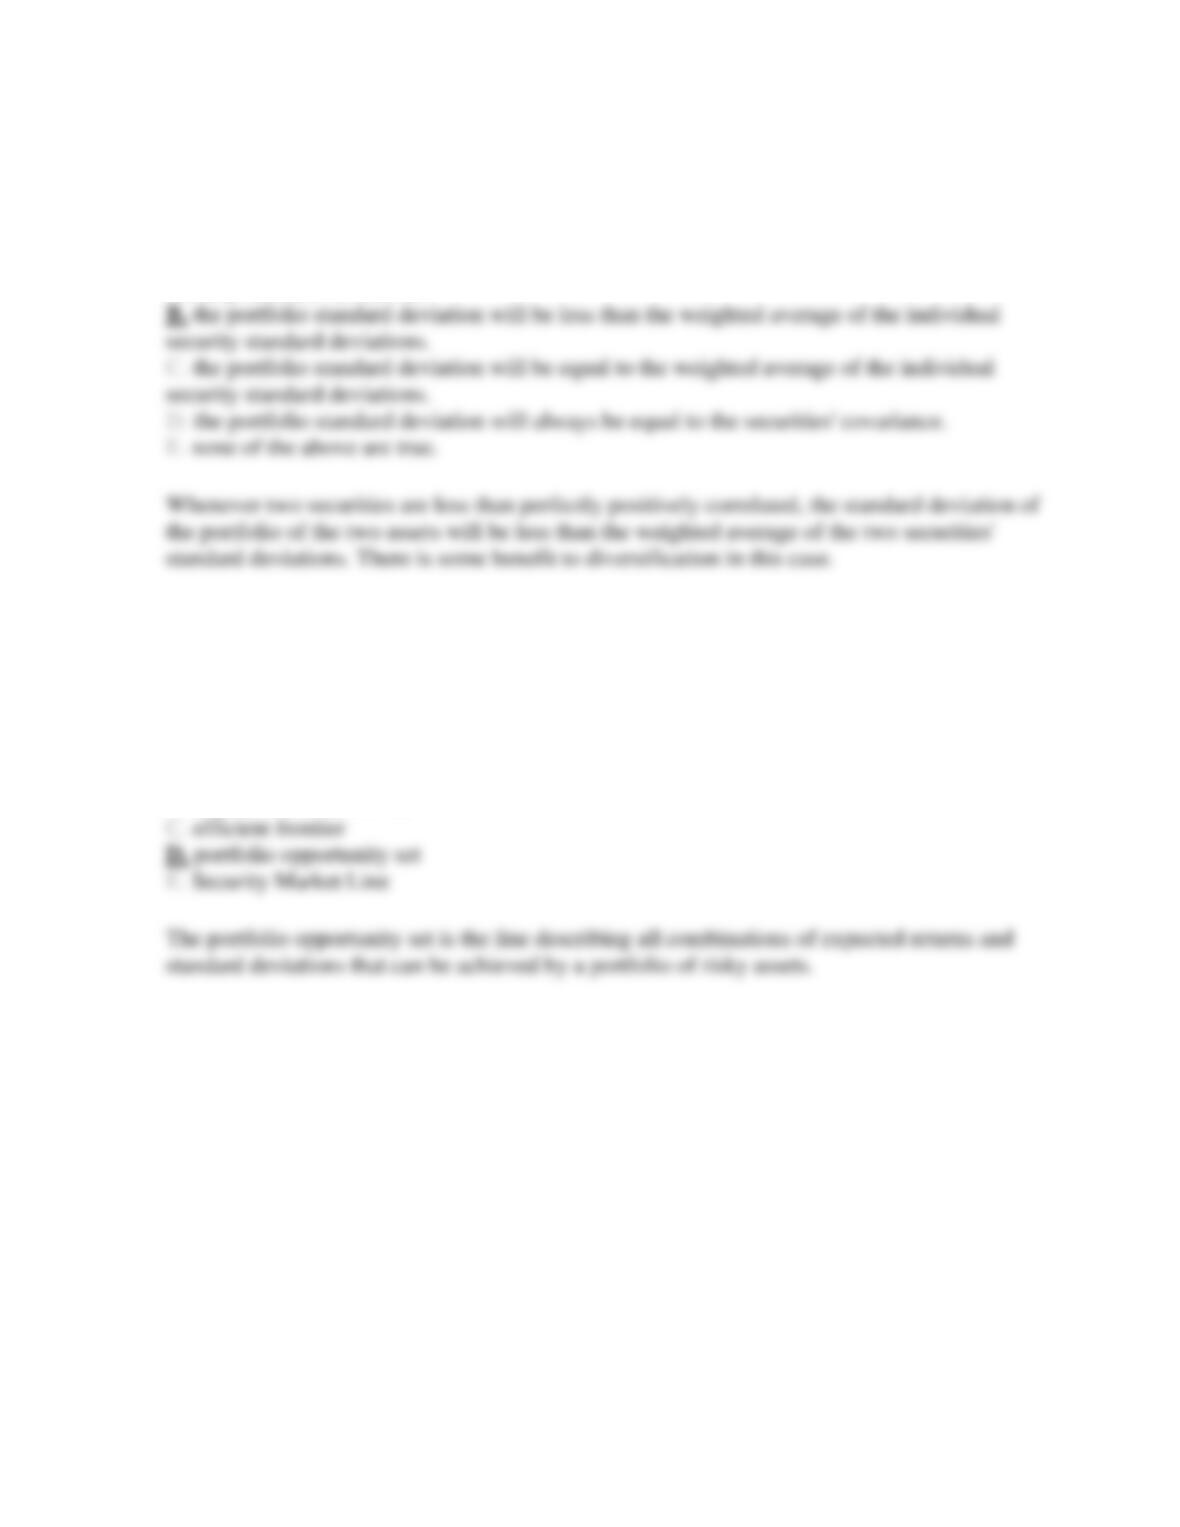
47. When two risky securities that are positively correlated but not perfectly correlated are
held in a portfolio,
A. the portfolio standard deviation will be greater than the weighted average of the individual
security standard deviations.
Difficulty: Moderate
48. The line representing all combinations of portfolio expected returns and standard
deviations that can be constructed from two available assets is called the
A. risk/reward tradeoff line
B. Capital Allocation Line
Difficulty: Easy
Chapter 07 – Optimal Risky Portfolios
7-22
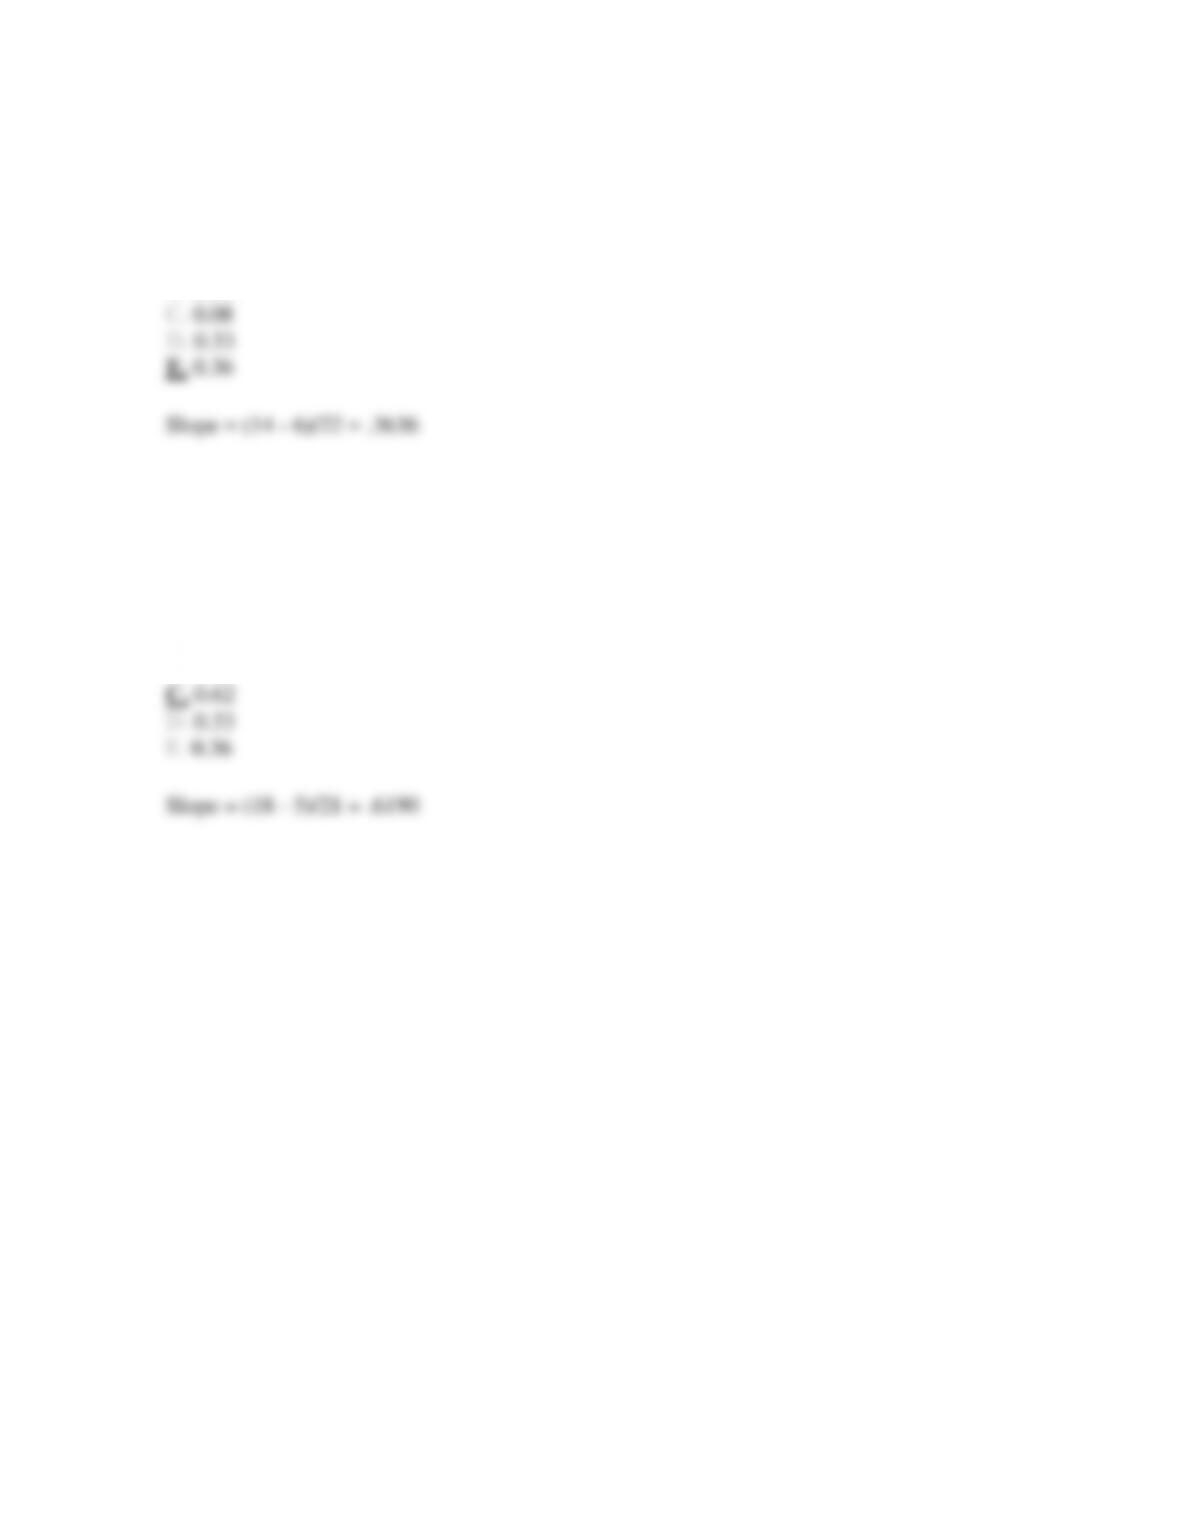
49. Given an optimal risky portfolio with expected return of 14% and standard deviation of
22% and a risk free rate of 6%, what is the slope of the best feasible CAL?
A. 0.64
B. 0.14
Difficulty: Moderate
50. Given an optimal risky portfolio with expected return of 18% and standard deviation of
21% and a risk free rate of 5%, what is the slope of the best feasible CAL?
A. 0.64
B. 0.14
Difficulty: Moderate
Chapter 07 – Optimal Risky Portfolios
7-23
51. The risk that can be diversified away in a portfolio is referred to as ___________.
I) diversifiable risk
II) unique risk
III) systematic risk
IV) firm-specific risk
A. I, III, and IV
B. II, III, and IV
Difficulty: Moderate
52. As the number of securities in a portfolio is increased, what happens to the average
portfolio standard deviation?
A. It increases at an increasing rate.
Difficulty: Moderate
Chapter 07 – Optimal Risky Portfolios
7-24
53. In words, the covariance considers the probability of each scenario happening and the
interaction between
A. securities’ returns relative to their variances.
Difficulty: Difficult
54. The standard deviation of a two-asset portfolio is a linear function of the assets’ weights
when
A. the assets have a correlation coefficient less than zero.
B. the assets have a correlation coefficient equal to zero.
Difficulty: Moderate
Chapter 07 – Optimal Risky Portfolios
7-25
55. A two-asset portfolio with a standard deviation of zero can be formed when
A. the assets have a correlation coefficient less than zero.
B. the assets have a correlation coefficient equal to zero.
Difficulty: Moderate
56. When borrowing and lending at a risk-free rate are allowed, which Capital Allocation
Line (CAL) should the investor choose to combine with the efficient frontier?
I) with the highest reward-to-variability ratio.
II) that will maximize his utility.
III) with the steepest slope.
IV) with the lowest slope.
A. I and III
B. I and IV
Difficulty: Difficult
Chapter 07 – Optimal Risky Portfolios
7-26
57. Which Excel tool can be used to find the points along an efficient frontier?
D. Goal Seek
E. Data Analysis
Difficulty: Moderate
58. The separation property refers to the conclusion that
D. the determination of the best CAL is objective and the choice of the inputs to be used to
determine the efficient frontier is subjective.
E. investors are separate beings and will therefore have different preferences regarding the
risk-return tradeoff.
Difficulty: Difficult
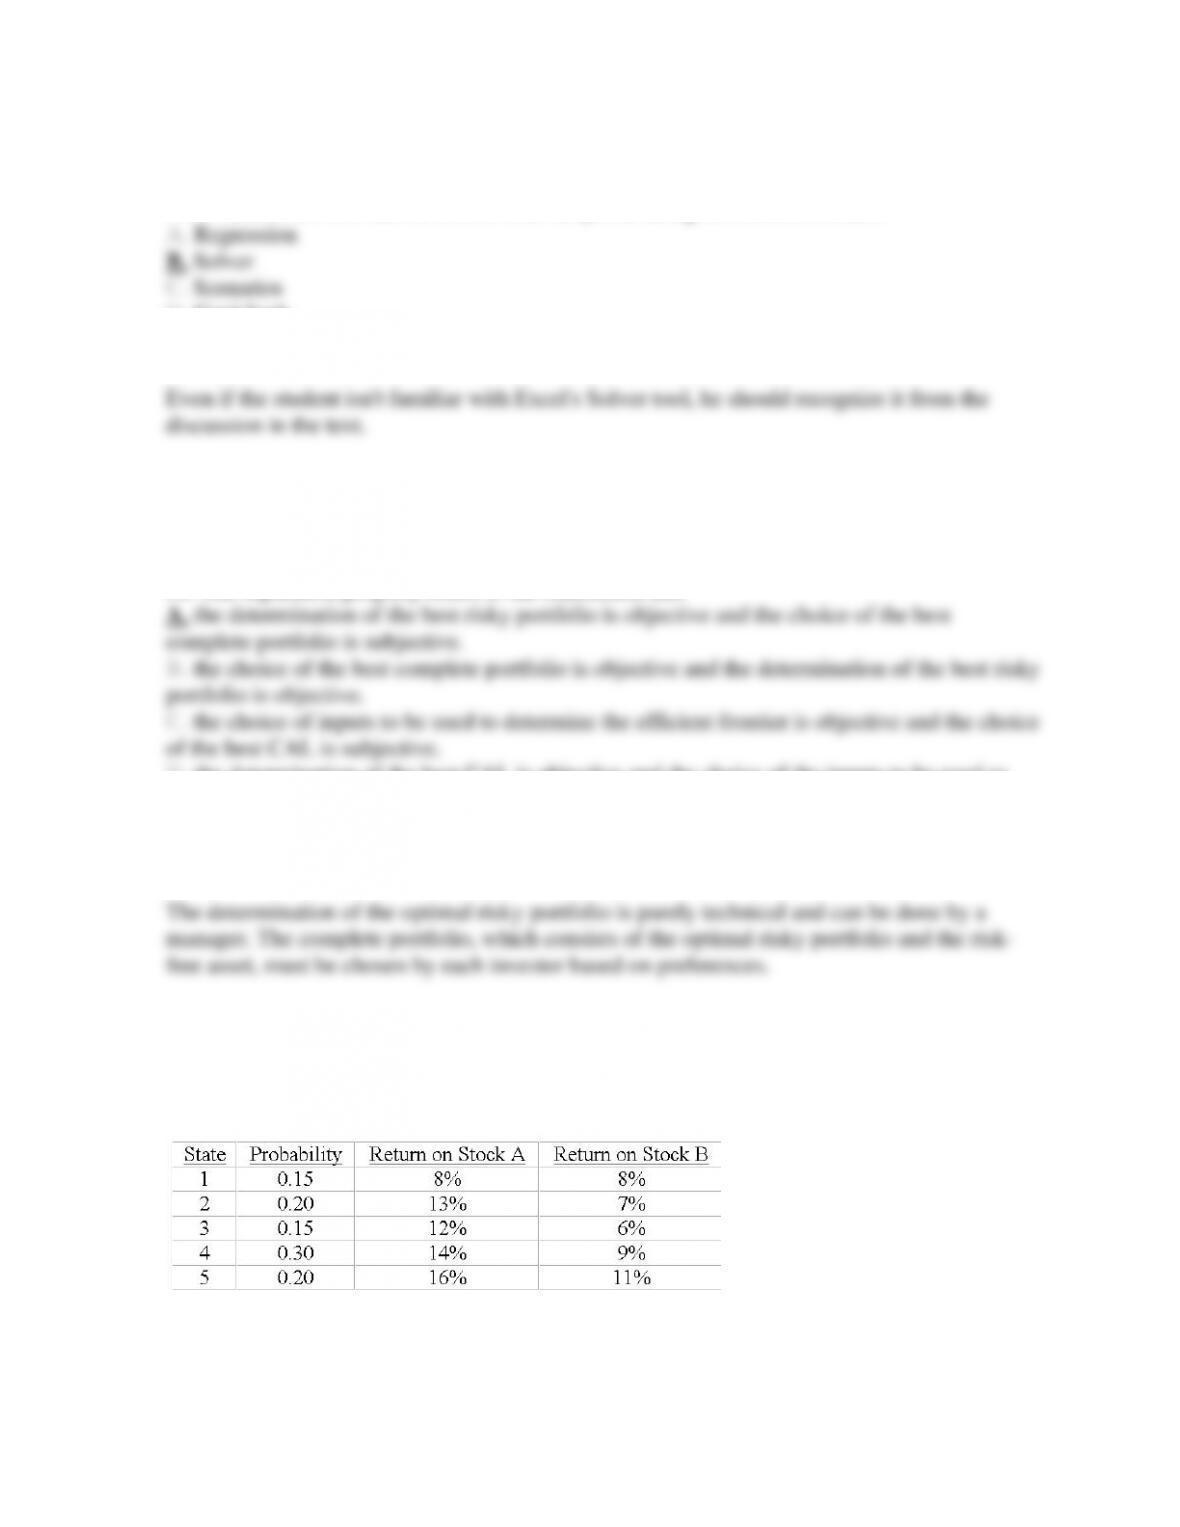
Consider the following probability distribution for stocks A and B:
Chapter 07 – Optimal Risky Portfolios
7-27
59. The expected rates of return of stocks A and B are _____ and _____, respectively.
D. 7.7%; 13.2%
E. none of the above
Difficulty: Easy
60. The standard deviations of stocks A and B are _____ and _____, respectively.
D. 1.54%; 1.11%
E. none of the above
Difficulty: Moderate
61. The coefficient of correlation between A and B is
A. 0.474.
B. 0.612.
Difficulty: Difficult
Chapter 07 – Optimal Risky Portfolios
7-28
62. If you invest 35% of your money in A and 65% in B, what would be your portfolio’s
expected rate of return and standard deviation?
A. 9.9%; 3%
B. 9.9%; 1.1%
Difficulty: Difficult
Consider two perfectly negatively correlated risky securities A and B. A has an expected rate
of return of 12% and a standard deviation of 17%. B has an expected rate of return of 9% and
a standard deviation of 14%.
63. The weights of A and B in the global minimum variance portfolio are _____ and _____,
respectively.
A. 0.24; 0.76
B. 0.50; 0.50
Difficulty: Moderate
Chapter 07 – Optimal Risky Portfolios
7-29
64. The risk-free portfolio that can be formed with the two securities will earn _____ rate of
return.
A. 9.5%
Difficulty: Difficult
65. Security X has expected return of 14% and standard deviation of 22%. Security Y has
expected return of 16% and standard deviation of 28%. If the two securities have a correlation
coefficient of 0.8, what is their covariance?
A. 0.038
Difficulty: Moderate
66. Security X has expected return of 9% and standard deviation of 18%. Security Y has
expected return of 12% and standard deviation of 21%. If the two securities have a correlation
coefficient of -0.4, what is their covariance?
A. 0.0388
B. 0.0706
Difficulty: Moderate
Chapter 07 – Optimal Risky Portfolios
7-30
67. Given an optimal risky portfolio with expected return of 16% and standard deviation of
20% and a risk free rate of 4%, what is the slope of the best feasible CAL?
D. 0.36
E. 0.31
Difficulty: Moderate
68. Given an optimal risky portfolio with expected return of 12% and standard deviation of
26% and a risk free rate of 3%, what is the slope of the best feasible CAL?
A. 0.64
B. 0.14
Difficulty: Moderate
Consider the following probability distribution for stocks C and D:
Chapter 07 – Optimal Risky Portfolios
7-31
69. The expected rates of return of stocks C and D are _____ and _____, respectively.
D. 8.7%; 6.2%
E. none of the above
Difficulty: Easy
70. The standard deviations of stocks C and D are _____ and _____, respectively.
A. 7.62%; 11.24%
B. 11.24%; 7.62%
Difficulty: Moderate
71. The coefficient of correlation between C and D is
A. 0.665.
B. 0.554.
Difficulty: Difficult
Chapter 07 – Optimal Risky Portfolios
7-32
72. If you invest 25% of your money in C and 75% in D, what would be your portfolio’s
expected rate of return and standard deviation?
A. 9.891%; 8.63%
B. 9.945%; 11.12%
Difficulty: Difficult
Consider two perfectly negatively correlated risky securities K and L. K has an expected rate
of return of 13% and a standard deviation of 19%. L has an expected rate of return of 10%
and a standard deviation of 16%.
73. The weights of K and L in the global minimum variance portfolio are _____ and _____,
respectively.
A. 0.24; 0.76
B. 0.50; 0.50
Difficulty: Moderate
Chapter 07 – Optimal Risky Portfolios
7-33
74. The risk-free portfolio that can be formed with the two securities will earn _____ rate of
return.
A. 9.5%
Difficulty: Difficult
75. Security M has expected return of 17% and standard deviation of 32%. Security S has
expected return of 13% and standard deviation of 19%. If the two securities have a correlation
coefficient of 0.78, what is their covariance?
A. 0.038
B. 0.049
Difficulty: Moderate
76. Security X has expected return of 7% and standard deviation of 12%. Security Y has
expected return of 11% and standard deviation of 20%. If the two securities have a correlation
coefficient of -0.45, what is their covariance?
A. 0.0388
Difficulty: Moderate
Chapter 07 – Optimal Risky Portfolios
7-34
77. Given an optimal risky portfolio with expected return of 13% and standard deviation of
26% and a risk free rate of 5%, what is the slope of the best feasible CAL?
A. 0.60
B. 0.14
Difficulty: Moderate
78. Given an optimal risky portfolio with expected return of 12% and standard deviation of
23% and a risk free rate of 3%, what is the slope of the best feasible CAL?
A. 0.64
Difficulty: Moderate
Chapter 07 – Optimal Risky Portfolios
7-35
Short Answer Questions
79. Theoretically, the standard deviation of a portfolio can be reduced to what level? Explain.
Realistically, is it possible to reduce the standard deviation to this level? Explain.
Theoretically, if one could find two securities with perfectly negatively correlated returns
(correlation coefficient = -1), one could solve for the weights of these securities that would
Difficulty: Moderate
80. Discuss how the investor can use the separation theorem and utility theory to produce an
efficient portfolio suitable for the investor’s level of risk tolerance.
One can identify the optimum risky portfolio as the portfolio at the point of tangency between
a ray extending from the risk-free rate and the efficient frontier of risky securities. Below the
point of tangency on this ray from the risk-free rate, the efficient portfolios consist of both the
optimum risky portfolio and risk-free investments (T-bills); above the point of tangency, the
Difficulty: Moderate
Chapter 07 – Optimal Risky Portfolios
7-36
81. State Markowitz’s mean-variance criterion. Give some numerical examples of how the
criterion would be applied.
The mean-variance criterion states that asset A dominates asset B if and only if E(RA) is
greater than or equal to E(RB) and the standard deviation of A’s returns is less than or equal to
Difficulty: Easy
82. Draw a graph of a typical efficient frontier. Explain why the efficient frontier is shaped
the way it is.
The efficient frontier has a curved appearance, as shown throughout the chapter. Figure 7-5
shows several correlation values and the corresponding shapes of the frontier. The typical
Difficulty: Moderate