68.
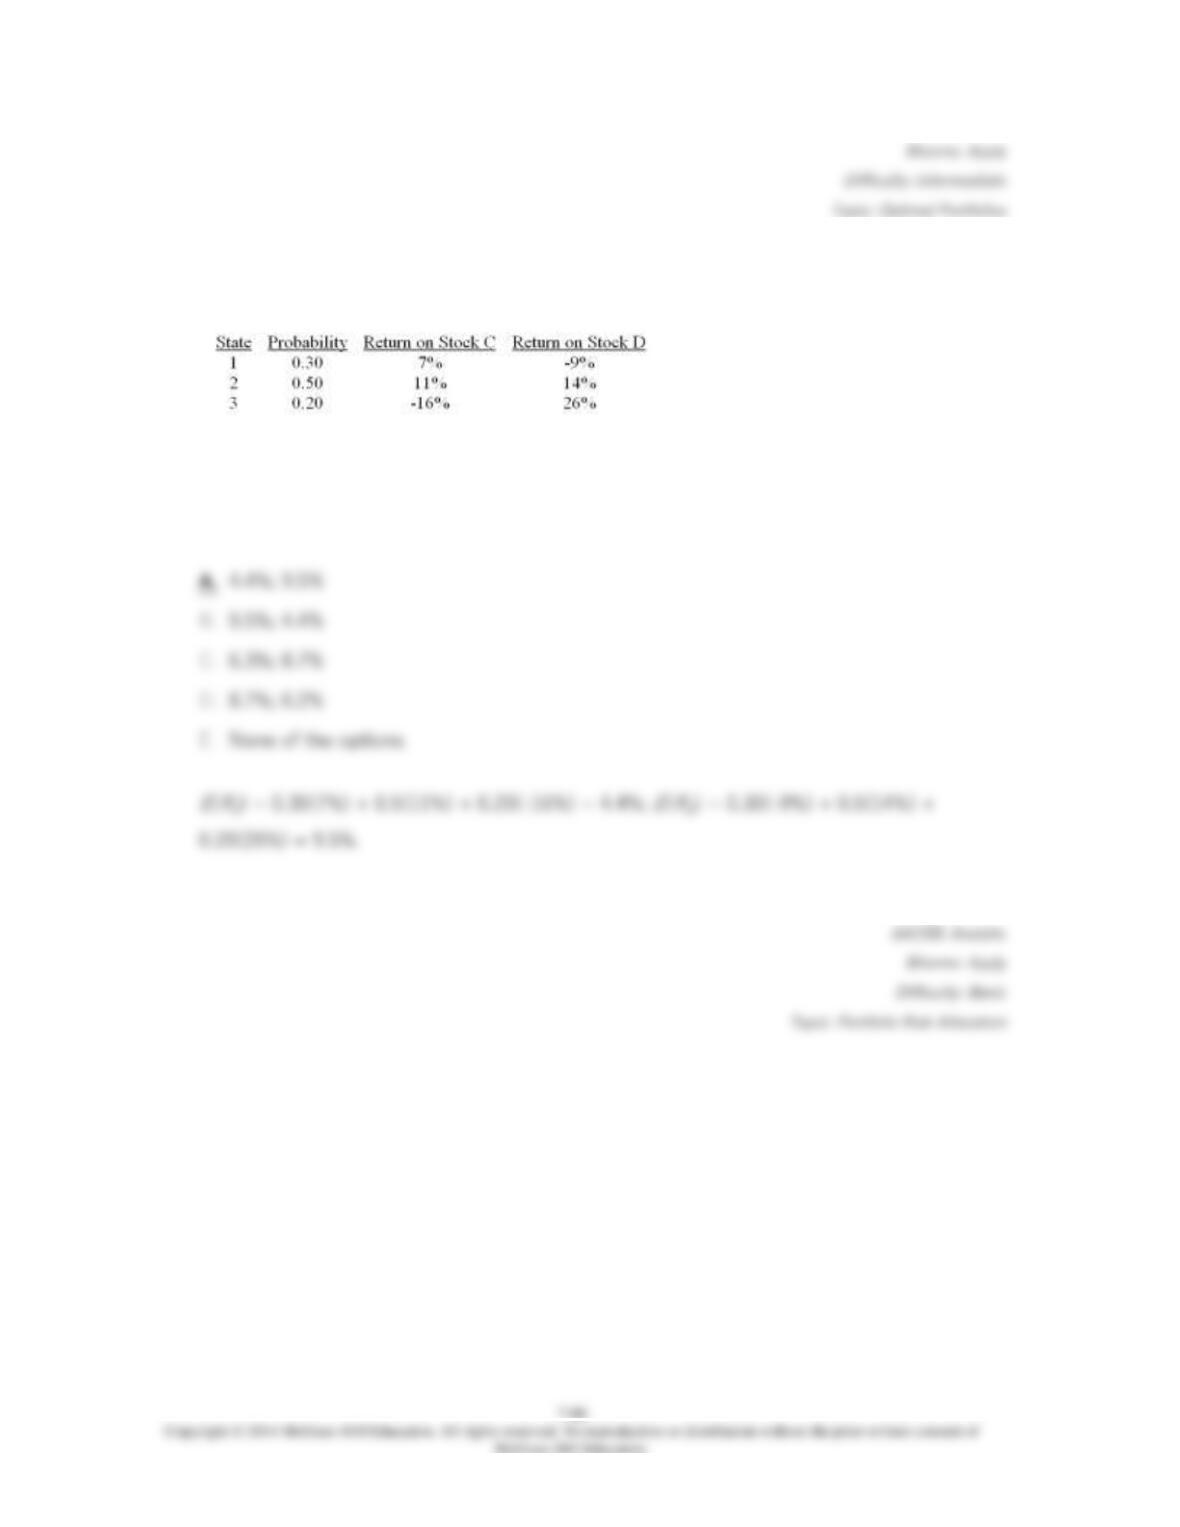
Consider the following probability distribution for stocks C and D:
The expected rates of return of stocks C and D are _____ and _____, respectively.
69.
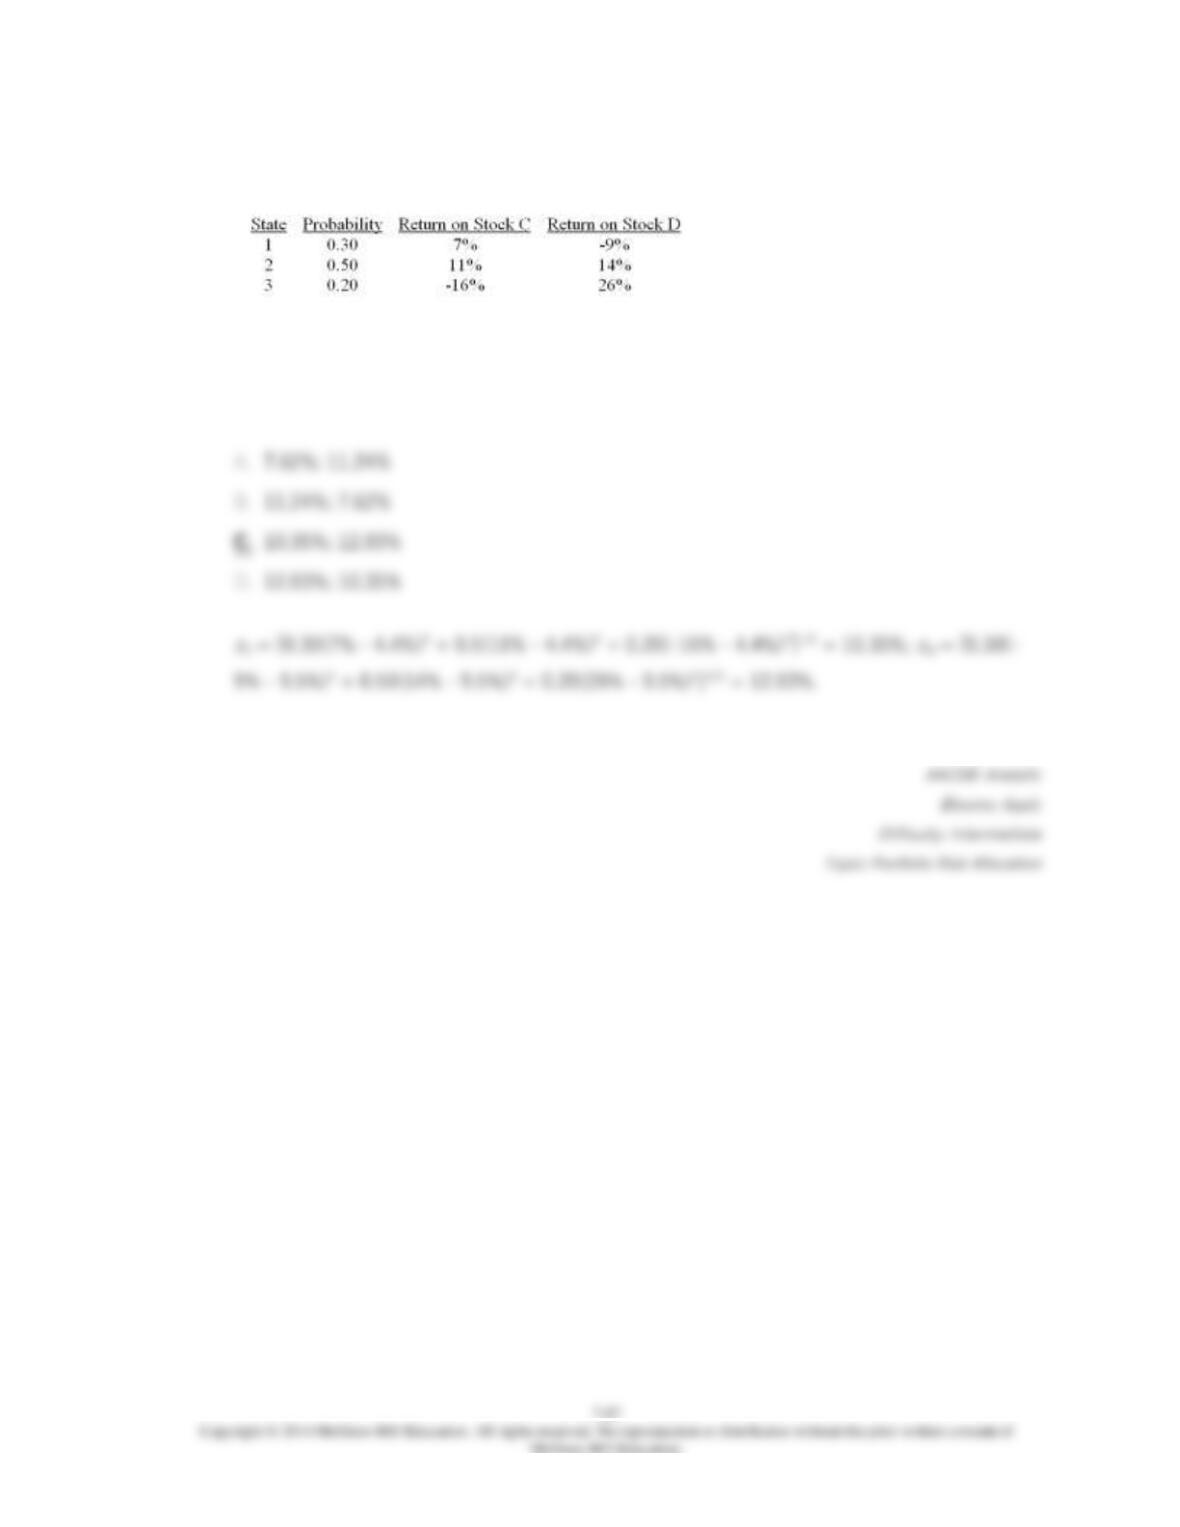
Consider the following probability distribution for stocks C and D:
The standard deviations of stocks C and D are _____ and _____, respectively.
70.
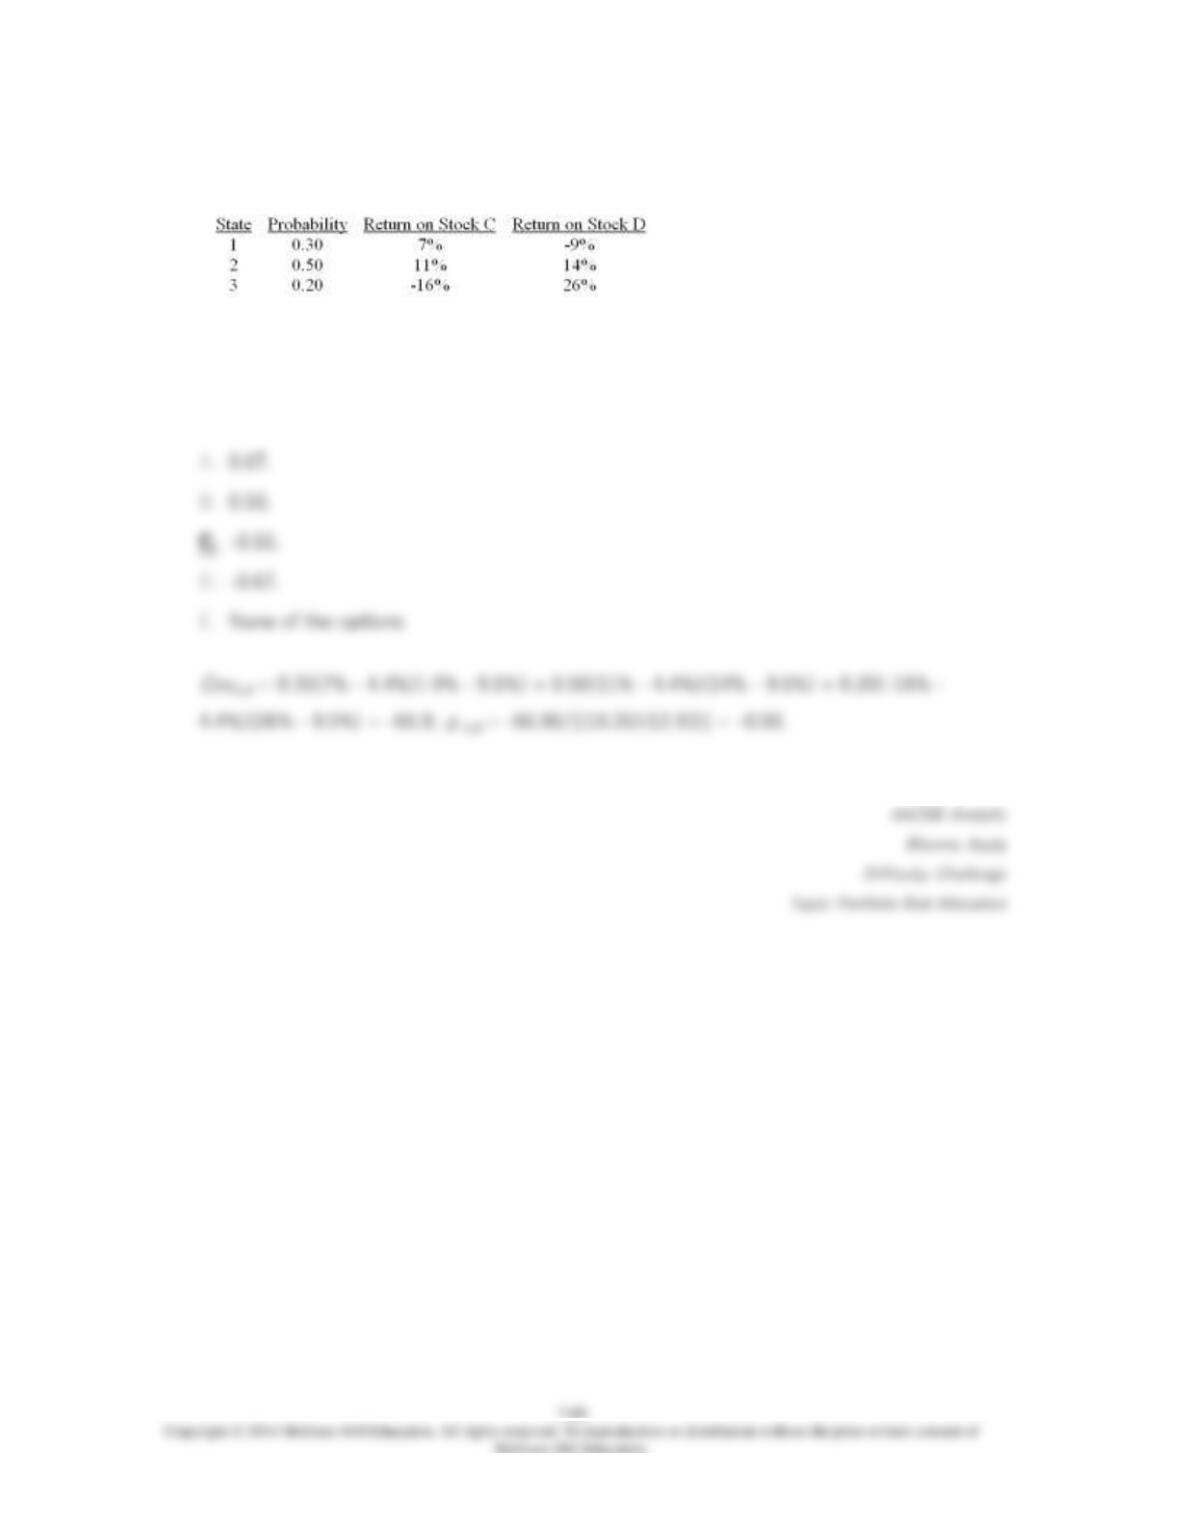
Consider the following probability distribution for stocks C and D:
The coefficient of correlation between C and D is
71.
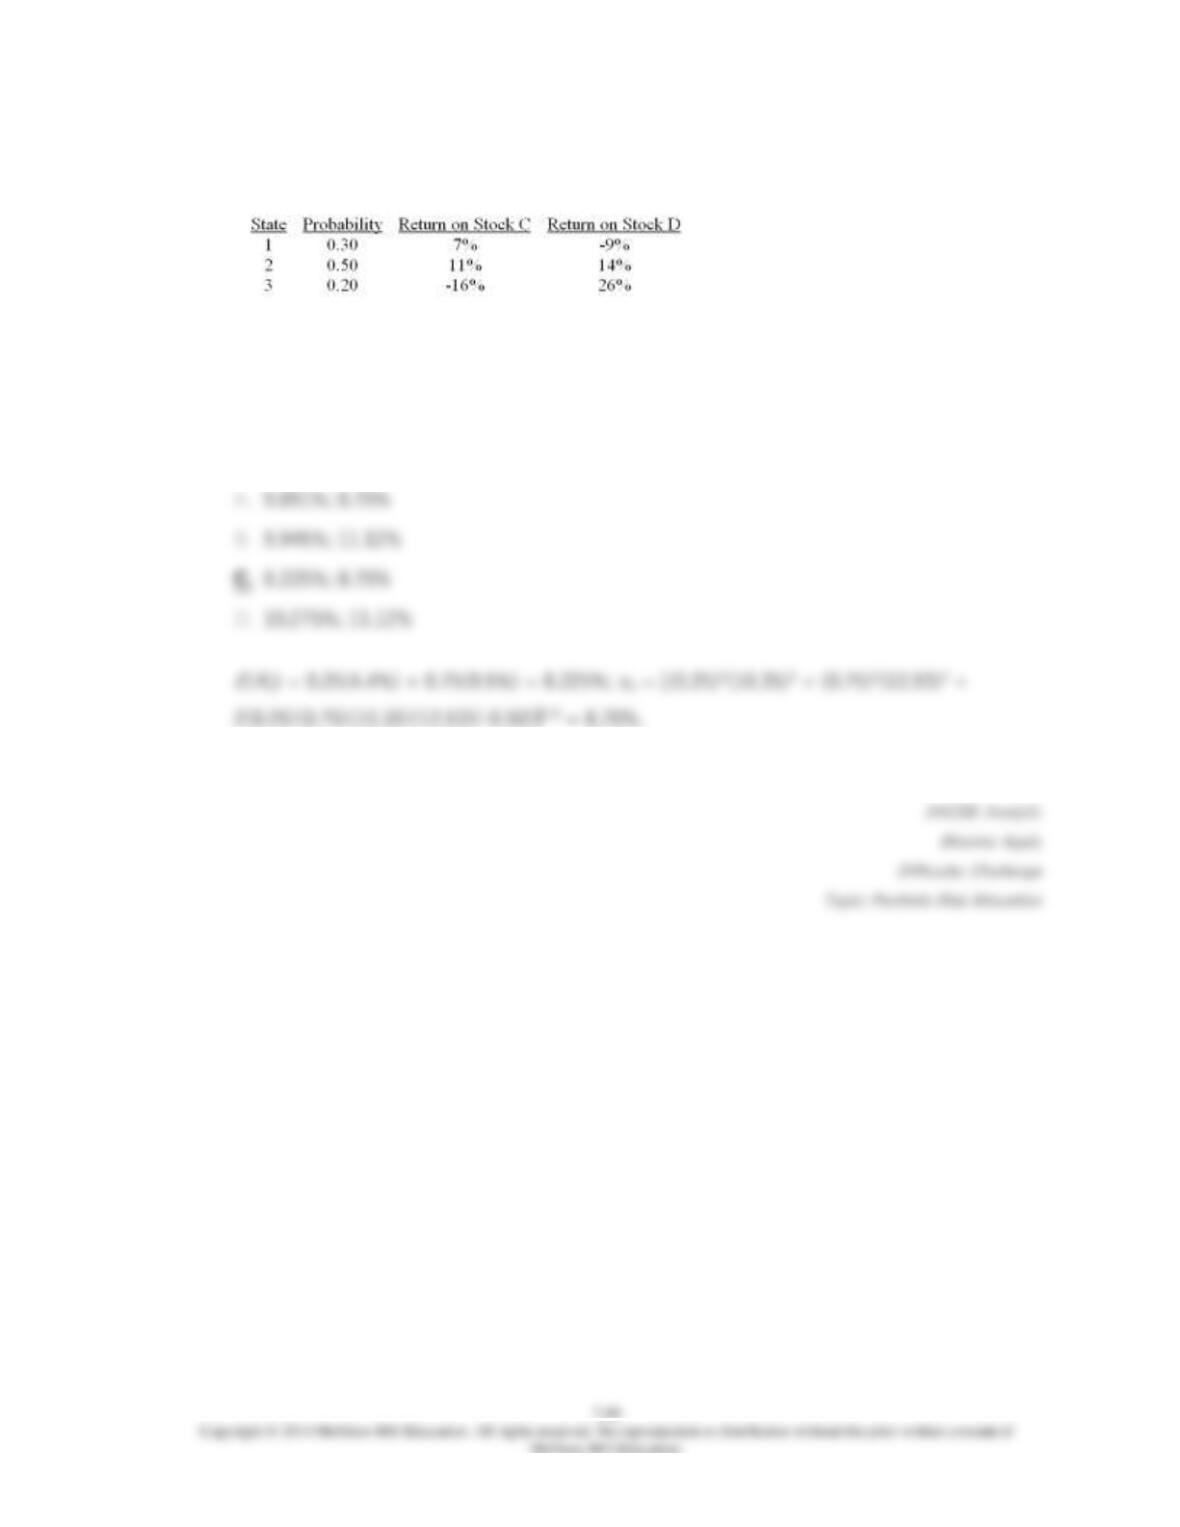
Consider the following probability distribution for stocks C and D:
If you invest 25% of your money in C and 75% in D, what would be your portfolio’s
expected rate of return and standard deviation?

72.
Consider two perfectly negatively correlated risky securities, K and L. K has an expected
rate of return of 13% and a standard deviation of 19%. L has an expected rate of return of
10% and a standard deviation of 16%.
The weights of K and L in the global minimum variance portfolio are _____ and _____,
respectively.

73.
Consider two perfectly negatively correlated risky securities, K and L. K has an expected
rate of return of 13% and a standard deviation of 19%. L has an expected rate of return of
10% and a standard deviation of 16%.
The risk-free portfolio that can be formed with the two securities will earn _____ rate of
return.
74.
Security M has expected return of 17% and standard deviation of 32%. Security S has
expected return of 13% and standard deviation of 19%. If the two securities have a
correlation coefficient of 0.78, what is their covariance?
75.
Security X has expected return of 7% and standard deviation of 14%. Security Y has
expected return of 11% and standard deviation of 22%. If the two securities have a
correlation coefficient of -0.45, what is their covariance?
7-93
76.
Security X has expected return of 9% and standard deviation of 18%. Security Y has
expected return of 12% and standard deviation of 21%. If the two securities have a
correlation coefficient of -0.4, what is their covariance?
Short Answer Questions
77.
Theoretically, the standard deviation of a portfolio can be reduced to what level? Explain.
Realistically, is it possible to reduce the standard deviation to this level? Explain.
78.
Discuss how the investor can use the separation theorem and utility theory to produce an
efficient portfolio suitable for the investor’s level of risk tolerance.
79.
State Markowitz’s mean-variance criterion. Give some numerical examples of how the
criterion would be applied.
80.
Draw a graph of a typical efficient frontier. Explain why the efficient frontier is shaped the
way it is.