Chapter 06 – An Introduction to Portfolio Management
52. Refer to Exhibit 6.6. What is the standard deviation of this portfolio?
a.
6.08%
b.
5.89%
c.
7.06%
d.
6.54%
e.
7.26%
Exhibit 6.7
USE THE INFORMATION BELOW FOR THE FOLLOWING PROBLEM(S)
Asset (A)
Asset (B)
E(RA) = 7%
E(RB) = 9%
(A) = 6%
(B) = 5%
WA = 0.6
WB = 0.4
COVA,B = 0.0014
53. Refer to Exhibit 6.7. What is the expected return of a portfolio of two risky assets if the expected return E(Ri),
standard deviation (i), covariance (COVi,j), and asset weight (Wi) are as shown above?
a.
5.8%
b.
6.1%
c.
6.9%
d.
7.8%
e.
8.9%
54. Refer to Exhibit 6.7. What is the standard deviation of this portfolio?
a.
4.87%
b.
3.62%
c.
4.13%
d.
5.76%
e.
6.02%
Exhibit 6.8
USE THE INFORMATION BELOW FOR THE FOLLOWING PROBLEM(S)
Asset (A)
Asset (B)
E(RA) = 10%
E(RB) = 14%
(A) = 7%
(B) = 8%
WA = 0.7
WB = 0.3
COVA,B = 0.0013
55. Refer to Exhibit 6.8. What is the expected return of a portfolio of two risky assets if the expected return E(Ri),
standard deviation (i), covariance (COVi,j), and asset weight (Wi) are as shown above?
a.
6.4%
b.
9.1%
c.
10.2%
d.
10.8%
e.
11.2%
56. Refer to Exhibit 6.8. What is the standard deviation of this portfolio?
a.
4.51%
b.
5.94%
c.
6.75%
d.
7.09%
e.
8.62%
Exhibit 6.9
USE THE INFORMATION BELOW FOR THE FOLLOWING PROBLEM(S)
Asset (A)
Asset (B)
E(RA) = 18%
E(RB) = 13%
(A) = 7%
(B) = 6%
WA = 0.3
WB = 0.7
COVA,B = 0.0011
57. Refer to Exhibit 6.9. What is the expected return of a portfolio of two risky assets if the expected return E(Ri),
standard deviation (i), covariance (COVi,j), and asset weight (Wi) are as shown above?
a.
10.10%
b.
11.60%
c.
13.88%
d.
14.50%
e.
15.37%
58. Refer to Exhibit 6.9. What is the standard deviation of this portfolio?
a.
5.16%
b.
5.89%
c.
6.11%
d.
6.57%
e.
7.02%
Exhibit 6.10
USE THE INFORMATION BELOW FOR THE FOLLOWING PROBLEM(S)
Asset (A)
Asset (B)
E(RA) = 16%
E(RB) = 14%
(A) = 3%
(B) = 8%
WA = 0.5
WB = 0.5
COVA,B = 0.0014
59. Refer to Exhibit 6.10. What is the expected return of a portfolio of two risky assets if the expected return E(Ri),
standard deviation (i), covariance (COVi,j), and asset weight (Wi) are as shown above?
a.
11%
b.
12%
c.
13%
d.
14%
e.
15%
60. Refer to Exhibit 6.10. What is the standard deviation of this portfolio?
a.
3.02%
b.
4.88%
c.
5.24%
d.
5.98%
e.
6.52%
Exhibit 6.11
USE THE INFORMATION BELOW FOR THE FOLLOWING PROBLEM(S)
Asset 1
Asset 2
E(R1) = 0.28
E(R2) = 0.12
E(1) = 0.15
E(2) = 0.11
W1 = 0.42
W2 = 0.58
r1,2 = 0.7
61. Refer to Exhibit 6.11. Calculate the expected return of the two-stock portfolio.
a.
0.107
b.
0.1367
c.
0.1169
d.
0.1872
e.
0.20
62. Refer to Exhibit 6.11. Calculate the expected standard deviation of the two-stock portfolio.
a.
0.1367
b.
0.1872
c.
0.1169
d.
0.20
e.
0.3950
Exhibit 6.12
USE THE INFORMATION BELOW FOR THE FOLLOWING PROBLEM(S)
Asset 1
Asset 2
E(R1) = .12
E(R2) = .16
E(1) = .04
E(2) = .06
63. Refer to Exhibit 6.12. Calculate the expected return and expected standard deviation of a two-stock portfolio when r1,2
= −.60 and w1 = .75.
a.
.13 and .0024
b.
.13 and .0455
c.
.12 and .0585
d.
.12 and .5585
e.
.13 and .6758
64. Refer to Exhibit 6.12. Calculate the expected returns and expected standard deviations of a two-stock portfolio when
r1,2 = .80 and w1 = .60.
a.
.144 and .0002
b.
.144 and .0018
c.
.136 and .0045
d.
.136 and .0455
e.
.136 and .4554
65. Consider two securities, A and B. Security A and B have a correlation coefficient of 0.65. Security A has standard
deviation of 12, and security B has standard deviation of 25. Calculate the covariance between these two securities.
a.
300
b.
461.54
c.
261.54
d.
195
e.
200
66. Calculate the expected return for a three-asset portfolio with the following
Asset
Exp. Ret.
Std. Dev
Weight
A
0.0675
0.12
0.25
B
0.1235
0.1675
0.35
C
0.1425
0.1835
0.40
a.
11.71 percent
b.
11.12 percent
c.
15.70 percent
d.
14.25 percent
e.
6.75 percent
67. Given the following weights and expected security returns, calculate the expected return for the portfolio.
Weight
Expected Return
.20
.06
.25
.08
.30
.10
.25
.12
a.
0.085
b.
0.090
c.
0.092
d.
0.097
e.
0.099
Chapter 06 – An Introduction to Portfolio Management
Exhibit 6.13
USE THE INFORMATION BELOW FOR THE FOLLOWING PROBLEM(S)
A financial analyst covering Magnum Oil has determined the following four possible returns given four different states of
the economy over the next period.
Probability
Return
0.10
−.20
0.25
−.05
0.40
0.15
0.25
0.30
68. Refer to Exhibit 6.13. Calculate the expected return for Magnum Oil.
a.
5.0 percent
b.
10.3 percent
c.
13.7 percent
d.
17.5 percent
e.
20.0 percent
69. Refer to Exhibit 6.13. Calculate the standard deviation for Magnum Oil.
a.
0 percent
b.
11 percent
c.
16 percent
d.
20 percent
e.
26 percent
Chapter 06 – An Introduction to Portfolio Management
Exhibit 6.14
USE THE INFORMATION BELOW FOR THE FOLLOWING PROBLEM(S)
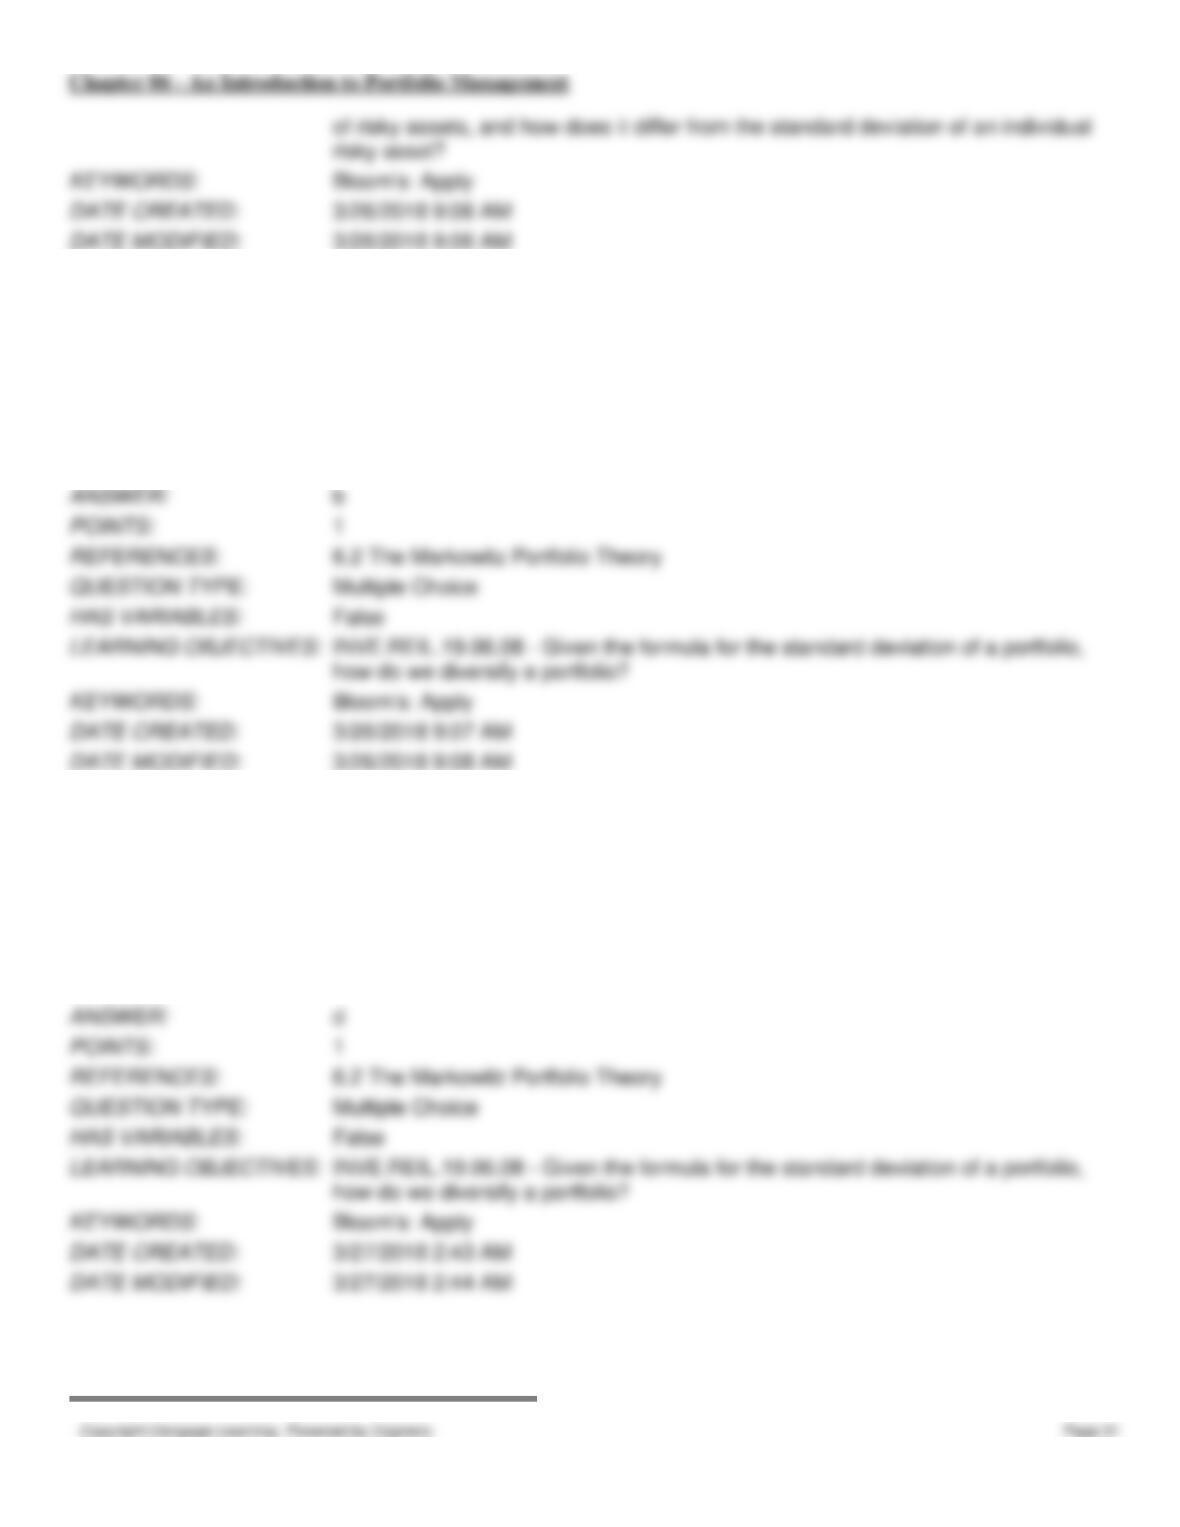
Stocks A and B have a correlation coefficient of −0.8. The stocks’ expected returns and standard deviations are in the table
below. A portfolio consisting of 40% of stock A and 60% of stock B is constructed.
Stock
Expected Return
Standard Deviation
A
20%
25%
B
15%
19%
70. Refer to Exhibit 6.14. What is the expected return of the stock A and B portfolio?
a.
17.0%
b.
17.5%
c.
18.0%
d.
18.5%
e.
19.0%
71. Refer to Exhibit 6.14. What is the standard deviation of the stock A and B portfolio?
a.
0.0%
b.
0.5%
c.
4.1%
d.
6.9%
e.
20.3%
72. Refer to Exhibit 6.14. What percentage of stock A should be invested to obtain the minimum risk portfolio that
contains stock A and B?
a.
35%
b.
42%
c.
58%
d.
65%
e.
72%
73. What is the standard deviation of an equally weighted portfolio of two stocks with a covariance of 0.009, if the
standard deviation of the first stock is 15% and the standard deviation of the second stock is 20%?
a.
2.0%
b.
2.1%
c.
7.8%
d.
14.2%
e.
14.7%
Exhibit 6.15
USE THE INFORMATION BELOW FOR THE FOLLOWING PROBLEM(S)
Asset (A)
Asset (B)
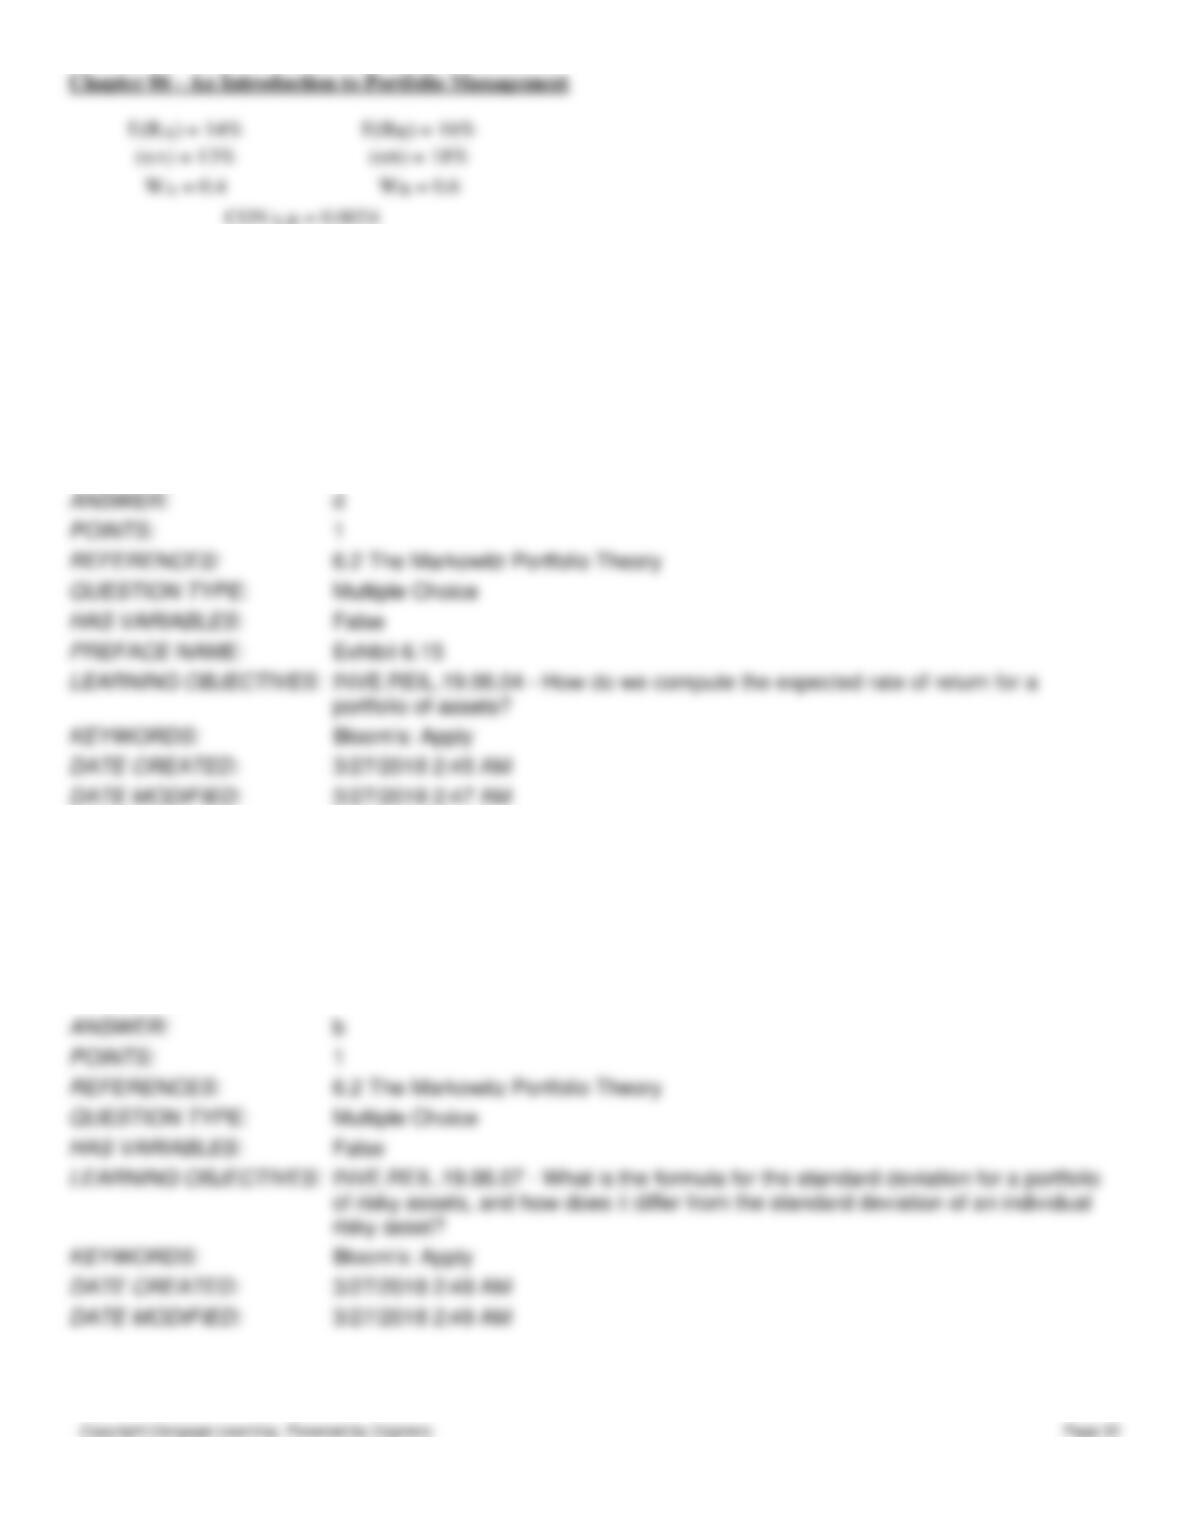
74. Refer to Exhibit 6.15. What is the expected return of a portfolio of two risky assets if the expected return E(Ri),
standard deviation (i), covariance (COVi,j), and asset weight (Wi) are as shown above?
a.
13.8%
b.
14.6%
c.
15.0%
d.
15.2%
e.
16.8%
75. Refer to Exhibit 6.15. What is the standard deviation of this portfolio?
a.
10.0%
b.
12.5%
c.
14.4%
d.
15.5%
e.
16.0%
Exhibit 6.16
USE THE INFORMATION BELOW FOR THE FOLLOWING PROBLEM(S)
Chapter 06 – An Introduction to Portfolio Management
Based on the economic outlook for the industry, a financial analyst covering Top Choice Corporation has determined the
following three possible returns given three different states of the economy over the next period.
Probability
Return
0.25
0.02
0.50
0.14
0.25
0.30
76. Refer to Exhibit 6.16. What is the expected return for Top Choice Corporation?
a.
5.2 percent
b.
10.4 percent
c.
13.7 percent
d.
15.0 percent
e.
17.6 percent
77. Refer to Exhibit 6.16. What is the standard deviation for Top Choice Corporation?
a.
0.1 percent
b.
6.3 percent
c.
7.9 percent
d.
9.4 percent
e.
12.1 percent
78. The purpose of calculating the covariance between two stocks is to provide a(n) ____ measure of their movement
together.
a.
absolute
b.
relative
c.
indexed
d.
loglinear
e.
squared
79. In a two-stock portfolio, if the correlation coefficient between two stocks were to decrease over time, everything else
remaining constant, the portfolio’s risk would
a.
decrease.
b.
remain constant.
c.
increase.
d.
fluctuate positively and negatively.
e.
be a negative value.
80. All of the following are common risk measurements EXCEPT
a.
standard deviation.
b.
variance.
c.
semivariance.
d.
covariance.
e.
range of returns.