
CHAPTER 12—MACROANALYSIS AND MICROEVALUATION OF THE STOCK
MARKET TRUE/FALSE
Question A main limitation of the NBER indicator series is false signals. Answer:
Question Stock prices move coincidentally with the economy. Answer:
Question The cyclical indicator approach to market analysis is based on the belief that the
economy expands and contracts in a random manner. Answer:
Question Leading indicators of the business cycle include economic series that reach peaks
or troughs before the peaks and troughs of the overall economy. Answer:
Question Coincident indicators include economic time series that have peaks and troughs
that roughly occur at the same time as the peaks and troughs of overall economic activity.
Answer:
Question The economy and the stock market have a strong, consistent relationship, but the
stock market generally turns before the economy does. Answer:

Question Diffusion indexes indicate the spread in interest rates between major economies.
Answer:
Question The economic factor assumed to be closely related to stock prices is productivity.
Answer:
Question The best known monetary variable is the level of taxes. Answer:
Question Recent studies show that money supply changes have an important impact on
stock price movements. Answer:
Question Recent studies indicate that one can earn excess returns in the stock market by
forecasting unanticipated changes in the money supply. Answer:
Question The first step in the Goldman Sachs analysis of world markets examines a
countrys aggregate economy and its components that relate to the valuation of securities.
Answer:
Question The Goldman Sachs analysis recommends an allocation of equity investments

among countries in comparison to the countrys normal weighting based on its relative
market value. Answer:
Question It is important to analyze the economies and security markets before analyzing
alternative industries or companies. Answer:
Question Over the last 20 years, increases in the return on equity for the S&P Index has
been associated with decreases in return of assets. Answer:
Question It is more important to estimate future earnings than the future earnings
multiplier. Answer:
Question An analysis of U.S. equity markets using the cash flow techniques concludes that
the market is not fully valued. Answer:
Question There is a negative relationship between the capacity utilization rate and the
profit margin. Answer:
Question Estimating net profit margin directly is difficult because it is so volatile. Answer:

Question An increase in the required rate of return k will increase the P/E ratio. Answer:
Question Future tax rates are difficult to estimate because they are politically influenced.
Answer:
Question As the markets return on equity increases so will the P/E ratio. Answer:
Question It is reasonable to expect corporate sales to be closely related to GNP. Answer:
Question Dividend growth is positively related to the return on equity. Answer:
Question Changes in the dividend payout ratio are positively related to changes in the
retention rate. Answer:
Question In well developed economies, markets are not affected by changes in expected
inflation. Answer:

Question The valuation techniques presented in the chapter can only be applied to the
stock market in the United States, since the U.S. stock market is inefficient. Answer:
Question One of the economic series included in the National Bureau of Economic
Research (NBER) Coincident Index is the index of industrial production. Answer:
Question A major advantage of the cyclical indicator approach is that it spans all important
major economic sectors including the service sector and import-exports. Answer:
Question The University of Michigan Consumer Sentiment Index is an example of a
leading indicator. Answer:
Question When estimating a major stock market value using the earnings multiplier
approach near-term estimates of the required rate of return and growth rate are essential
due to the impact of near-term events on cash flows. Answer:
Question The authors of the text prefer forward valuation ratios as opposed to historical
valuation variables in relative valuation methods. Answer:
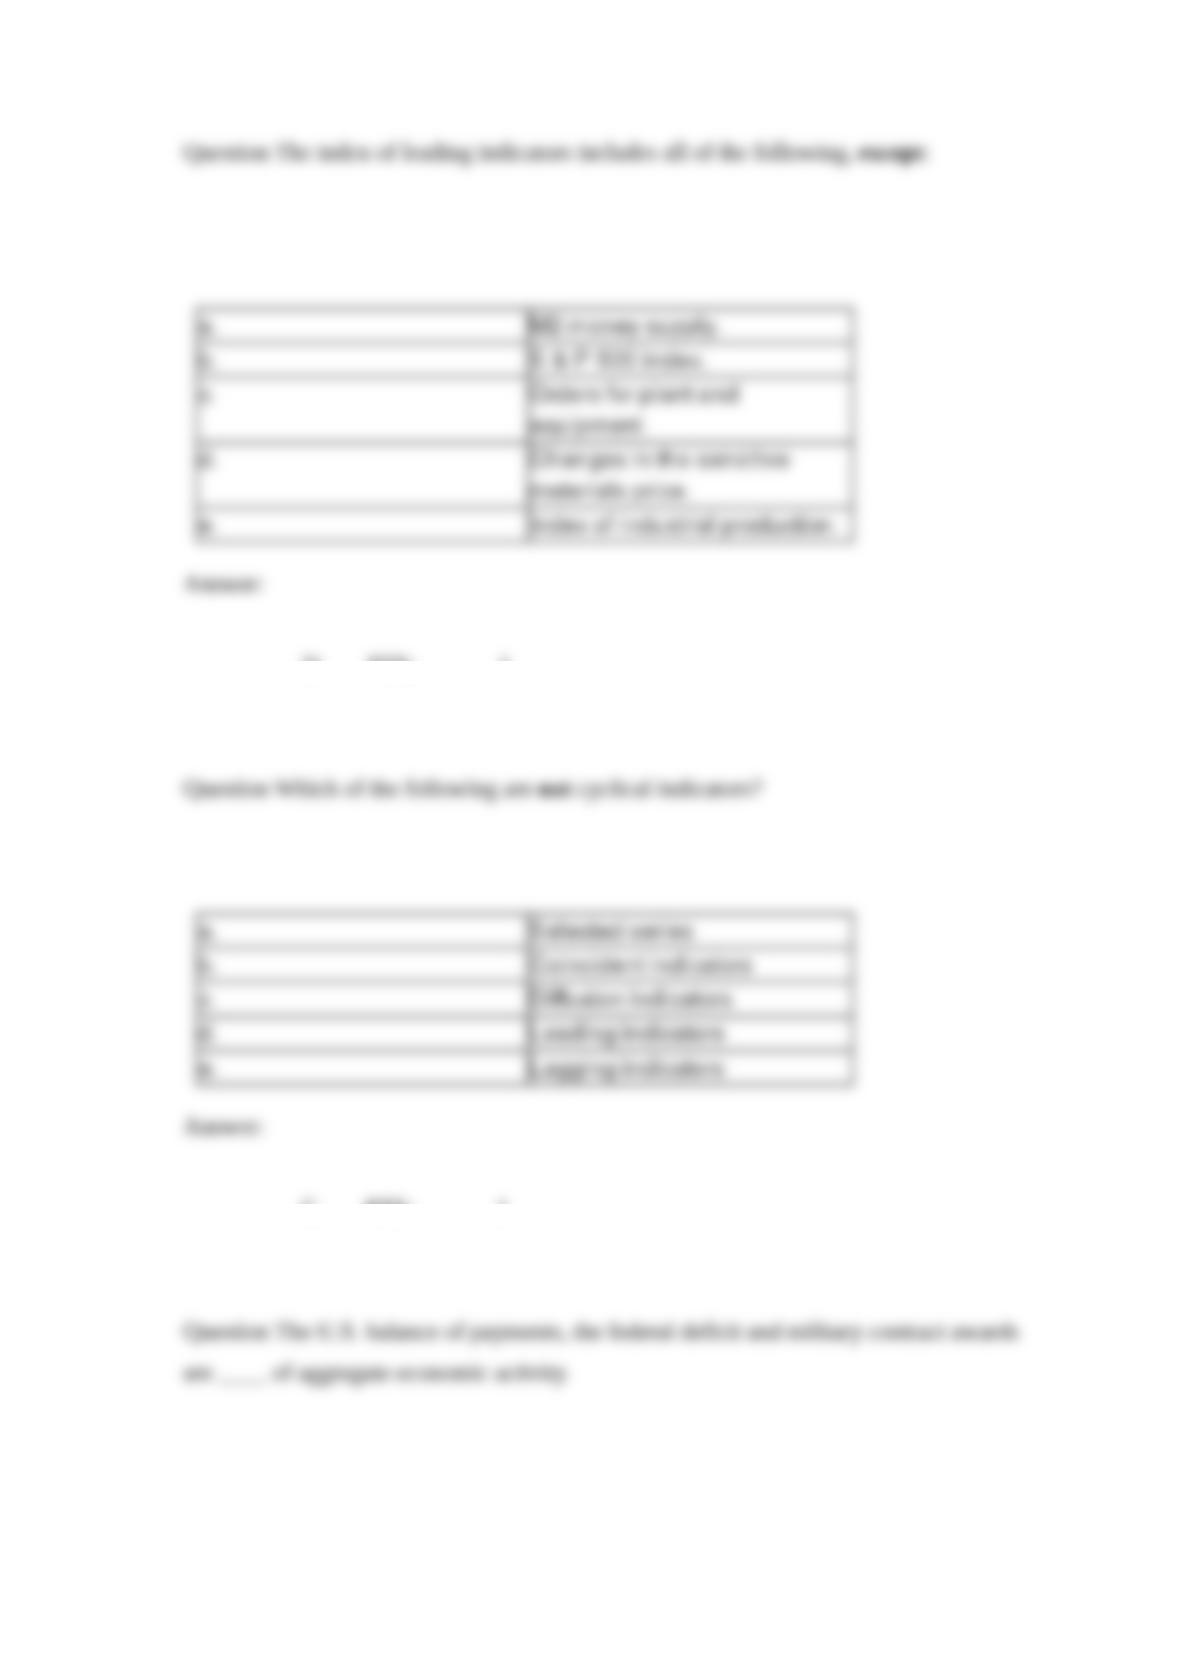
Question The index of leading indicators includes all of the following, except:
Answer:
Question Which of the following are not cyclical indicators?
Answer:
Question The U.S. balance of payments, the federal deficit and military contract awards
are ____ of aggregate economic activity.

Answer:
Question Which of the following series does not include the long-leading index?
Answer:
Question Which of the following variables was considered not significant in explaining
stock returns?
Answer:
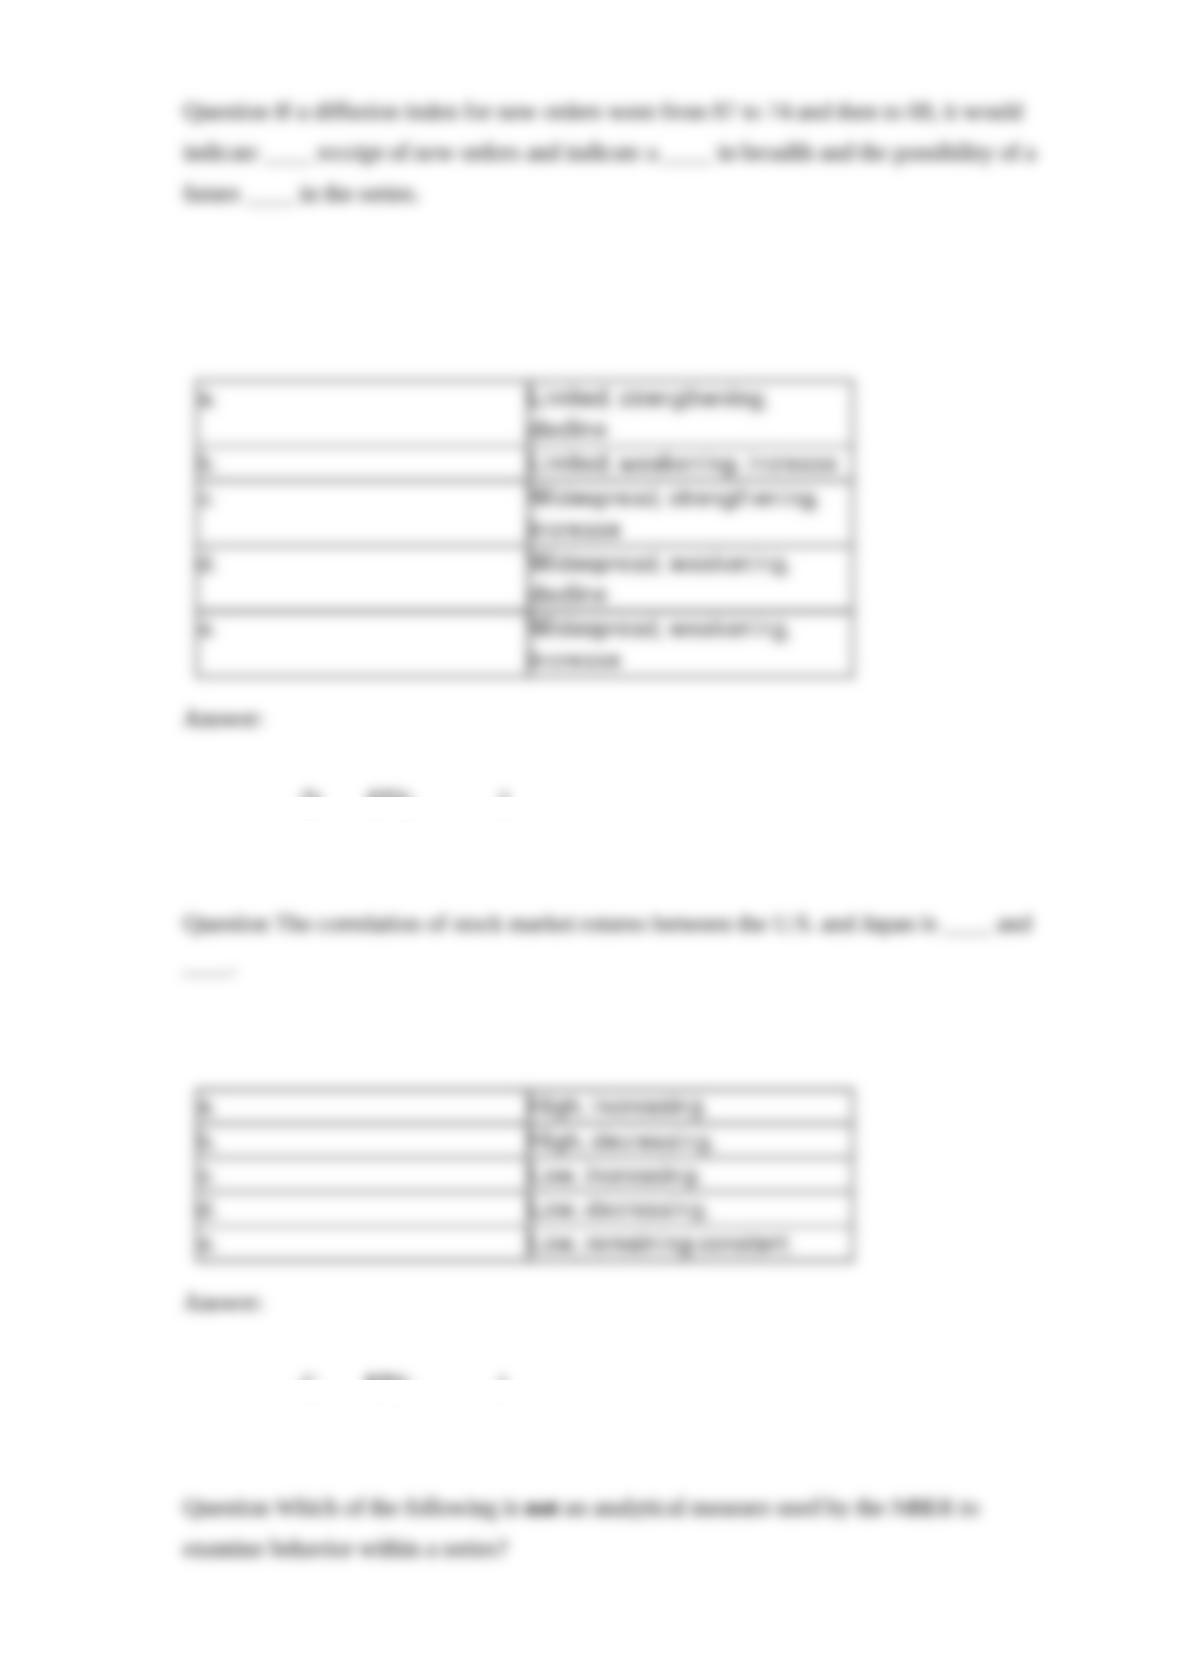
Question If a diffusion index for new orders went from 87 to 74 and then to 68, it would
indicate ____ receipt of new orders and indicate a ____ in breadth and the possibility of a
future ____ in the series.
Answer:
Question The correlation of stock market returns between the U.S. and Japan is ____ and
____.
Answer:
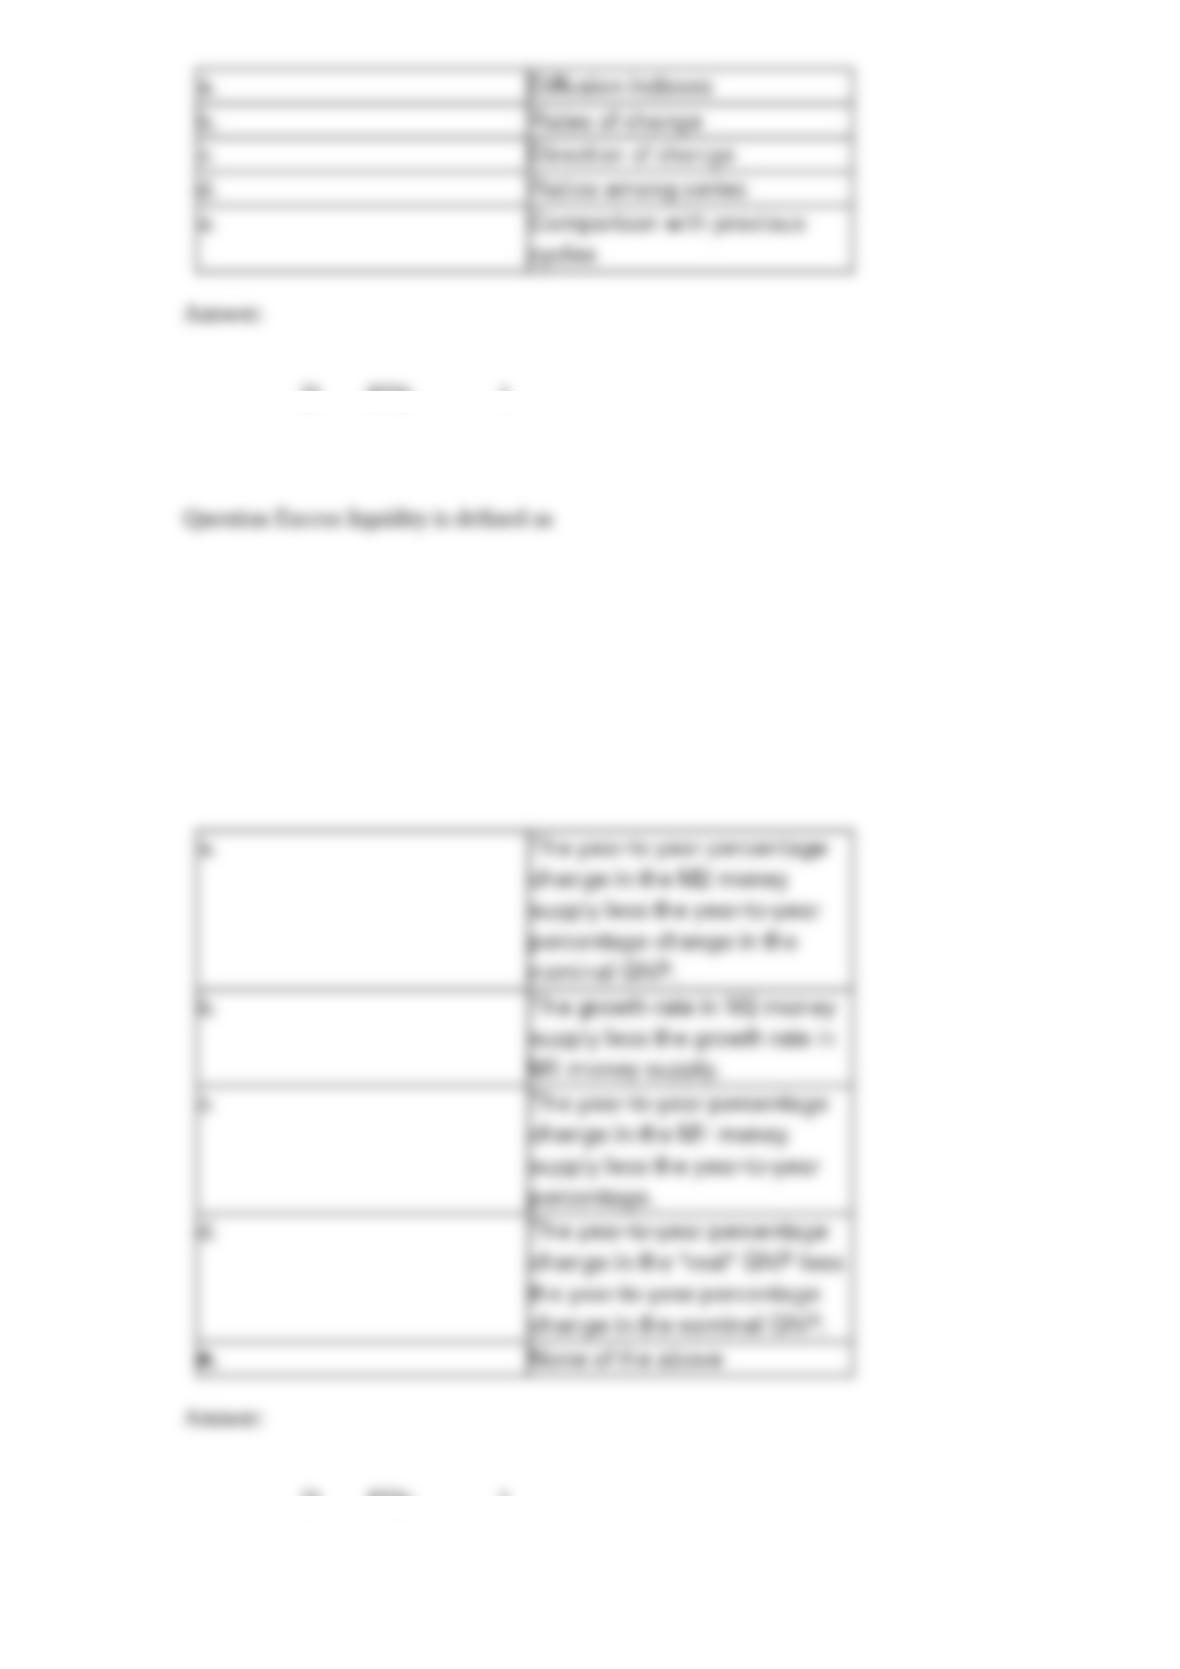
Question Which of the following is not an analytical measure used by the NBER to
examine behavior within a series?
Answer:
Question Excess liquidity is defined as
Answer:
Question Which of the following is not normally associated with cyclical indicators?
Answer:
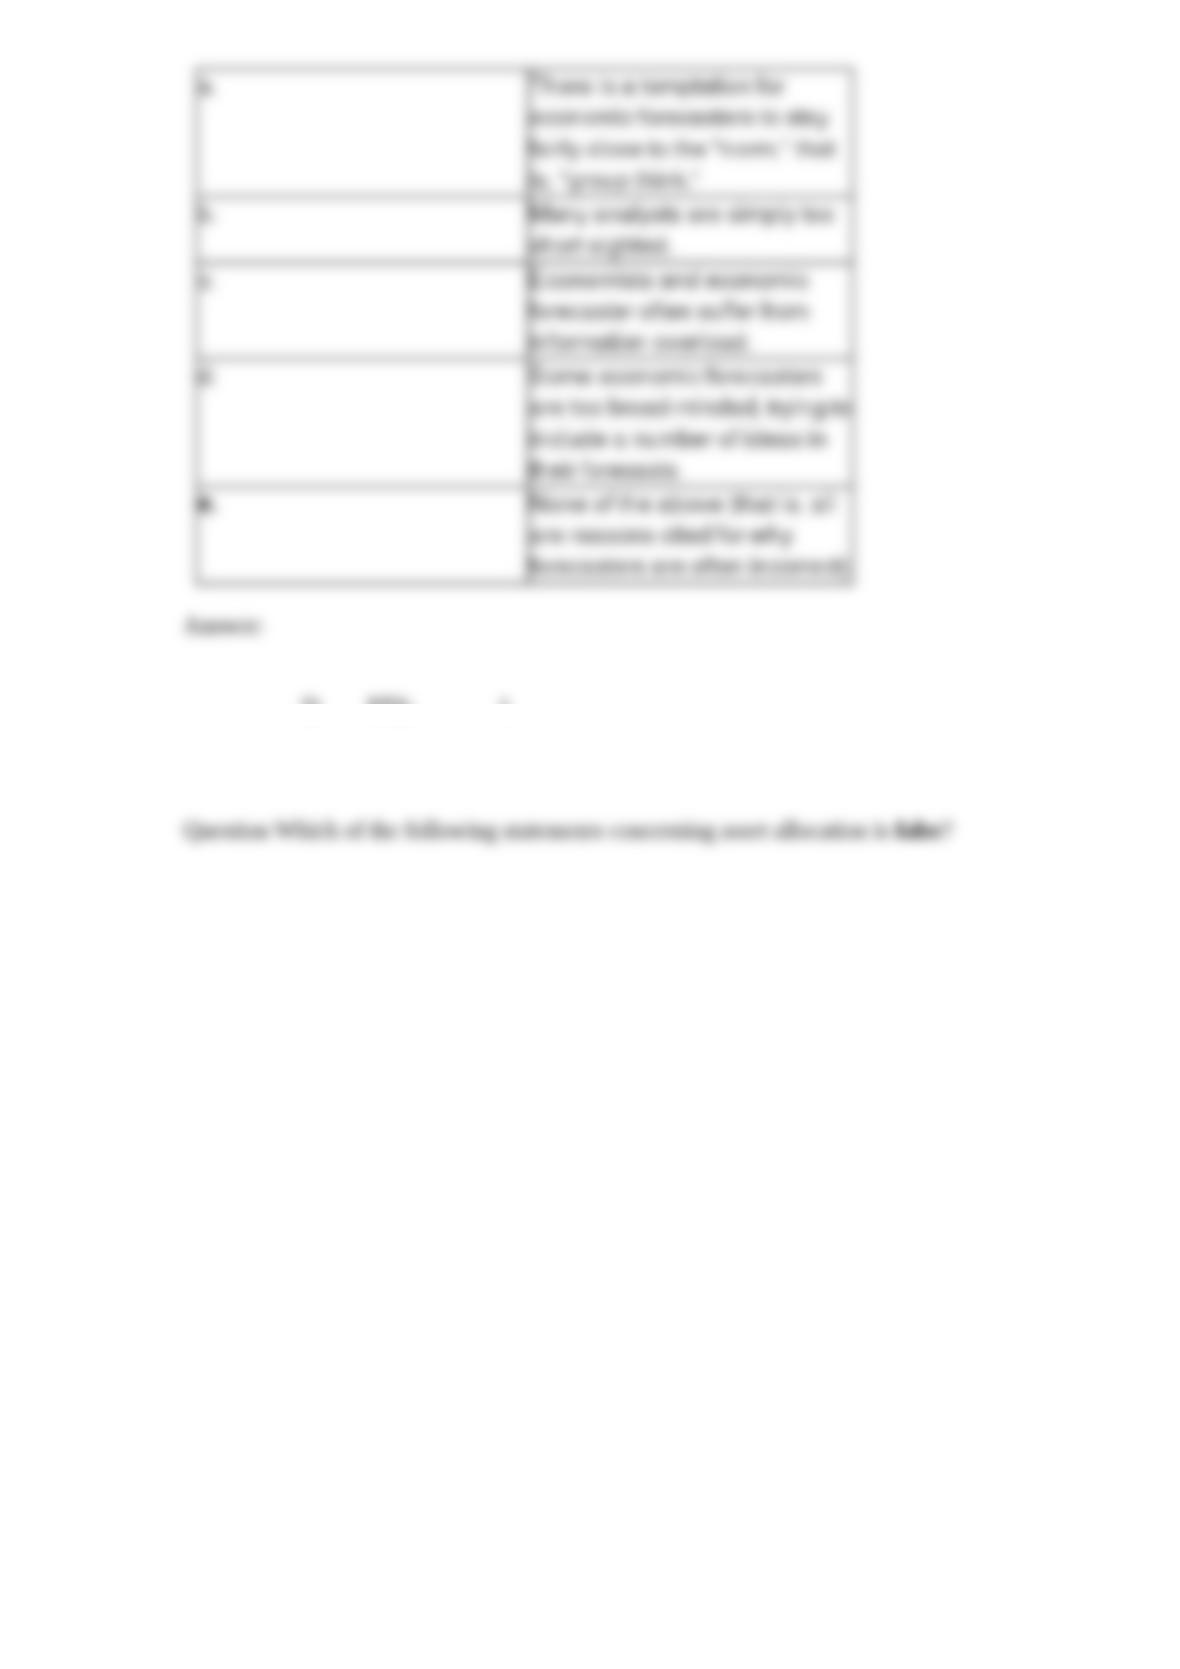
Question Which of the following is not a reason given for why forecaster are so often
incorrect?
Answer:
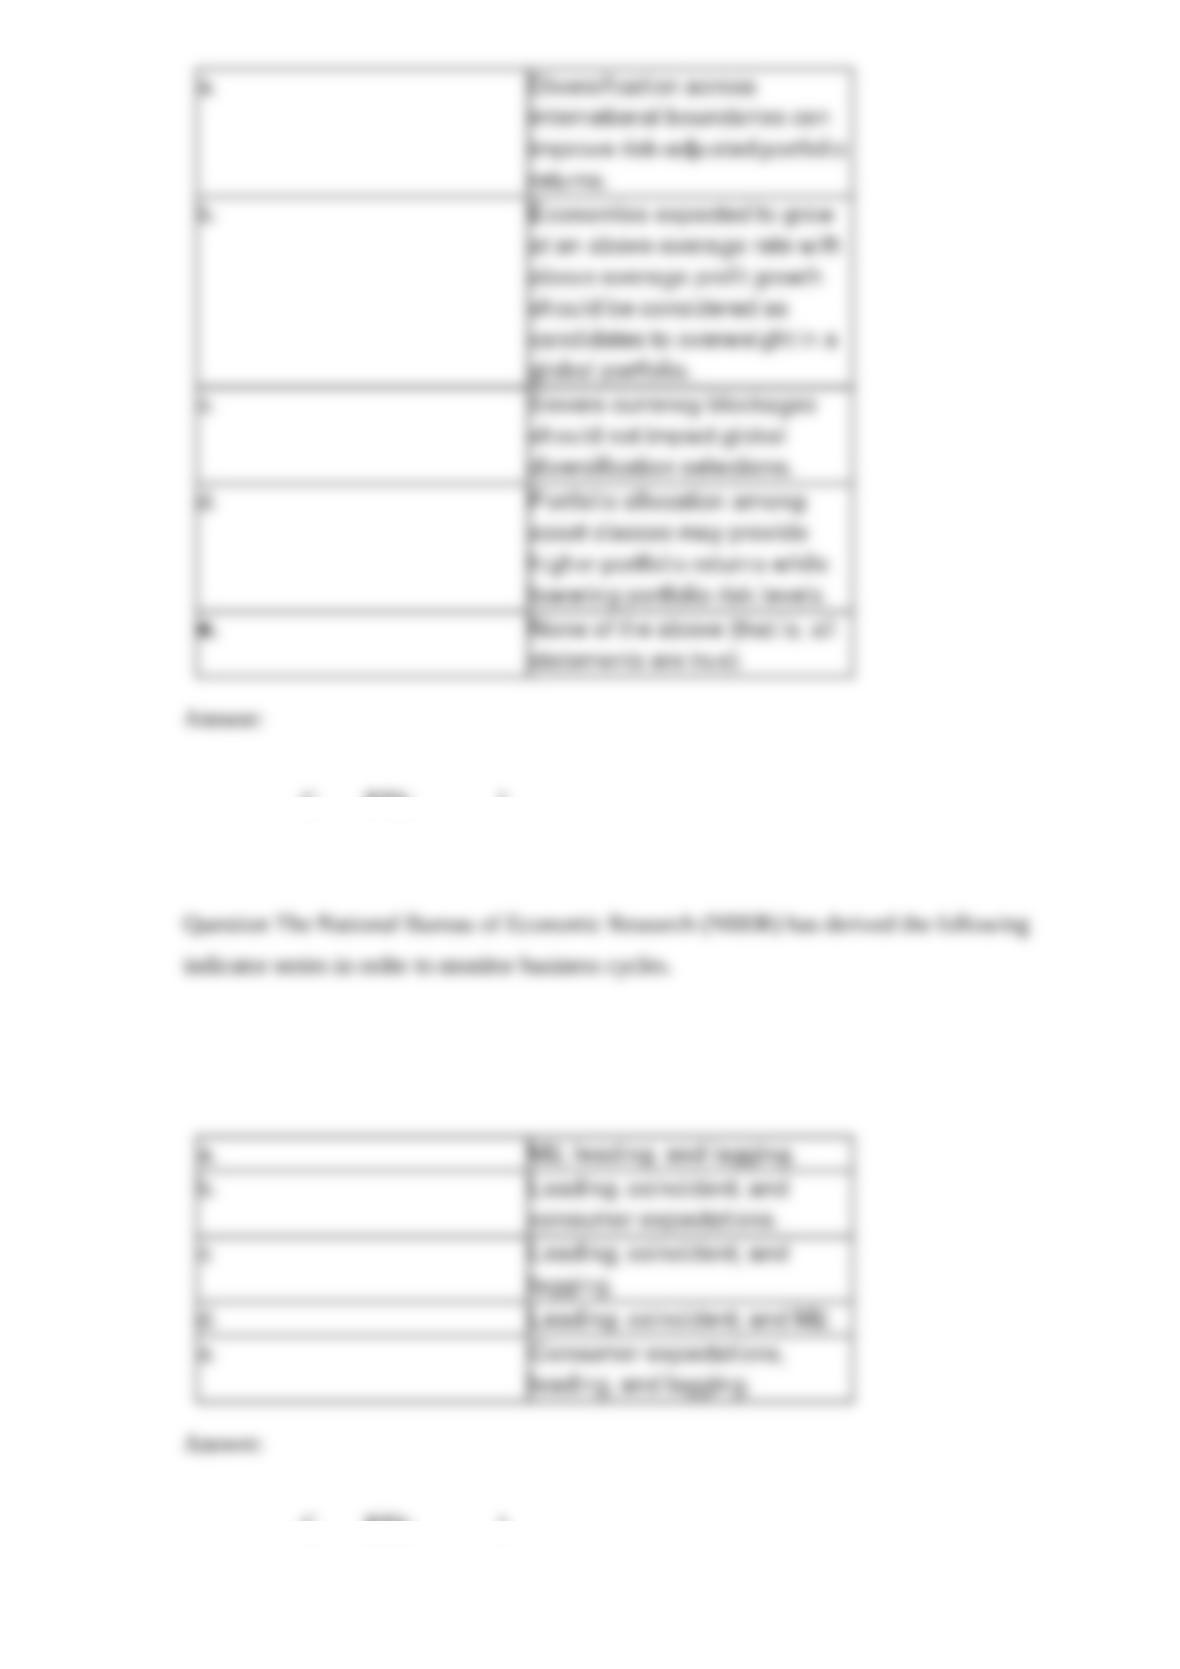
Question Which of the following statements concerning asset allocation is false?
Answer:
Question The National Bureau of Economic Research (NBER) has derived the following
indicator series in order to monitor business cycles.
Answer:
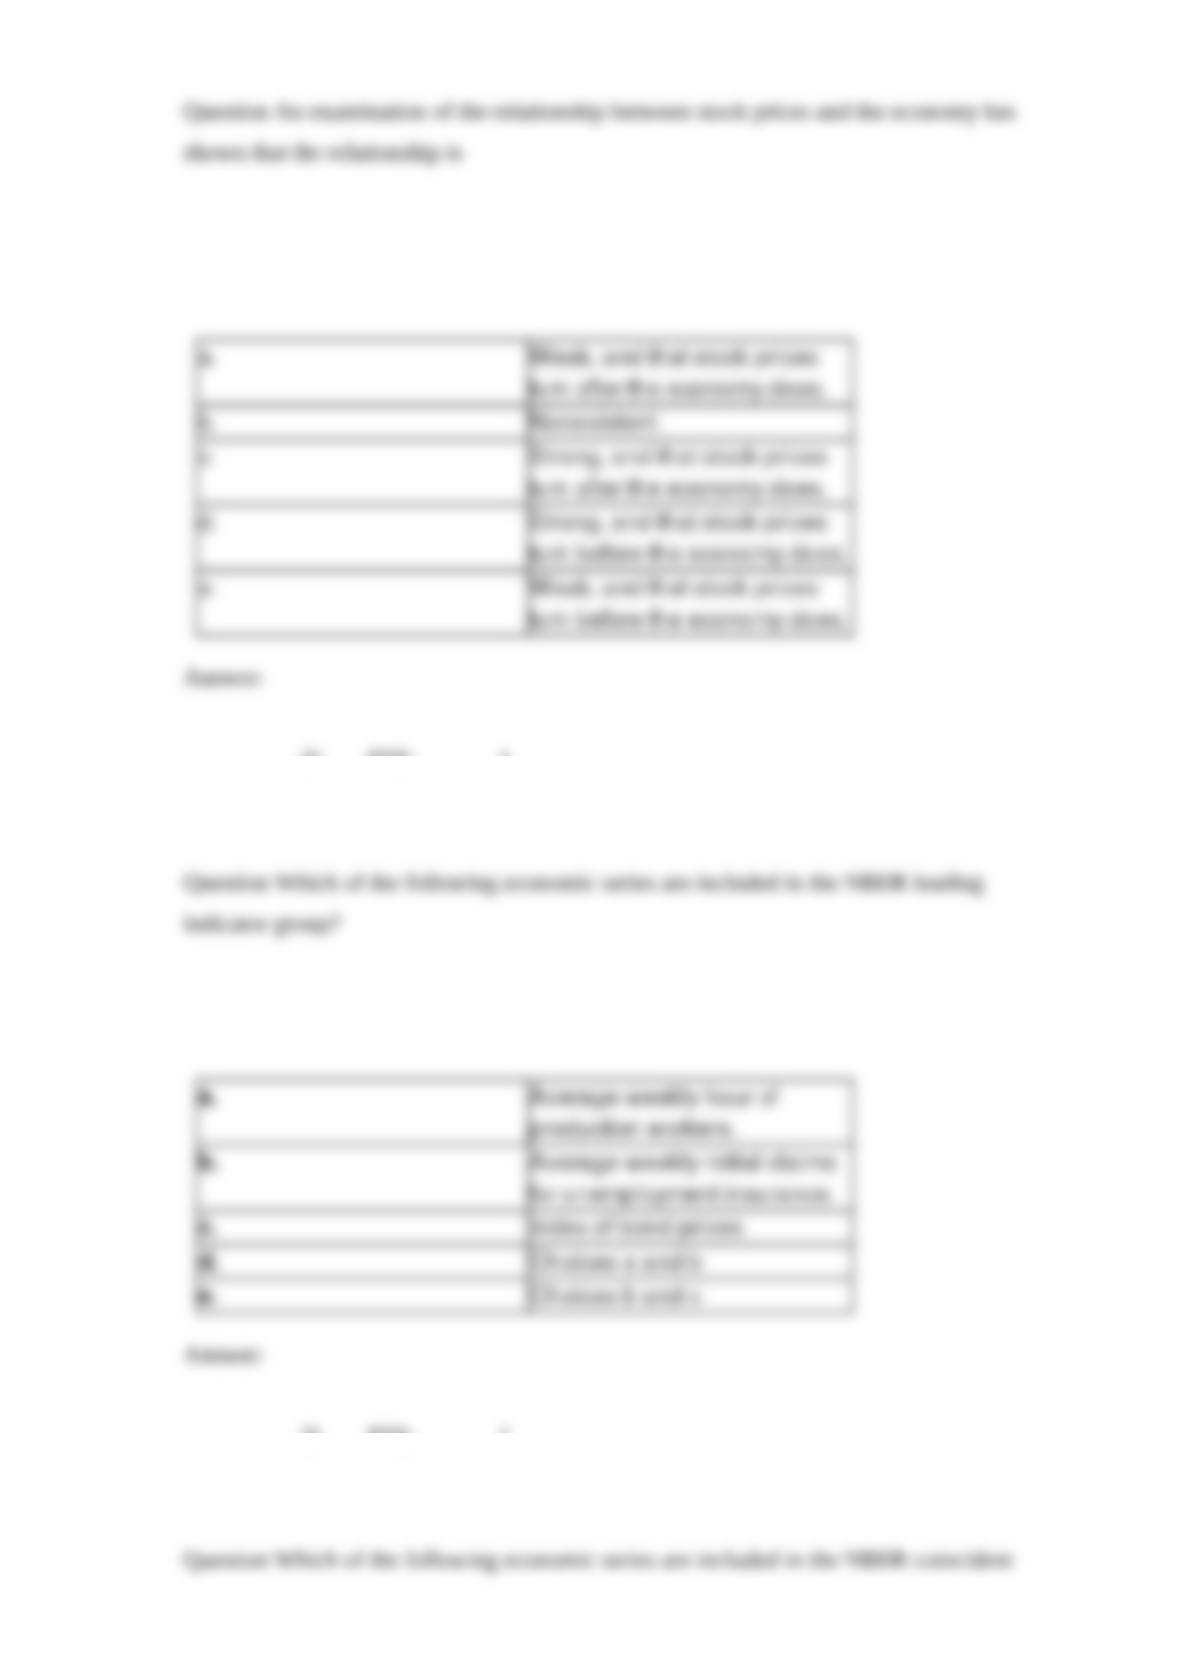
Question An examination of the relationship between stock prices and the economy has
shown that the relationship is
Answer:
Question Which of the following economic series are included in the NBER leading
indicator group?
Answer:
Question Which of the following economic series are included in the NBER coincident
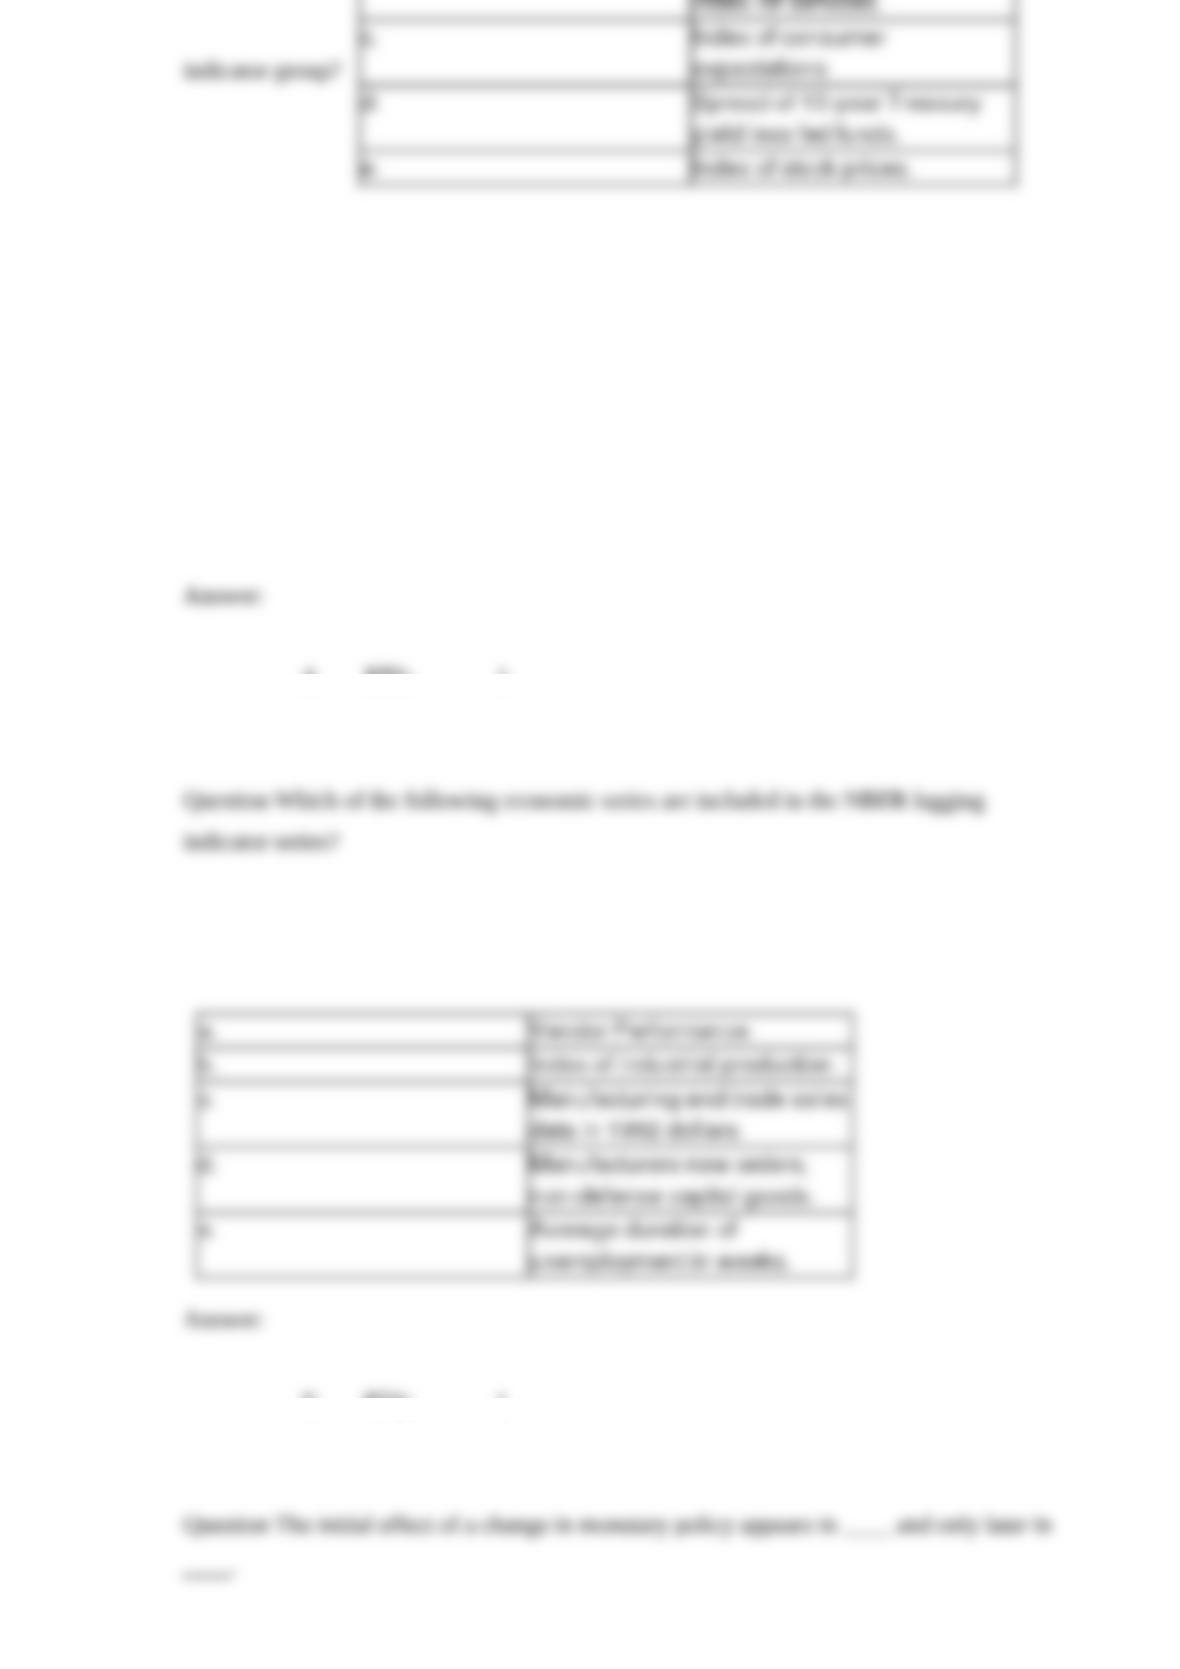
indicator group?
Answer:
Question Which of the following economic series are included in the NBER lagging
indicator series?
Answer:
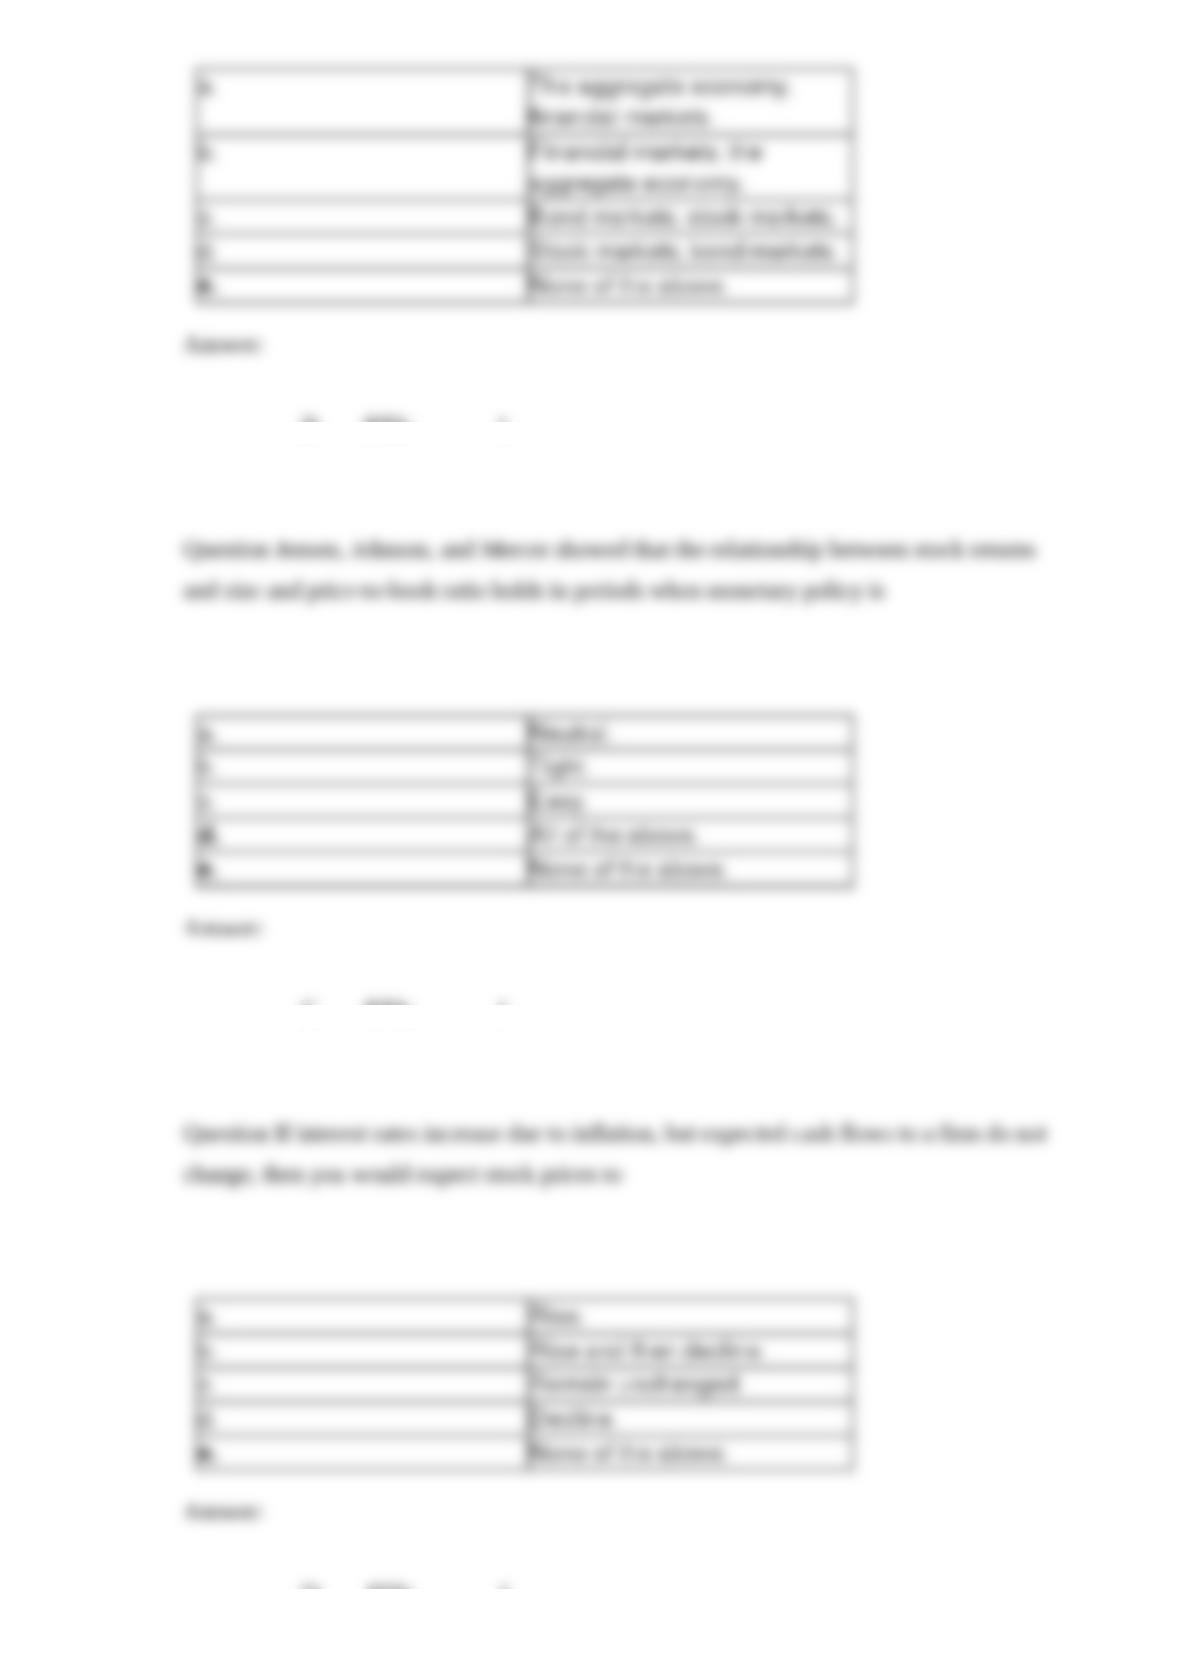
Question The initial effect of a change in monetary policy appears in ____ and only later in
____.
Answer:
Question Jensen, Johnson, and Mercer showed that the relationship between stock returns
and size and price-to-book ratio holds in periods when monetary policy is
Answer:
Question If interest rates increase due to inflation, but expected cash flows to a firm do not
change, then you would expect stock prices to
Answer:

Question If interest rates rise due to inflation, and expected cash flows to a firm rise, then
you would expect stock prices to
Answer:
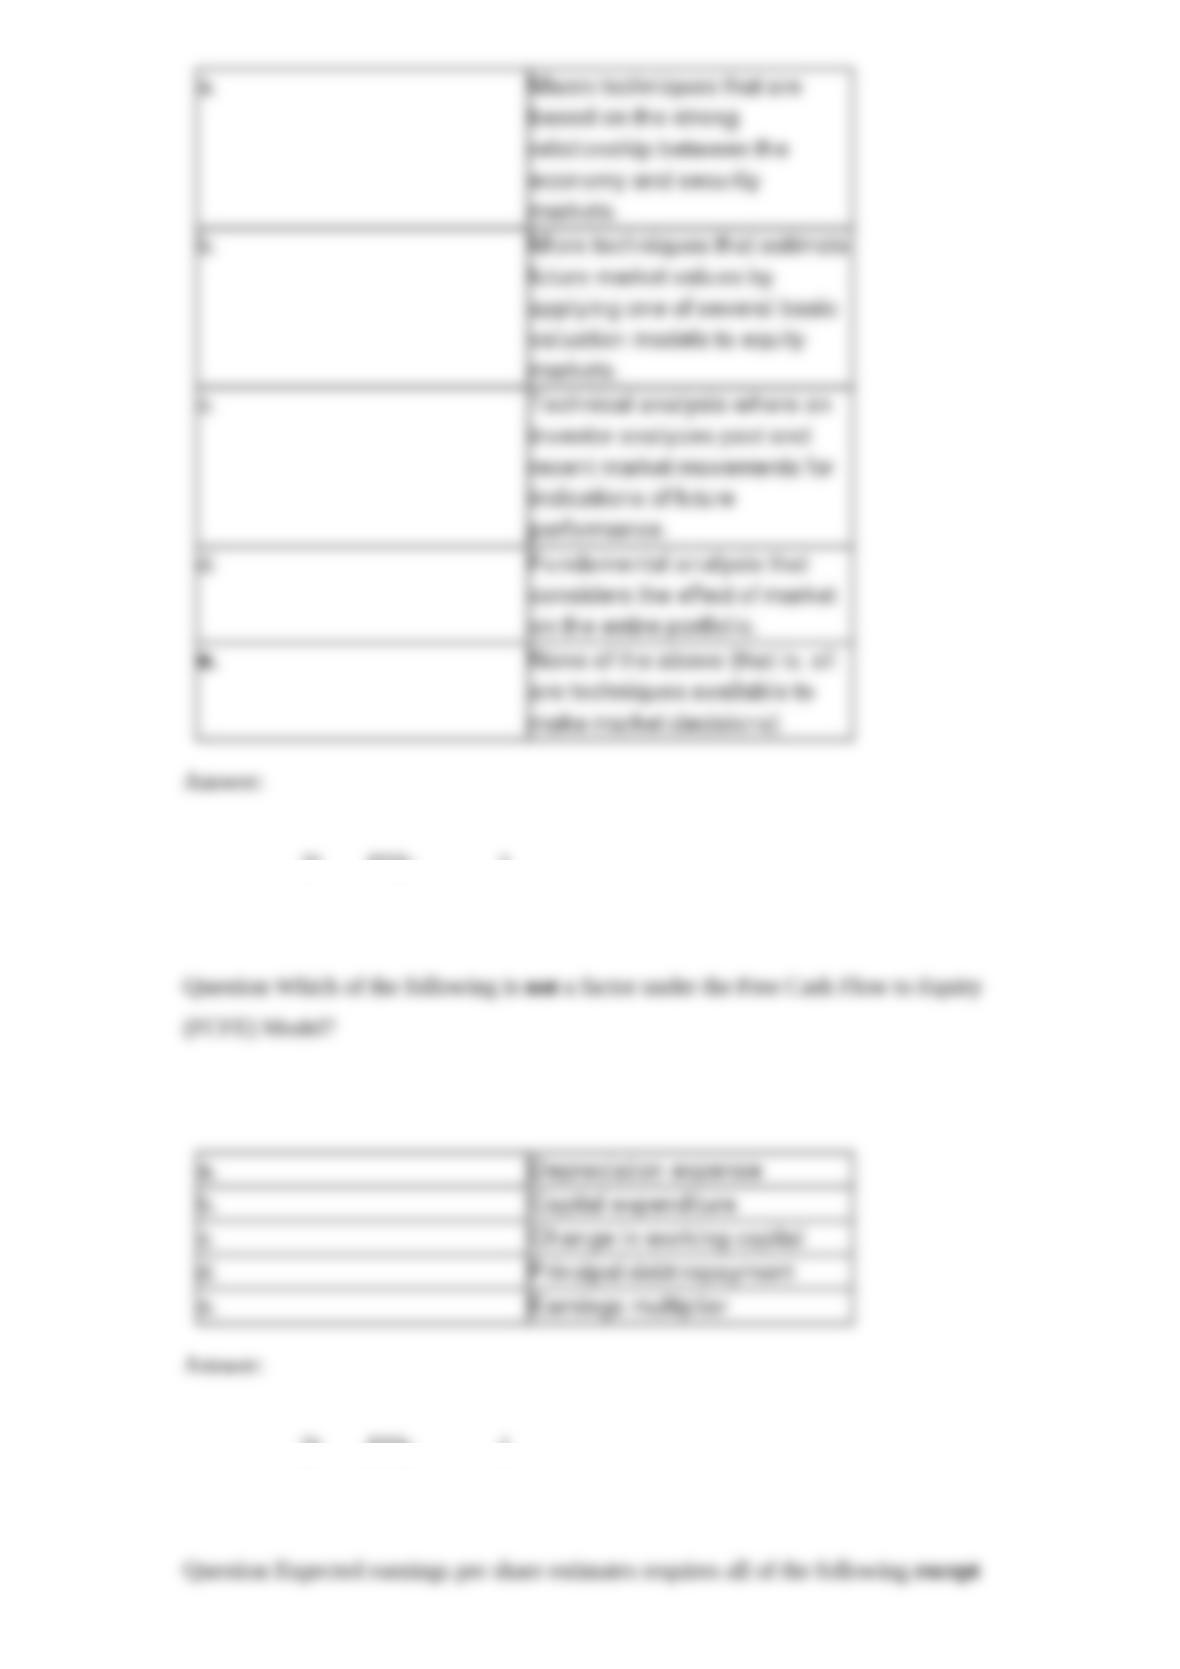
Question There are three techniques available to help an investor make a market decision.
Which of the following is not such an analysis technique?
Answer:
Question Which of the following is not a factor under the Free Cash Flow to Equity
(FCFE) Model?
Answer:
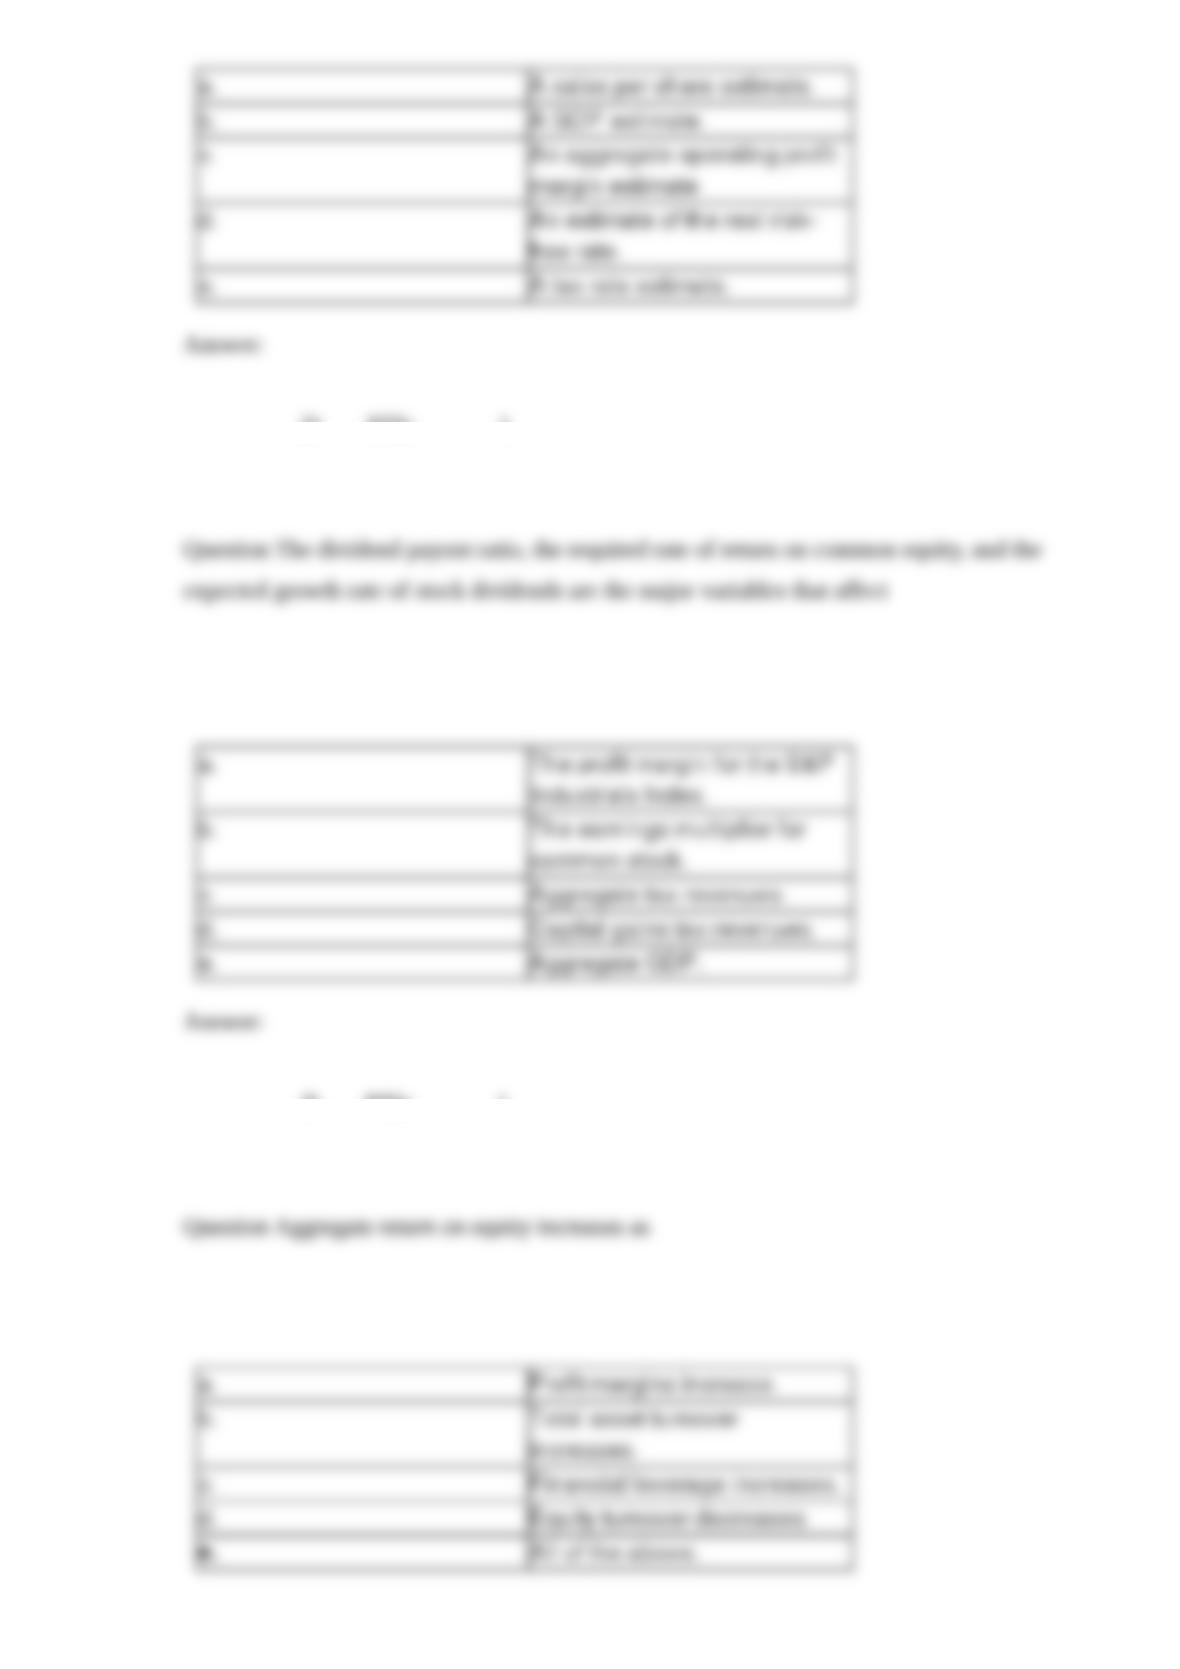
Question Expected earnings per share estimates requires all of the following except
Answer:
Question The dividend payout ratio, the required rate of return on common equity, and the
expected growth rate of stock dividends are the major variables that affect
Answer:
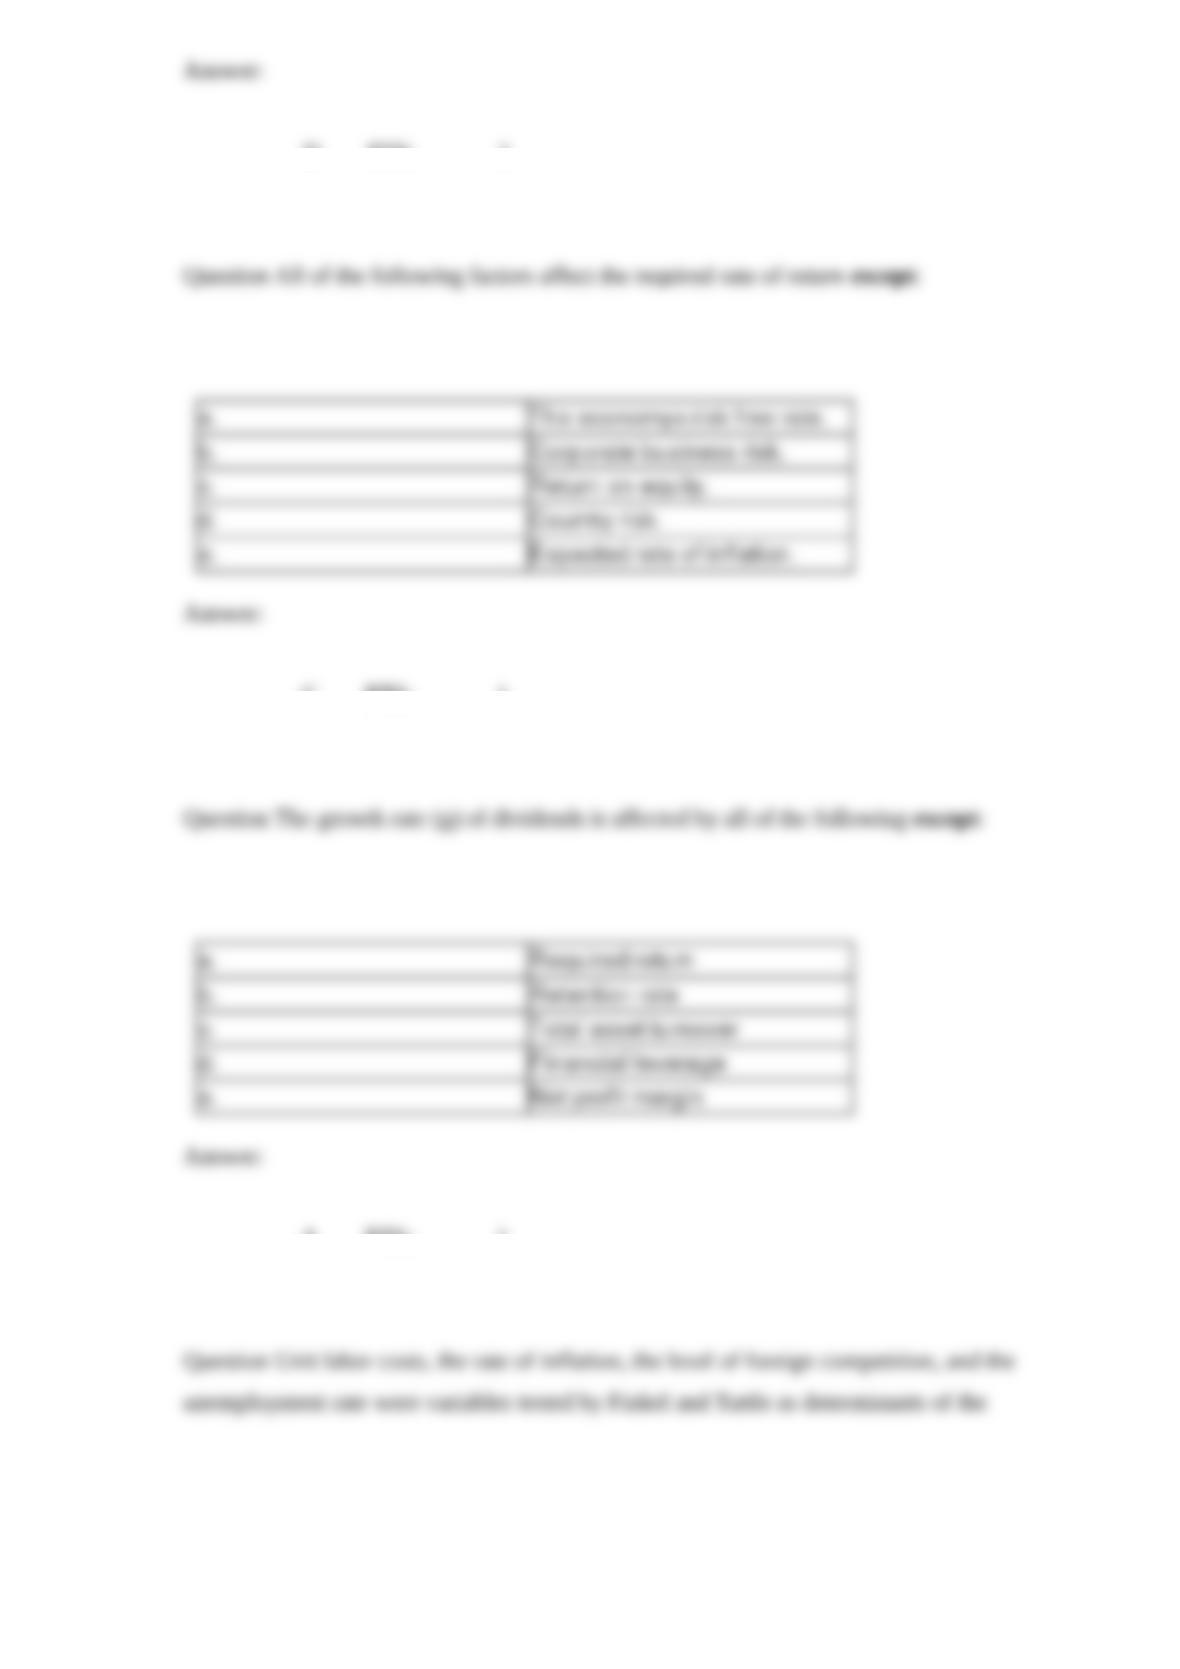
Question Aggregate return on equity increases as
Answer:
Question All of the following factors affect the required rate of return except:
Answer:
Question The growth rate (g) of dividends is affected by all of the following except:
Answer:
Question Unit labor costs, the rate of inflation, the level of foreign competition, and the
unemployment rate were variables tested by Finkel and Tuttle as determinants of the

Answer:
Question Which of the following is not a determinant of the aggregate gross profit margin?
Answer:
Question A microeconomic estimate of the market earnings multiple requires an estimate
for which of the following variables?
Answer:

Question Which of the following economic series is not included in the National Bureau of
Economic Research (NBER) leading indicator group?
Answer:
Question Which of the following economic series is not included in the National Bureau of
Economic Research (NBER) lagging indicator group?
Answer:
Question The multiplier approach for estimating the intrinsic market value of a major stock
market series requires the following step(s):
Answer:
Question You are attempting to estimate expected earnings per share for a major stock
market series. You have determined an appropriate estimate for sales per share. Which of
the following methods can be used to estimate the profit margin?
Answer:
Question A 1971 study by Finkel and Tuttle hypothesizes that all of the following variables
affect the aggregate profit margin except
Answer:
Question If, for the S&P Industrials Index, the profit margin was 0.35 and the equity
turnover ratio was 10, the ROE would be:
Answer:
Question If, for the S&P Industrials Index, the profit margin was 0.30 and the equity
turnover ratio was 11, the ROE would be:
Answer:
Question If, for the S&P Industrials Index, the profit margin was .25 and the equity
turnover ratio was 12, the ROE would be:
Answer:
Question If, for the S&P Industrials Index, the profit margin was 0.20 and the equity
turnover ratio was 13, the ROE would be:
Answer:
Question The dividend payout ratio for the aggregate market is 55 percent, the required
rate of return is 15 percent, and the expected growth rate for dividends is 7 percent.
Compute the current earnings multiple.
Answer:
Question The dividend payout ratio for the aggregate market is 65 percent, the required
rate of return is 13 percent, and the expected growth rate for dividends is 8 percent.
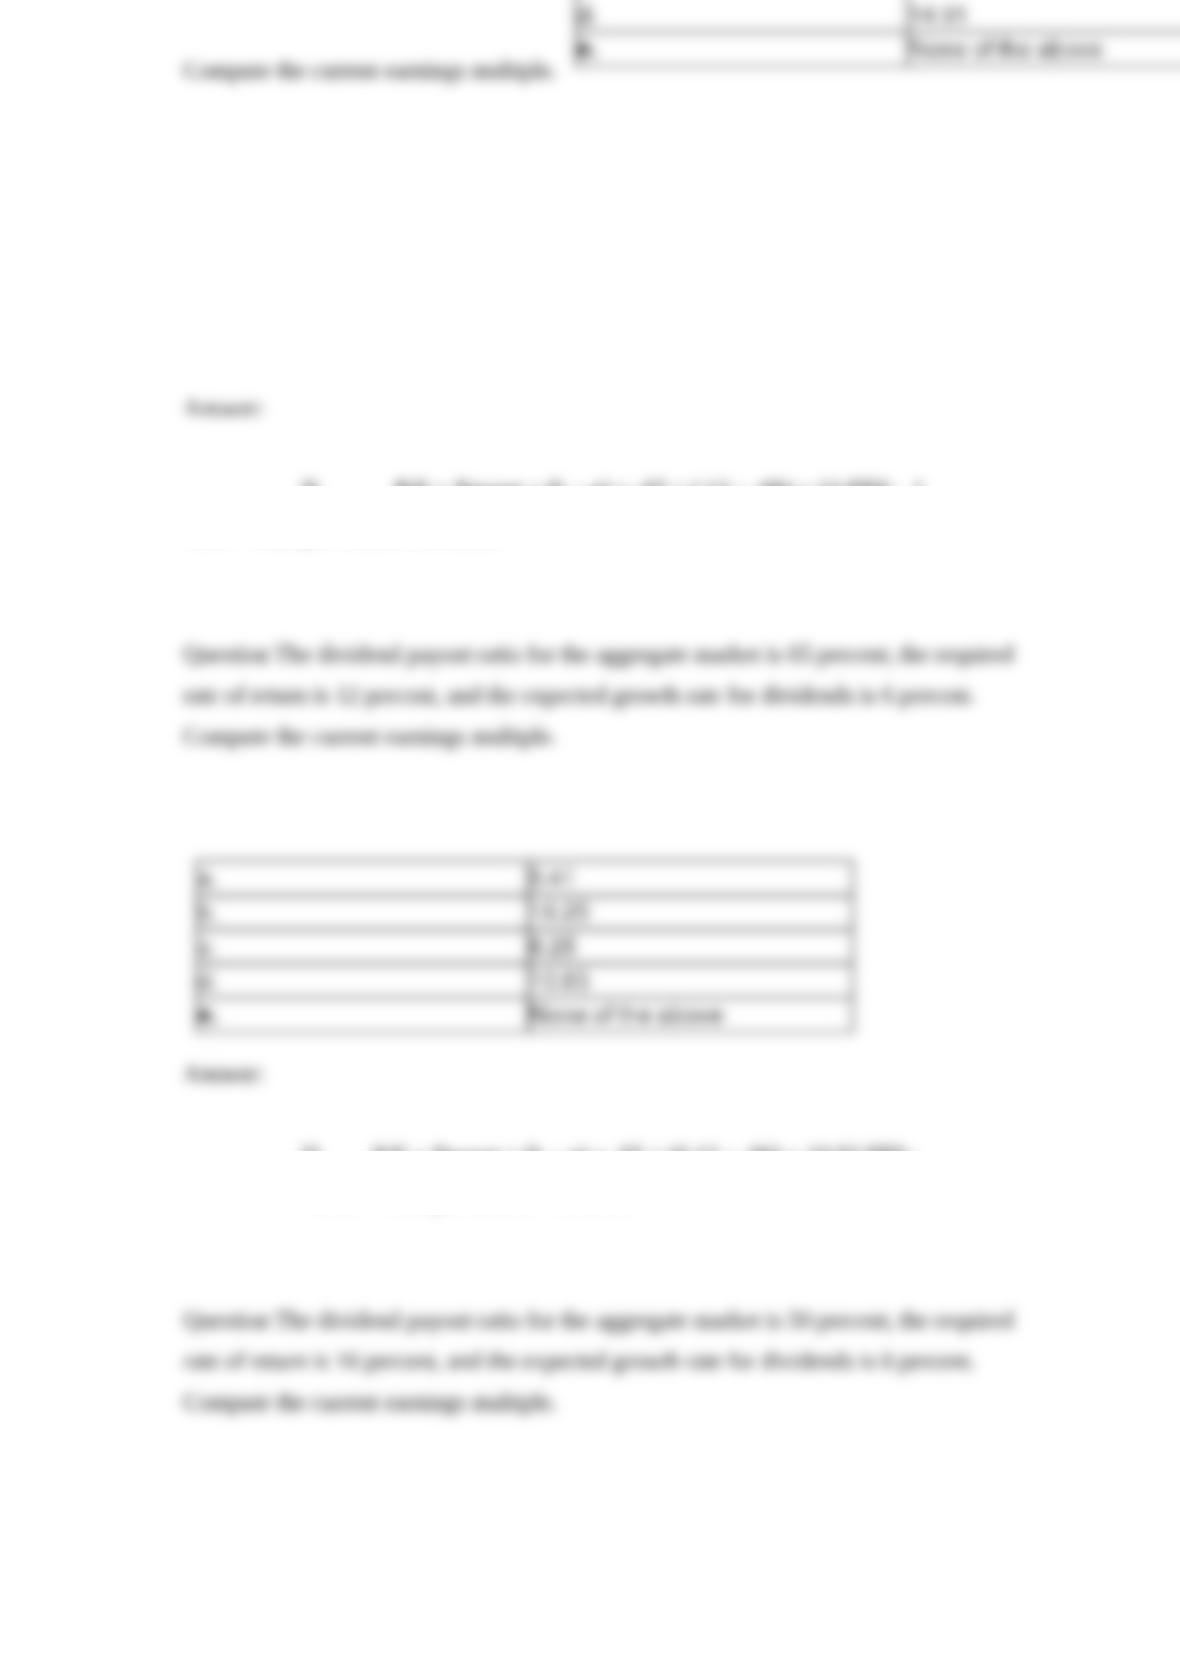
Compute the current earnings multiple.
Answer:
Question The dividend payout ratio for the aggregate market is 65 percent, the required
rate of return is 12 percent, and the expected growth rate for dividends is 6 percent.
Compute the current earnings multiple.
Answer:
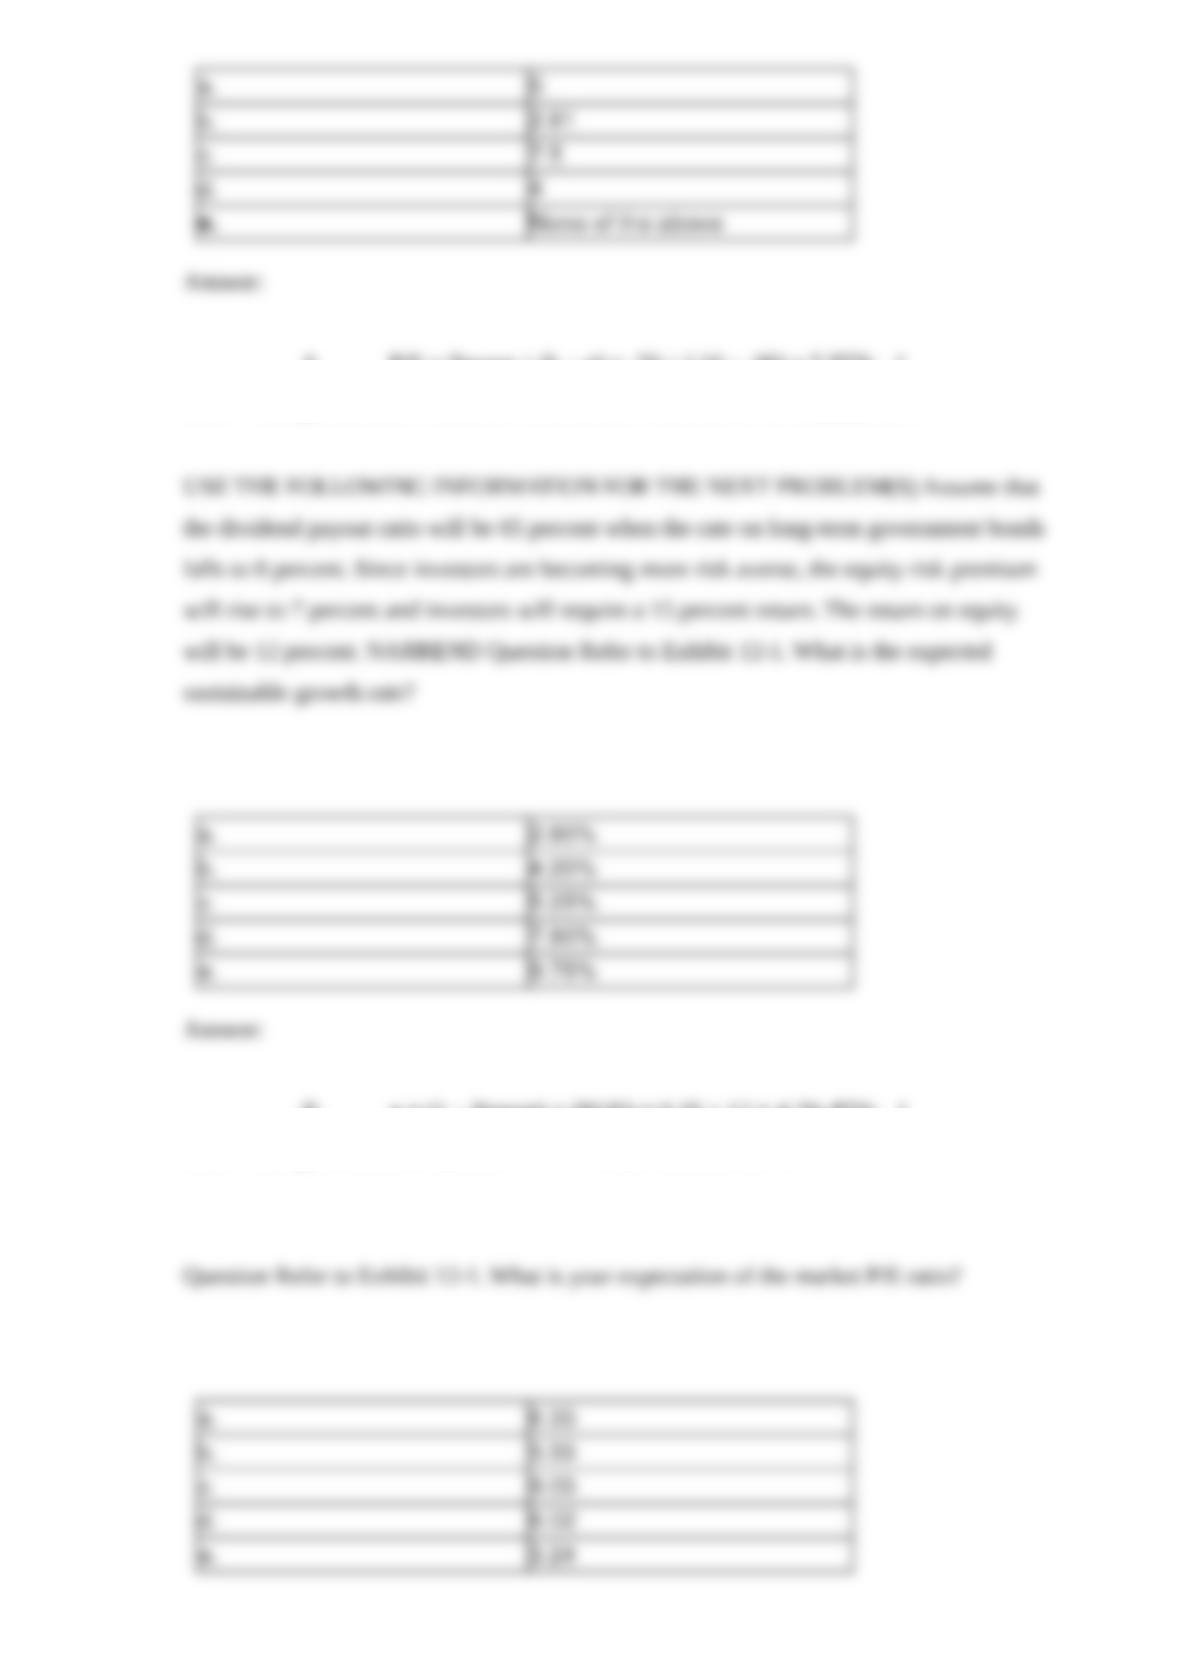
Question The dividend payout ratio for the aggregate market is 50 percent, the required
rate of return is 16 percent, and the expected growth rate for dividends is 6 percent.
Compute the current earnings multiple.
Answer:
USE THE FOLLOWING INFORMATION FOR THE NEXT PROBLEM(S) Assume that
the dividend payout ratio will be 65 percent when the rate on long-term government bonds
falls to 8 percent. Since investors are becoming more risk averse, the equity risk premium
will rise to 7 percent and investors will require a 15 percent return. The return on equity
will be 12 percent. NARREND Question Refer to Exhibit 12-1. What is the expected
sustainable growth rate?
Answer:
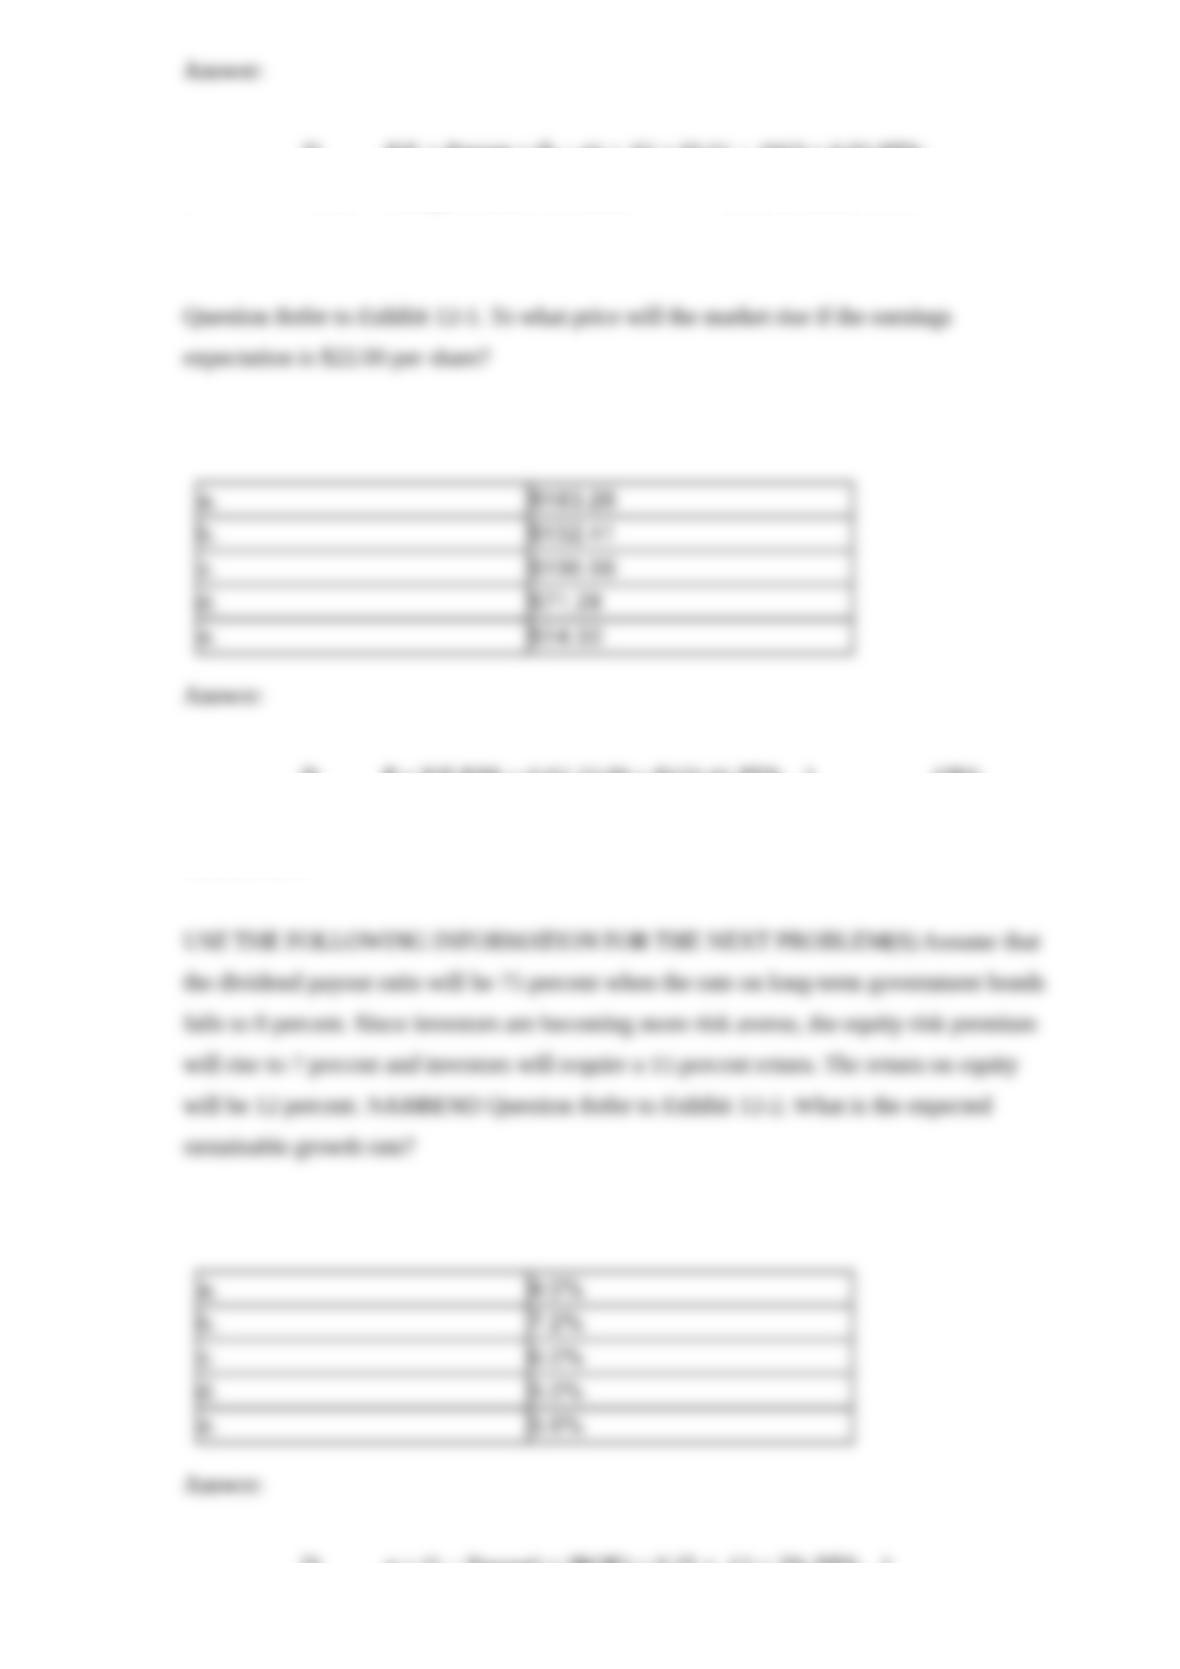
Question Refer to Exhibit 12-1. What is your expectation of the market P/E ratio?
Answer:
Question Refer to Exhibit 12-1. To what price will the market rise if the earnings
expectation is $22.00 per share?
Answer:
USE THE FOLLOWING INFORMATION FOR THE NEXT PROBLEM(S) Assume that
the dividend payout ratio will be 75 percent when the rate on long-term government bonds
falls to 8 percent. Since investors are becoming more risk averse, the equity risk premium
will rise to 7 percent and investors will require a 15 percent return. The return on equity
will be 12 percent. NARREND Question Refer to Exhibit 12-2. What is the expected
sustainable growth rate?
Answer:
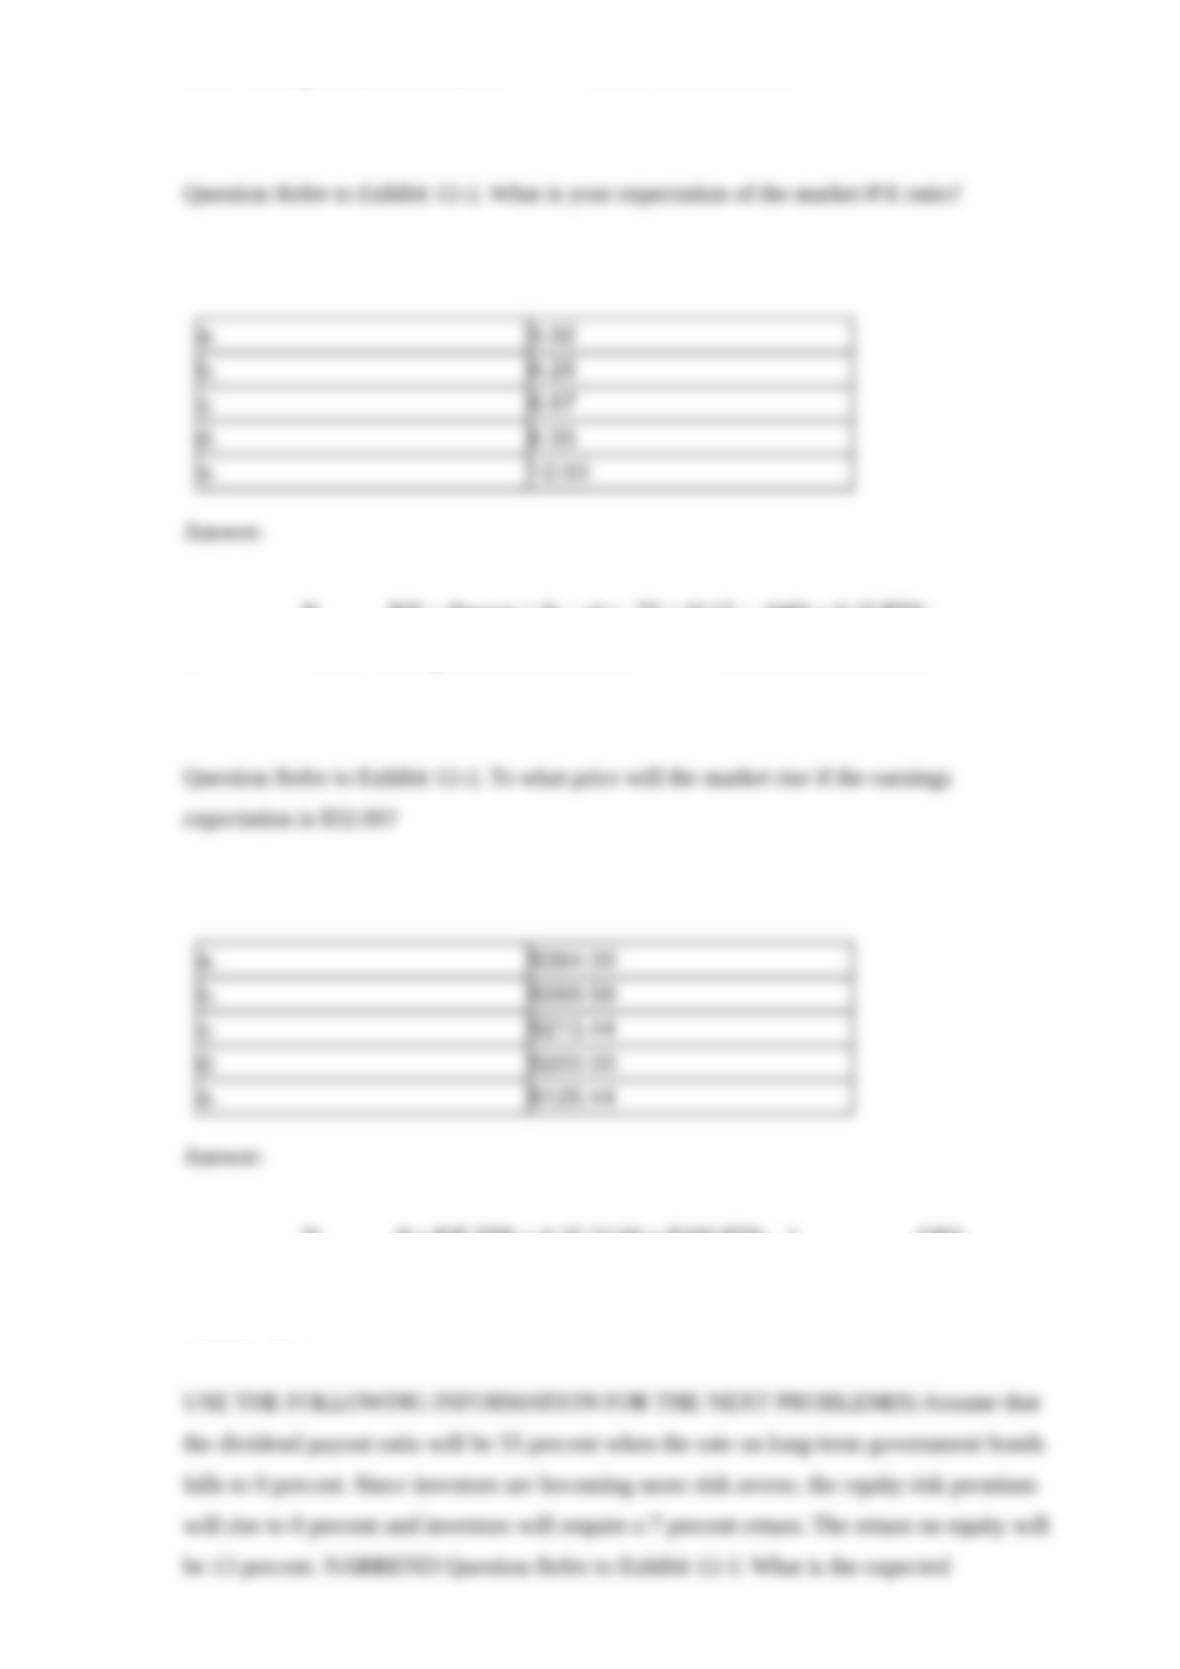
Question Refer to Exhibit 12-2. What is your expectation of the market P/E ratio?
Answer:
Question Refer to Exhibit 12-2. To what price will the market rise if the earnings
expectation is $32.00?
Answer:
USE THE FOLLOWING INFORMATION FOR THE NEXT PROBLEM(S) Assume that
the dividend payout ratio will be 55 percent when the rate on long-term government bonds
falls to 9 percent. Since investors are becoming more risk averse, the equity risk premium
will rise to 8 percent and investors will require a 7 percent return. The return on equity will
be 13 percent. NARREND Question Refer to Exhibit 12-3. What is the expected
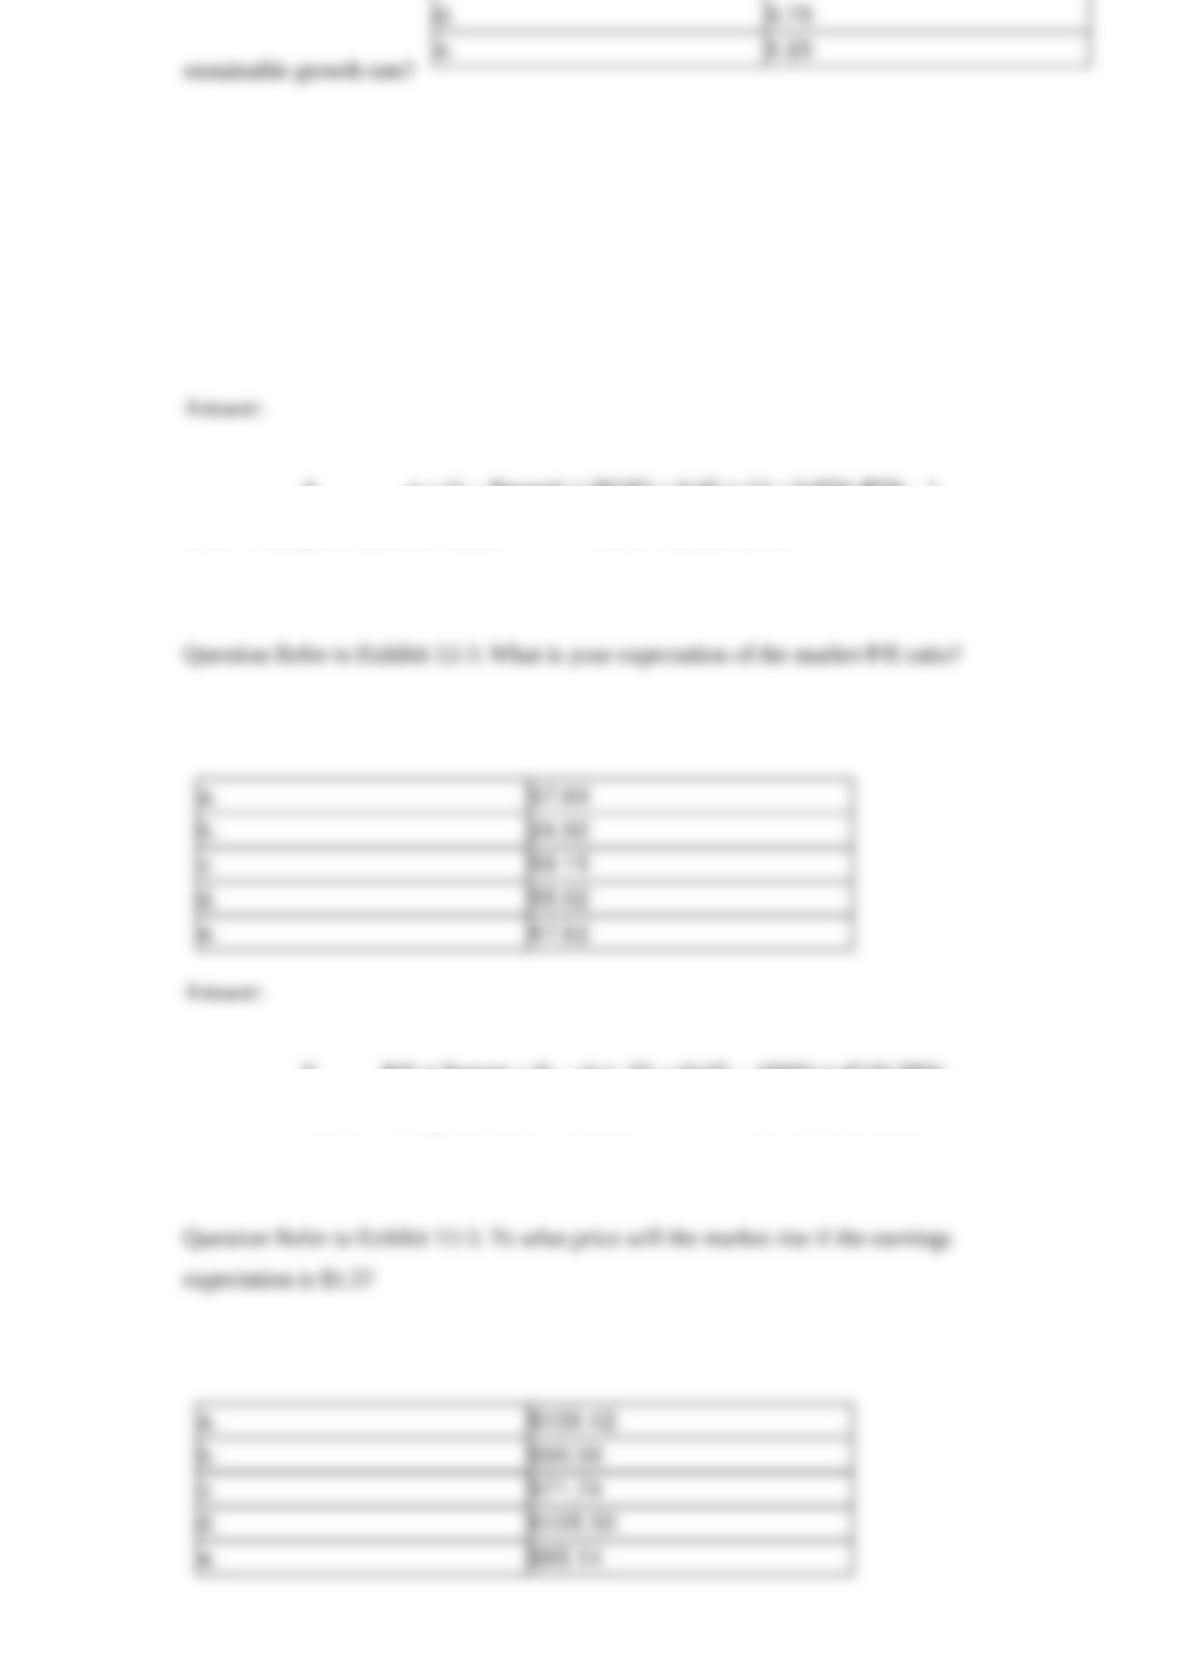
sustainable growth rate?
Answer:
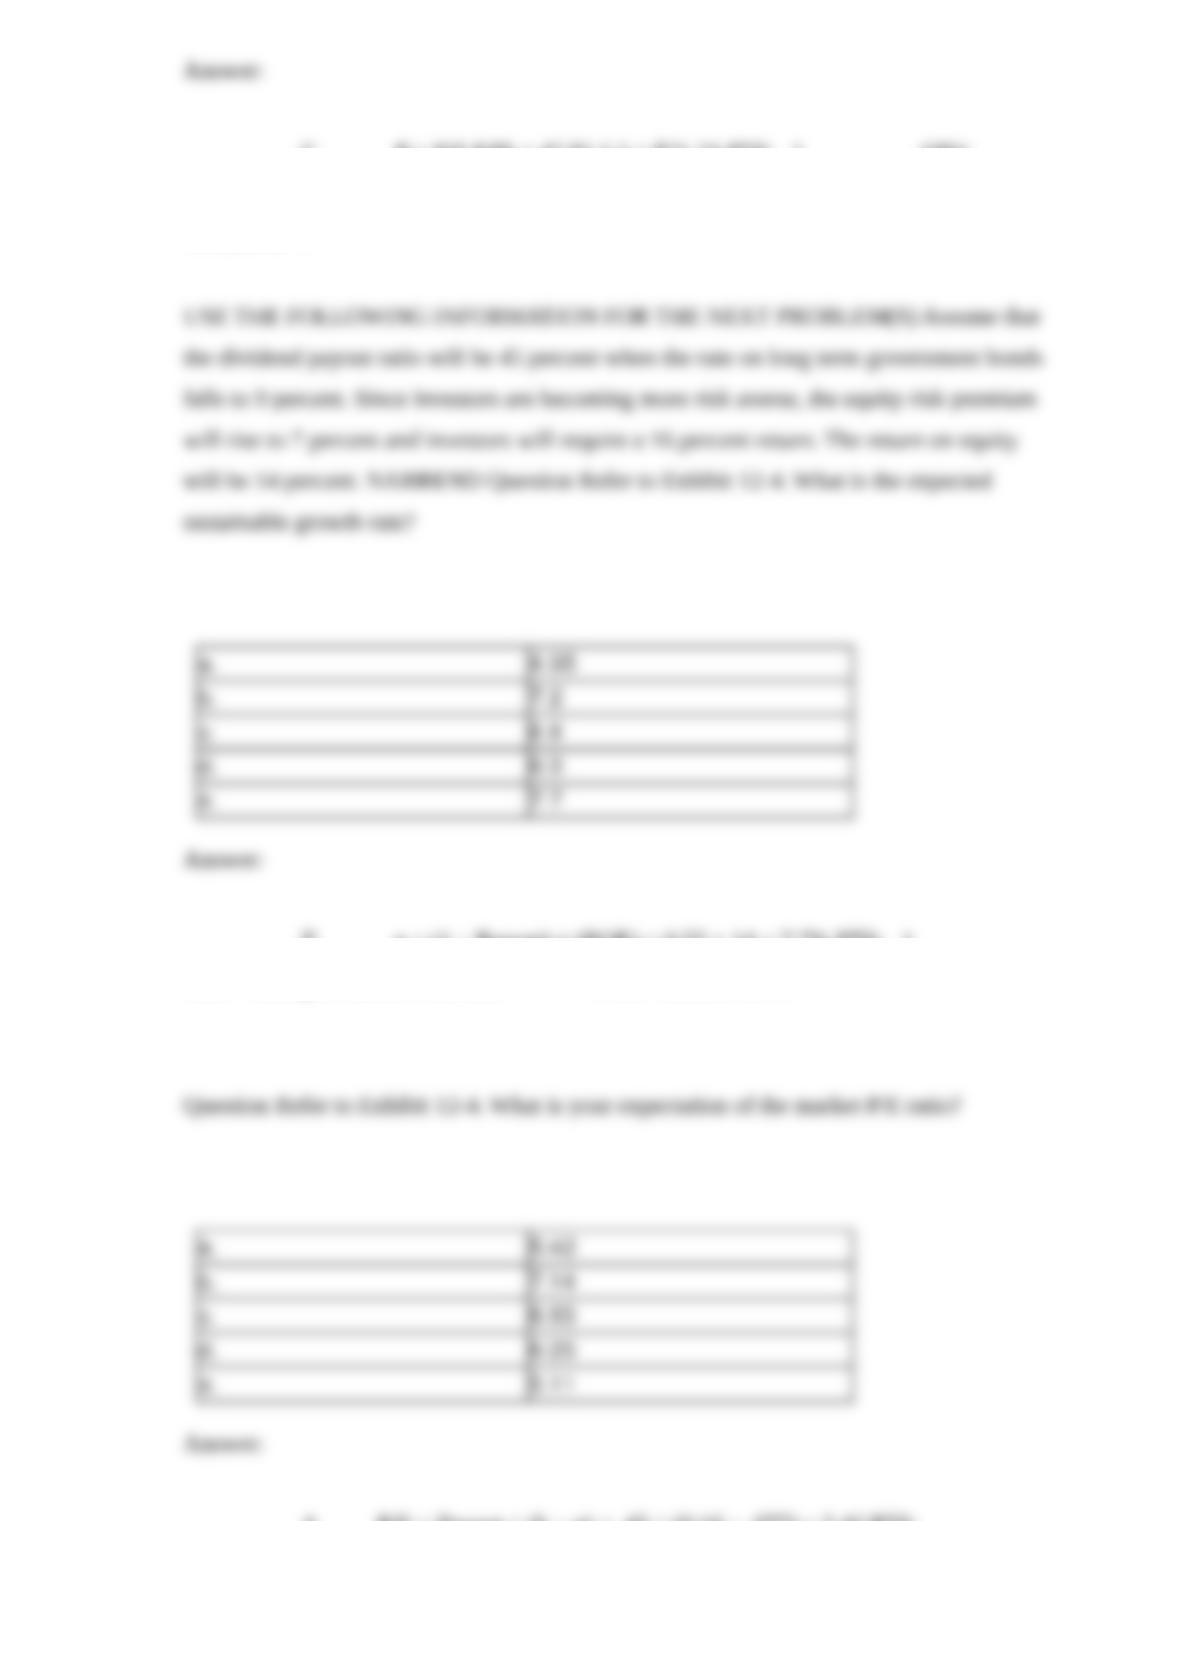
Question Refer to Exhibit 12-3. What is your expectation of the market P/E ratio?
Answer:
Question Refer to Exhibit 12-3. To what price will the market rise if the earnings
expectation is $1.5?
Answer:
USE THE FOLLOWING INFORMATION FOR THE NEXT PROBLEM(S) Assume that
the dividend payout ratio will be 45 percent when the rate on long term government bonds
falls to 9 percent. Since investors are becoming more risk averse, the equity risk premium
will rise to 7 percent and investors will require a 16 percent return. The return on equity
will be 14 percent. NARREND Question Refer to Exhibit 12-4. What is the expected
sustainable growth rate?
Answer:
Question Refer to Exhibit 12-4. What is your expectation of the market P/E ratio?
Answer:
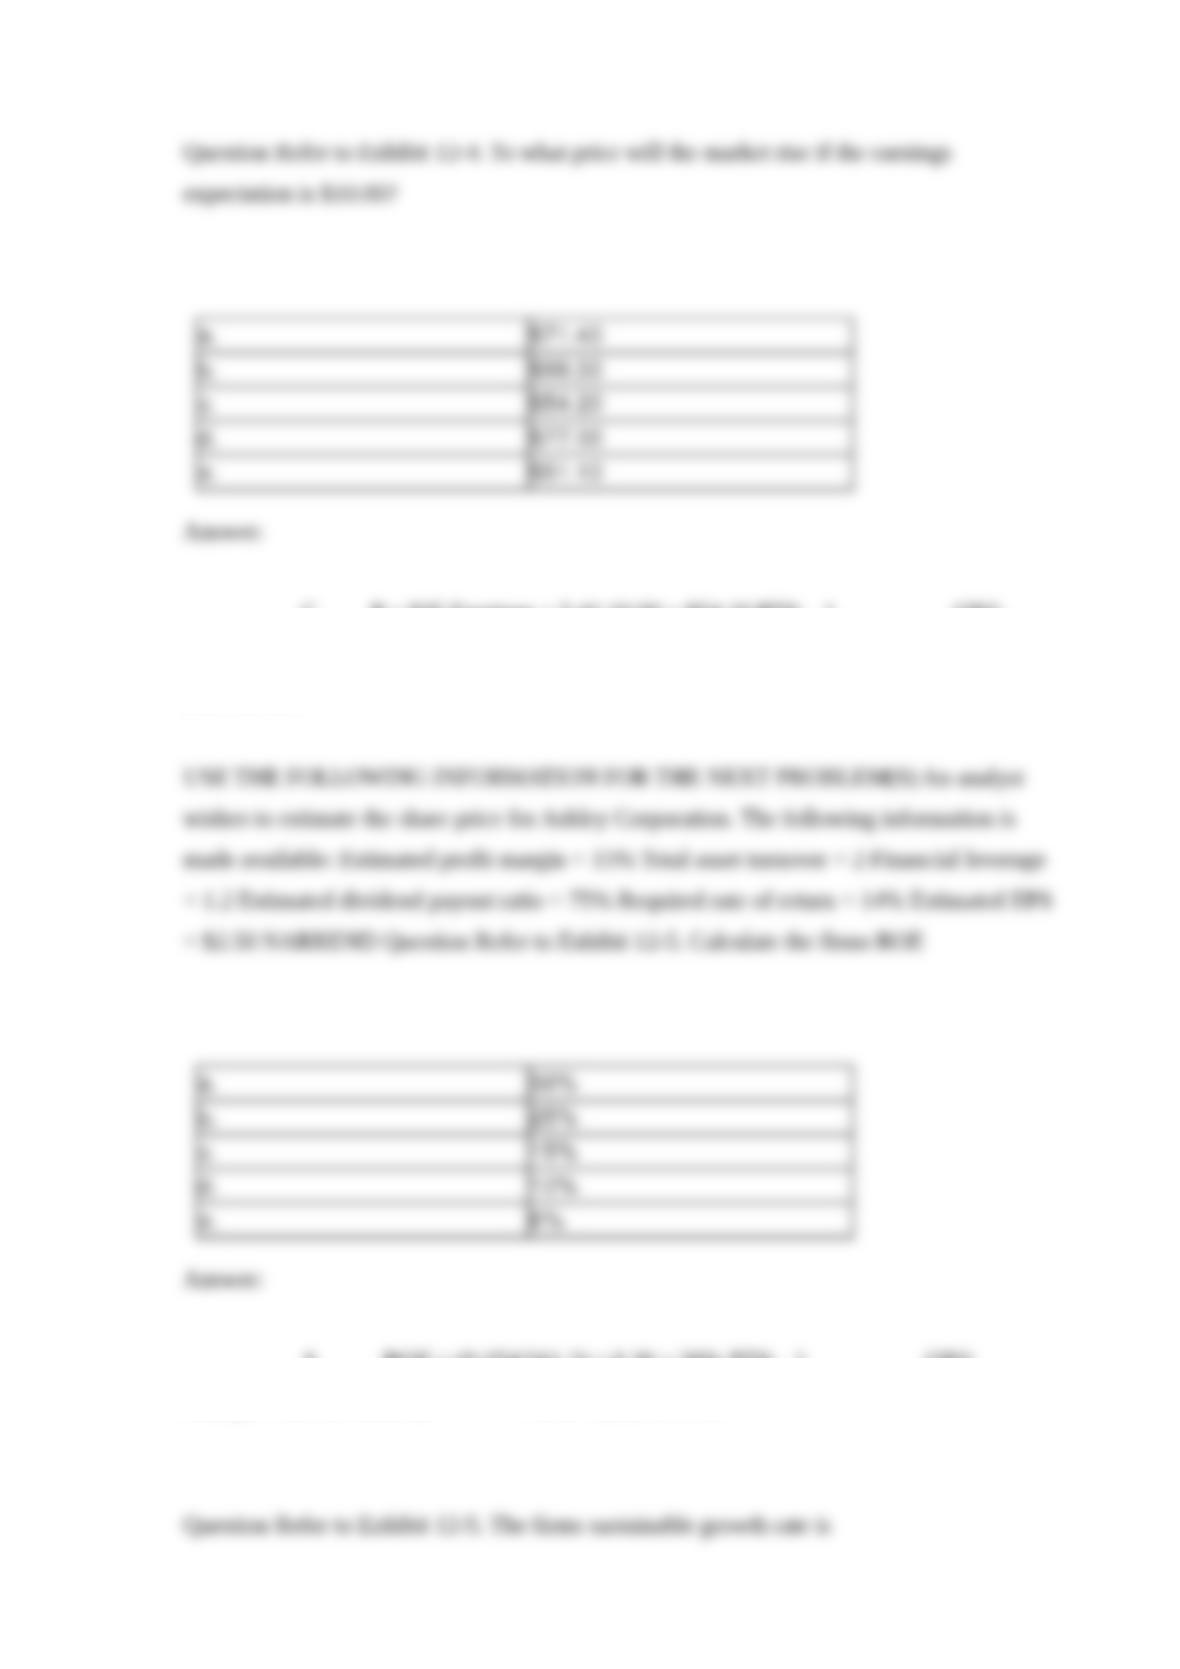
Question Refer to Exhibit 12-4. To what price will the market rise if the earnings
expectation is $10.00?
Answer:
USE THE FOLLOWING INFORMATION FOR THE NEXT PROBLEM(S) An analyst
wishes to estimate the share price for Ashley Corporation. The following information is
made available: Estimated profit margin = 15% Total asset turnover = 2 Financial leverage
= 1.2 Estimated dividend payout ratio = 75% Required rate of return = 14% Estimated EPS
= $2.50 NARREND Question Refer to Exhibit 12-5. Calculate the firms ROE
Answer:
Question Refer to Exhibit 12-5. The firms sustainable growth rate is

Answer:
Question Refer to Exhibit 12-5. Calculate the P/E multiple
Answer:
Question Refer to Exhibit 12-5. Calculate the firms estimated share price
Answer:
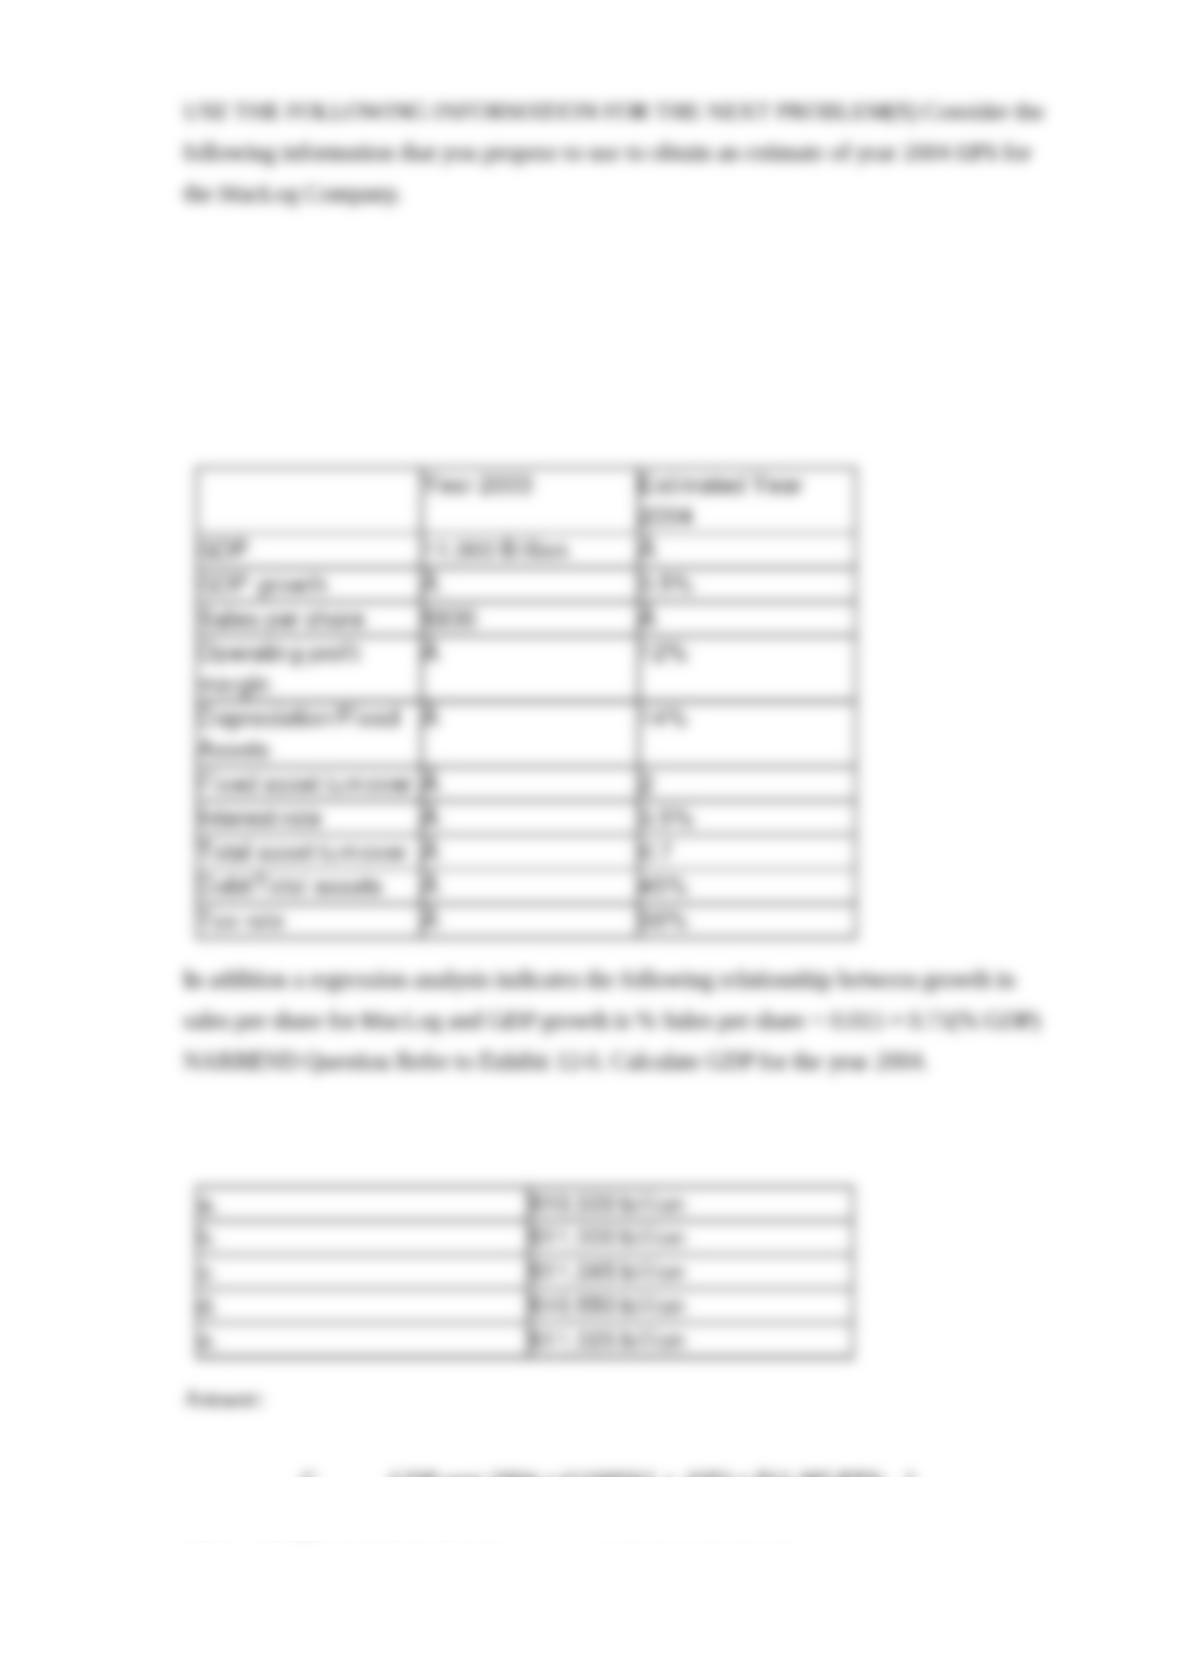
USE THE FOLLOWING INFORMATION FOR THE NEXT PROBLEM(S) Consider the
following information that you propose to use to obtain an estimate of year 2004 EPS for
the MacLog Company.
In addition a regression analysis indicates the following relationship between growth in
sales per share for MacLog and GDP growth is % Sales per share = 0.015 + 0.75(% GDP)
NARREND Question Refer to Exhibit 12-6. Calculate GDP for the year 2004.
Answer:
Question Refer to Exhibit 12-6. Estimate the firms growth rate in sales per share.
Answer:
Question Refer to Exhibit 12-6. Estimate the firms sales per share for the year 2004.
Answer:
Question Refer to Exhibit 12-6. Calculate the firms year 2004 EBITDA per share.
Answer:
Question Refer to Exhibit 12-6. Obtain an estimate of the per share depreciation charge for
the year 2004.
Answer:
Question Refer to Exhibit 12-6. Calculate the per share EBIT for the year 2004.
Answer:
Question Refer to Exhibit 12-6. Calculate the firms level of Total Assets per share for the
year 2004.
Answer:
Question Refer to Exhibit 12-6. Calculate the firms level of debt for the year 2004.
Answer:
Question Refer to Exhibit 12-6. Calculate the per share interest rate charge for the year
2004.
Answer:
Question Refer to Exhibit 12-6. Calculate the firms EBT per share for the year 2004.
Answer:
Question Refer to Exhibit 12-6. Calculate the firms EPS for the year 2004.
Answer:
USE THE FOLLOWING INFORMATION FOR THE NEXT PROBLEM(S) You are
using the free cash flow to equity (FCFE) technique to analyze U.S. equity market. The
beginning FCFE is $90 and the required rate of return is 10%. Free cash flows are
expected to grow at a 10% rate for the next two years and then grow at a constant rate of
7% forever. NARREND Question Refer to Exhibit 12-7. What will FCFE be three years
from now?
Answer:
Question Refer to Exhibit 12-7. What is the estimated value of the U.S. market today using
the FCFE approach?
Answer:
Question Refer to Exhibit 12-7. What would the estimated value of the U.S. market be
today using the FCFE approach, if the growth rate was expected to be a constant 8%
indefinitely, instead of the 10% and 7% estimates?
Answer:
Question Compute the current earnings multiple if the dividend payout ratio for the
aggregate market is 60 percent, the required rate of return is 11%, and the dividend growth
rate is 8%.
Answer:
USE THE FOLLOWING INFORMATION FOR THE NEXT PROBLEM(S) As an
economist for a research firm you are forecasting the market P/E ratio using the dividend
discount model. Because the economy has been slow for 5 years, you expect the
dividend-payout ratio to be 55%. Long-term government bond rates are at 6% and the
equity risk premium is estimated to be 3%. Return on equity (ROE) is estimated to be
11%. NARREND Question Refer to Exhibit 12-8. What is the expected growth rate?
Answer:
Question Refer to Exhibit 12-8. What is your expectation of the market P/E ratio?
Answer: