38
CHAPTER 5
INTRODUCTION TO NEOCLASSICAL TRADE THEORY:
Tools to Be Employed
B.
M
Mu
ul
lt
ti
ip
pl
le
e–
–C
Ch
ho
oi
ic
ce
e
Q
Qu
ue
es
st
ti
io
on
ns
s
7
7.
.
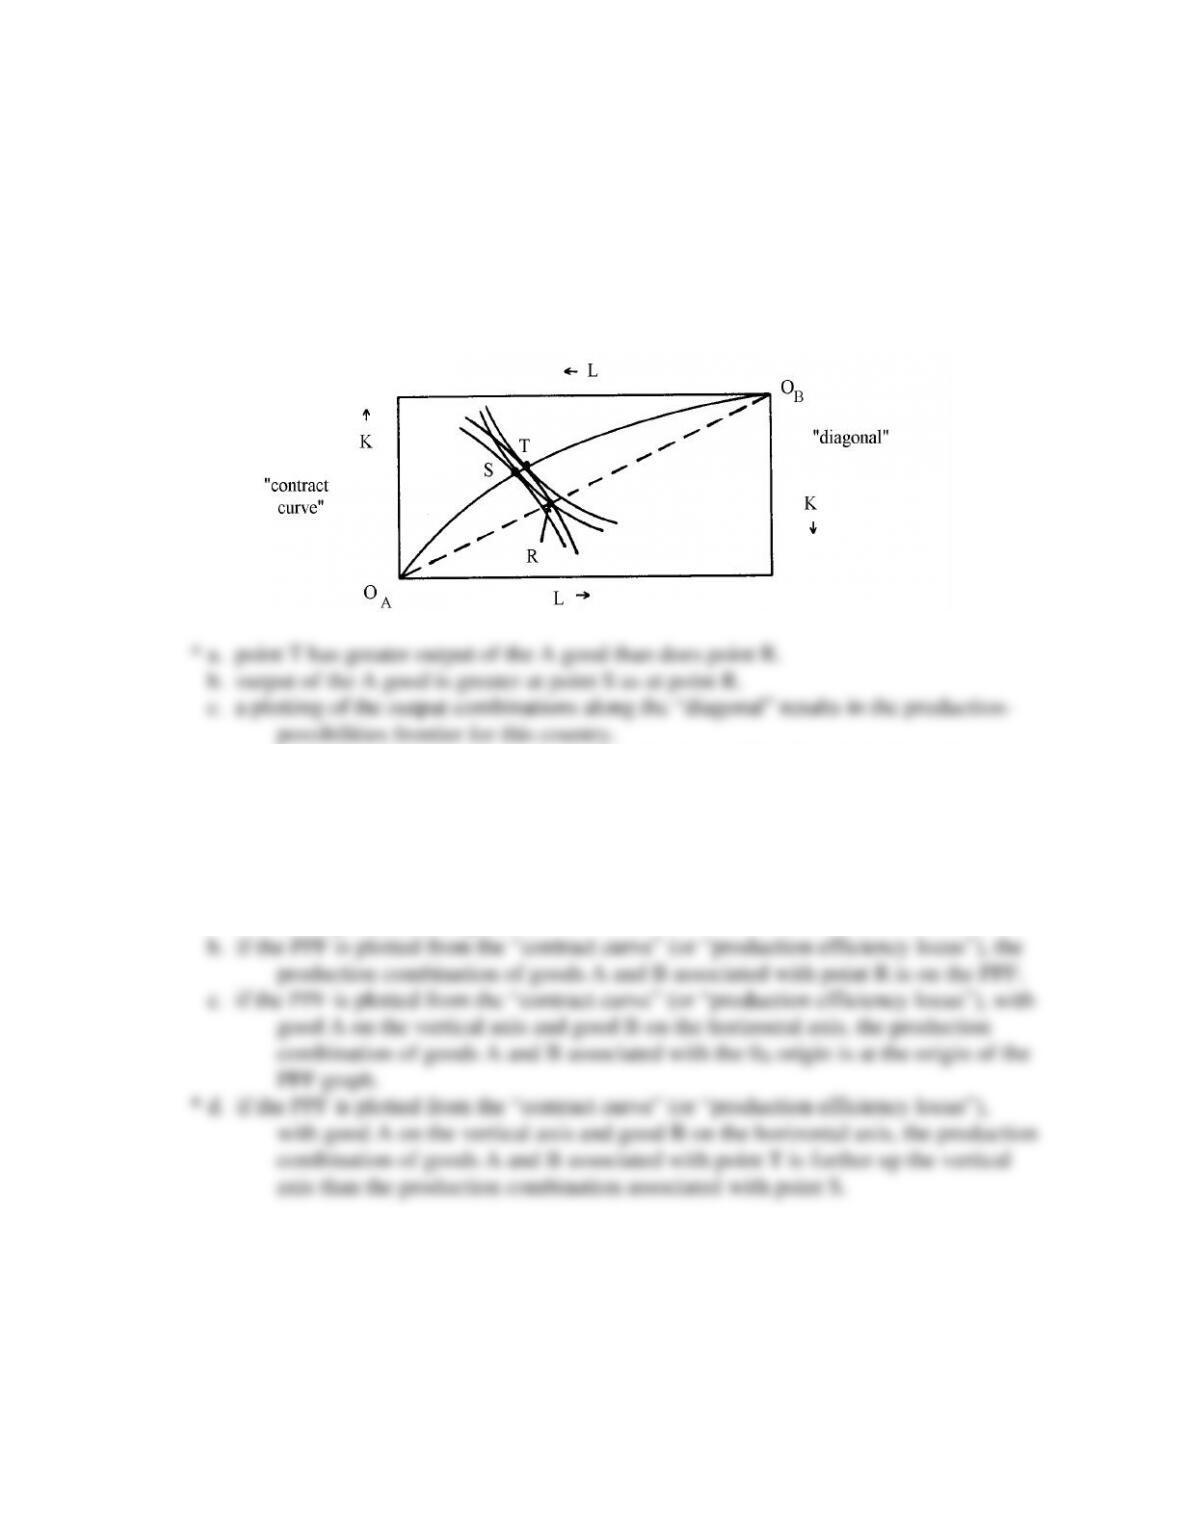
I
In
n
t
th
he
e
f
fo
ol
ll
lo
ow
wi
in
ng
g
E
Ed
dg
ge
ew
wo
or
rt
th
h
b
bo
ox
x
d
di
ia
ag
gr
ra
am
m
f
fo
or
r
a
a
c
co
ou
un
nt
tr
ry
y’
’s
s
p
pr
ro
od
du
uc
ct
ti
io
on
n,
,
d. good A is the relatively labor-intensive good and good B is the relatively capital-
intensive good.
8. In the diagram in Question #7 above,
a. a movement from point S to point T involves an increase in the capital/labor ratio used
in the production of good A.
9. In the diagram in Question #7 above, a movement from point S to point T will lead to
__________ in the capital/labor ratio used in the production of good A and __________
in the capital/labor ratio used in the production of good B.
a. an increase; will lead to a decrease
39
10. If, for a consumer, (MUA/PA) is greater than (MUB/PB), then the consumer
a. has an incentive to consume relatively more of good A, which will increase his/her
MUA.
11. In the following table of production possibilities for a country,
Good X Good Y
0 units 13 units
1 unit 10 units
2 units 6 units
3 units 0 units
there are __________ opportunity costs in the production of good X, and there
are __________ opportunity costs in the production of good Y.
d. constant; decreasing
12. Two indifference curves for an individual consumer __________ intersect; two
community indifference curves for a country __________.
a. cannot; also cannot intersect
d. can; cannot intersect
13. Which one of the following sequences of specifications of relative preferences for
bundles of goods A, B, and C by a consumer indicates the property of transitivity (where
“>” indicates that the preferred bundle is on the left, “<” indicates that the preferred
bundle is on the right, and “=” means indifference between the bundles)?
a. A > B; B > C; C > A
40
14. In the following table of production possibilities for a country,
Good X Good Y
400 units 0 units
300 units 100 units
200 units 180 units
100 units 240 units
0 units 280 units
there are __________ opportunity costs when moving to greater production of good X
and __________ when moving to greater production of good Y.
a. increasing; decreasing
15. Suppose that, in the isoquant-isocost diagram, with given relative factor prices, an
equilibrium input combination of 10 units of capital and 30 units of labor yields an output
level for the firm of 120 units. Suppose that, for this firm, at the same relative factor
prices but with a larger budget, an equilibrium input combination of 15 units of capital
and 45 units of labor yields an output level of 160 units. Viewing these input-output
relationships, an economist would say that, in its production process, this firm
experiences
a. increasing returns to scale.
16. In the Edgeworth box diagram for production,
a. a point off the “contract curve” (or “production efficiency locus”) cannot have more
production of one of the goods than can some point on the curve.
41
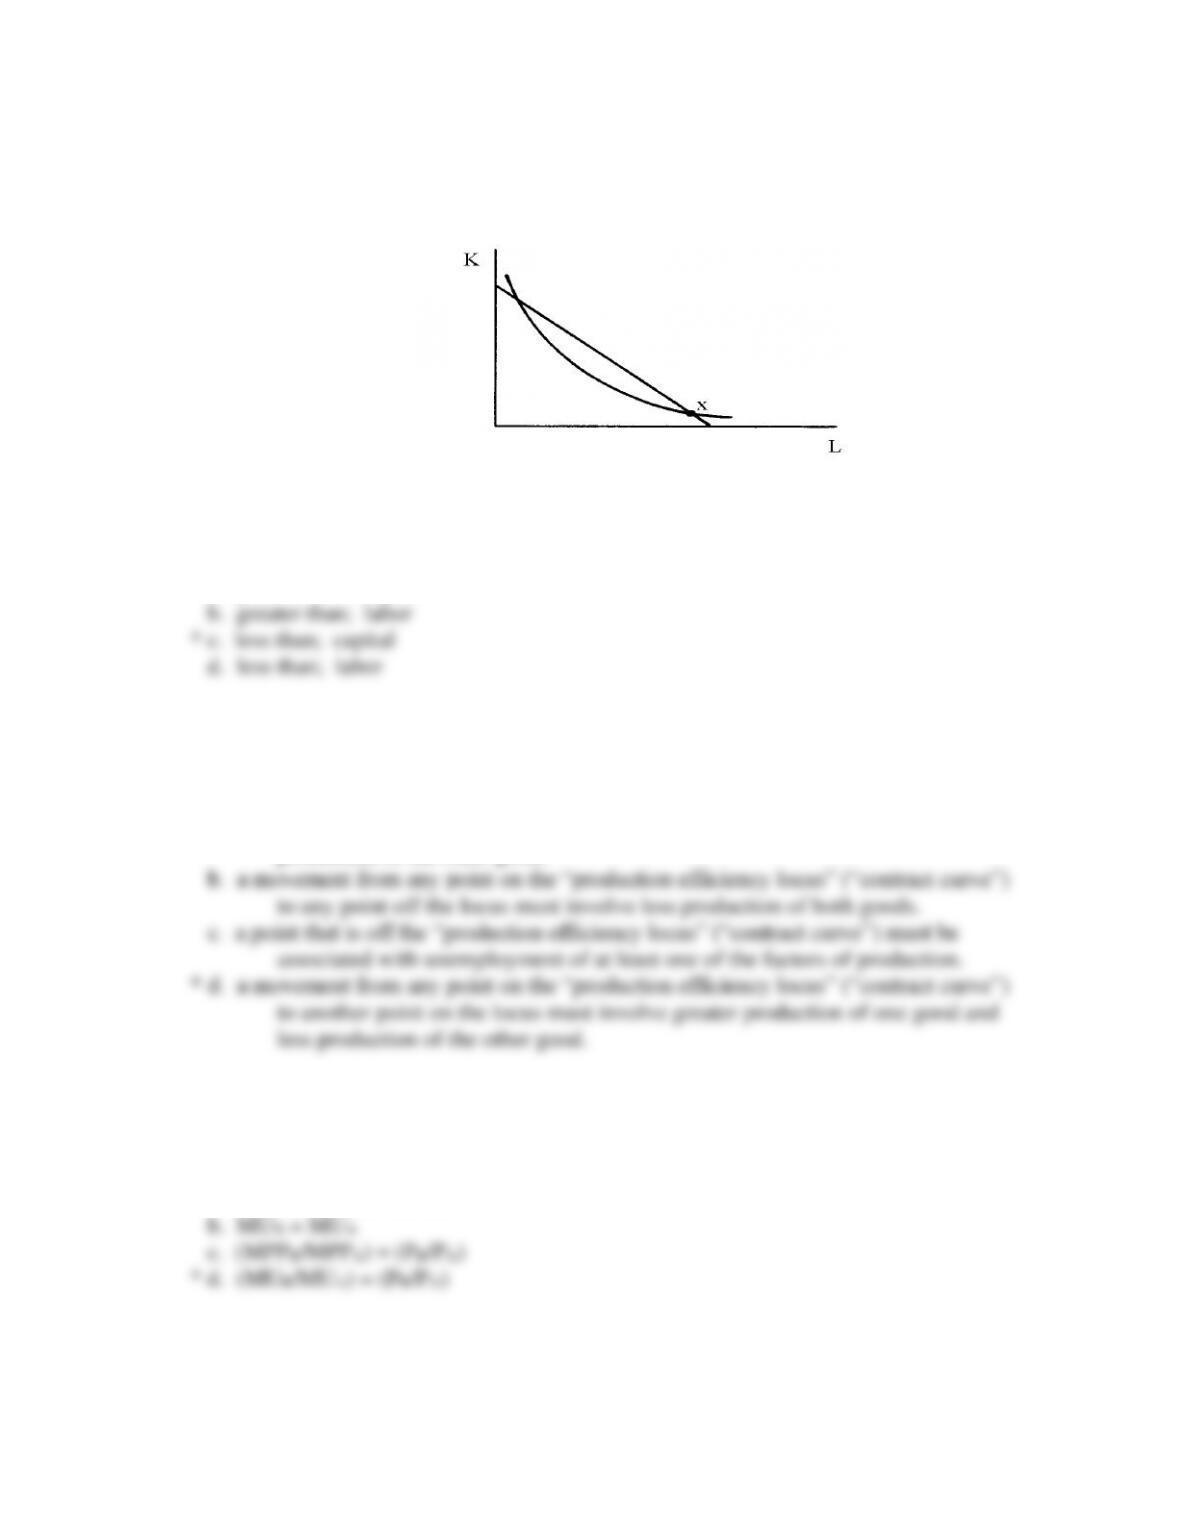
17. In the following graph showing an isoquant and an isocost line, at point X,
MPPL/MPPK is __________ w/r and the producer has an incentive to use relatively more
__________ in producing the given output.
a. greater than; capital
18. In the Edgeworth box diagram in production with two goods and two factors of
production,
a. a movement from any point off the “production efficiency locus” (“contract curve”)
to any point on the locus must involve greater production of one good and less
production of the other good.
19. The equilibrium condition for consumer behavior pertaining to goods A and B is
__________.
a. (MUB/PA) = (MUA/PB)
42
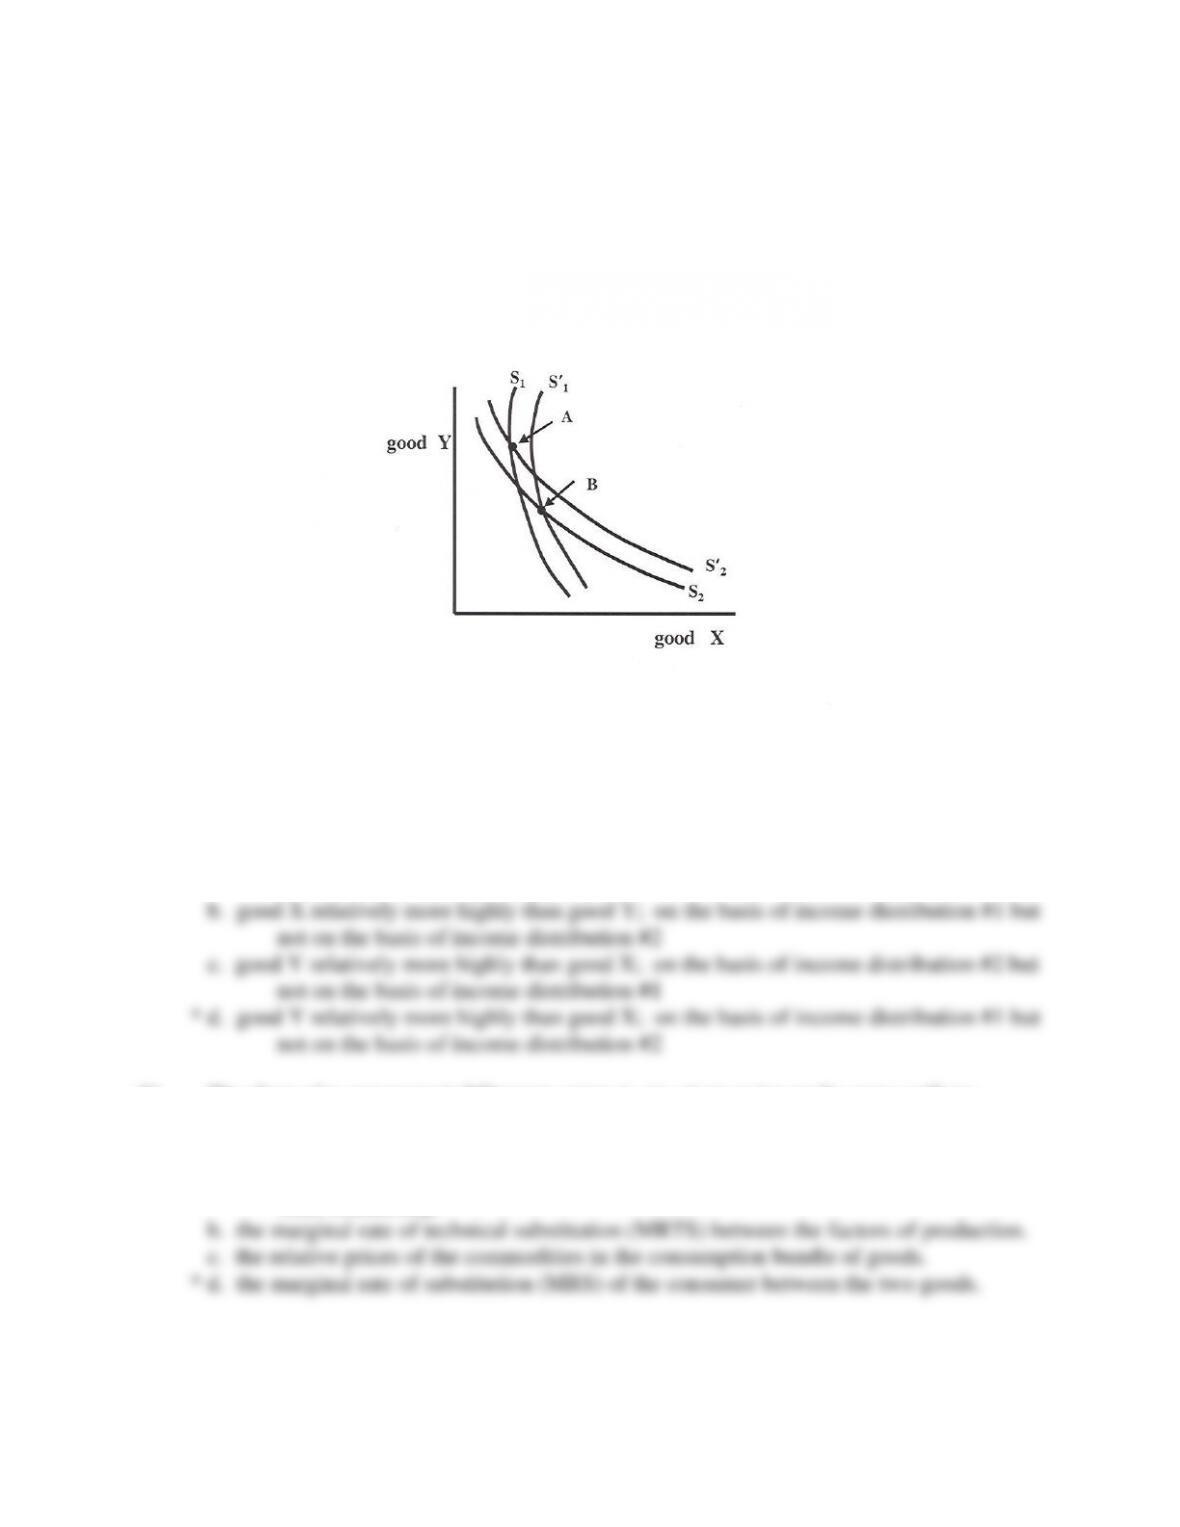
20. You are given the following two possible community indifference curve maps for a
country, where curves S1 and S’1 pertain to income distribution #1 and curves S2 and S’2
pertain to income distribution #2:
The differing shapes of the curves in these two maps could reflect the fact that in income
distribution #2, in comparison with income distribution #1, a greater share of total
income is held by individuals who value __________. In addition, in this diagram, point
B is preferred to point A __________.
a. good X relatively more highly than good Y; on the basis of income distribution #2 but
not on the basis of income distribution #1
21. The slope of a consumer indifference curve at any given point on the curve reflects
(ignoring the negative sign)
a. the marginal rate of transformation (MRT) in production of one commodity into the
other commodity.
43
22. A production isoquant shows the various combinations
d. of two goods that bring an equivalent satisfaction level to an individual consumer.
23. The equilibrium condition for producers (i.e., the condition that exists when the isocost
line is tangent to an isoquant) is __________.
d. (MUB/PA) = (MUA/PB)
24. Given the following table showing various combinations of goods X and Y that bring
equal satisfaction to an individual consumer:
good X good Y
2 units 10 units
3 units 9 units
4 units 6 units
5 units 2 units
In this table, as the individual consumes a greater amount of X, a __________ amount of
good Y is given up for each additional unit of good X. This pattern suggests that, as
more of good X is consumed and less of good Y is consumed, the ratio MUX/MUY is
__________.
d. smaller; decreasing, which conforms to economists’ usual expectations
44
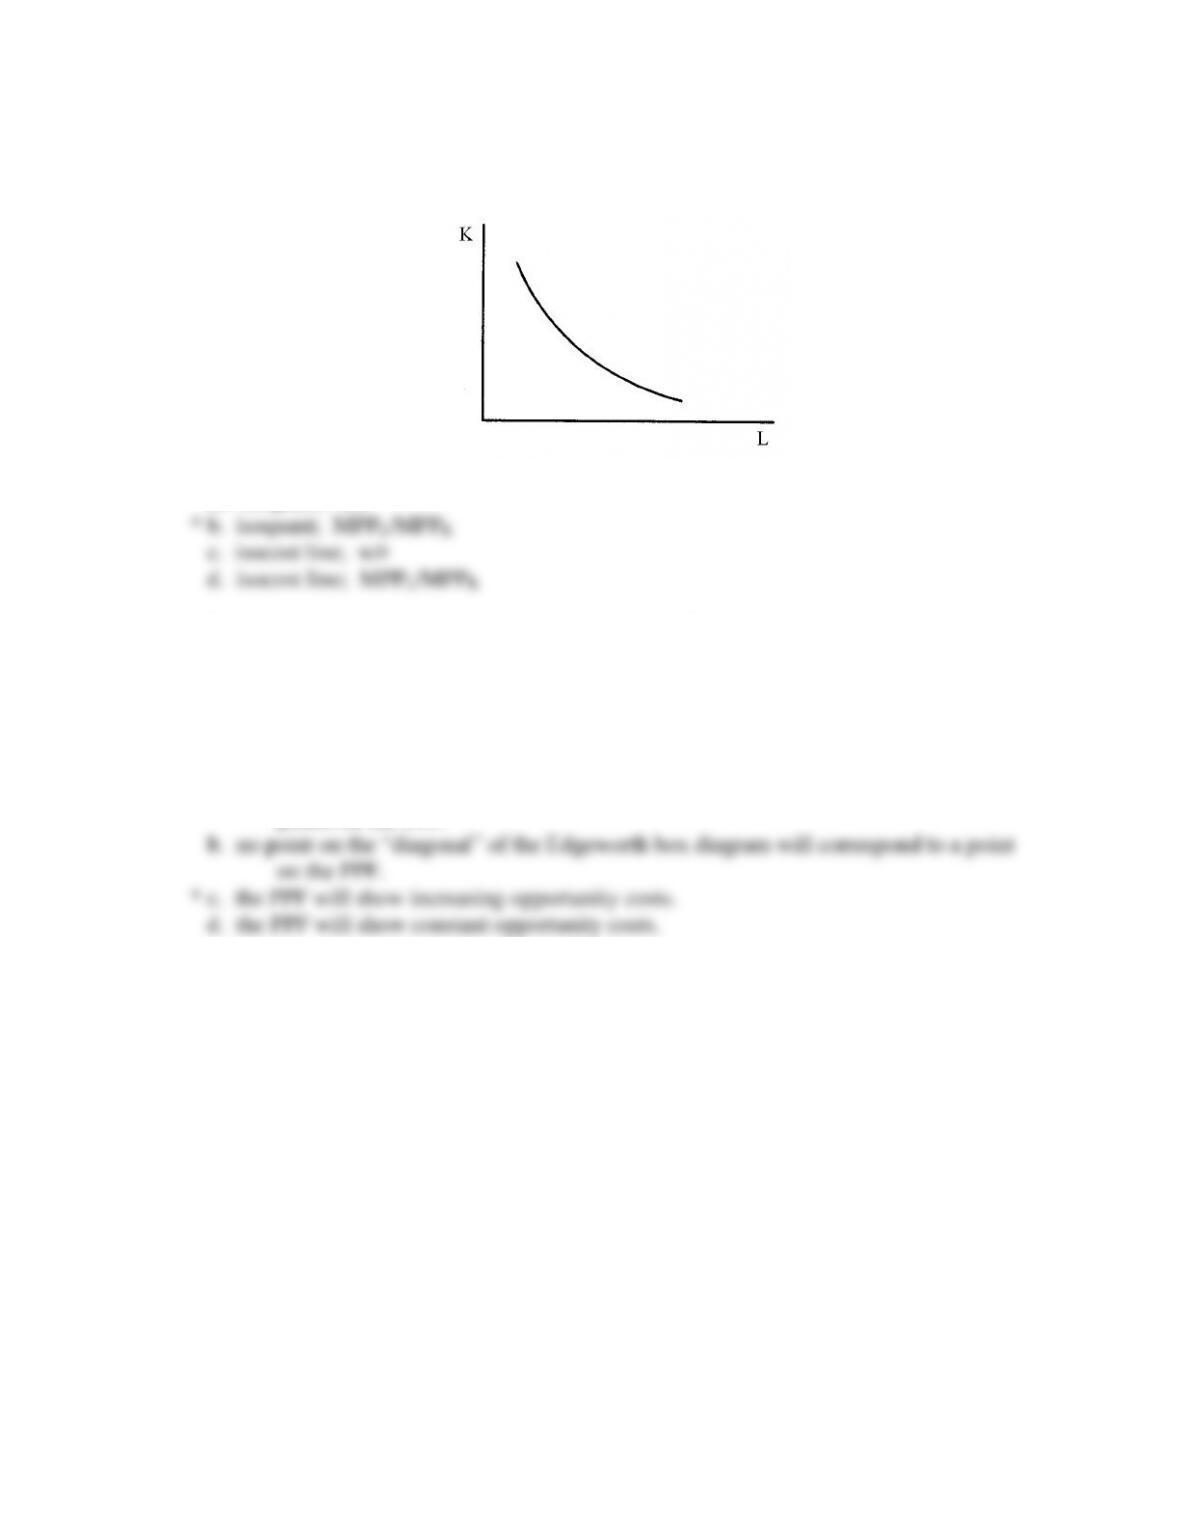
25. The curve in the following diagram is called an __________, and its slope (ignoring the
negative sign) indicates the ratio __________.
a.. isoquant; w/r
26. Suppose that, in the context of the Edgeworth box diagram in production, there are
constant returns to scale in each of the two industries and that one good is relatively
labor-intensive in its production process and the other good is relatively capital-intensive
in its production process. In considering this Edgeworth box diagram and the PPF that
can be derived from it,
a. all points on the “diagonal” of the Edgeworth box diagram will have corresponding
points on the PPF.