Copyright Cengage Learning. Powered by Cognero.
Page 1
1. Which of the following does not represent an automatic adjustment in balance-of-payments disequilibrium? Variations
in:
a.
Domestic income
b.
Foreign prices
c.
Domestic prices
d.
Foreign par values
ANSWER:
d
POINTS:
1
DIFFICULTY:
Moderate
QUESTION TYPE:
Multiple Choice
HAS VARIABLES:
False
NATIONAL STANDARDS:
United States – BUSPROG: Analytic Reflective Thi – BUSPROG: Reflective Thinking
United States – BUSPROG: Promotion – BUSPROG: Analytic
STATE STANDARDS:
United States – PA – DISC: International trade and fi – DISC: International trade and finance
TOPICS:
Price Adjustments
KEYWORDS:
BLOOM’S: Understand
DATE CREATED:
6/22/2016 3:25 PM
DATE MODIFIED:
6/22/2016 3:25 PM
2. The balance-of-payments adjustment mechanism developed during the 1700s by the English economist David Hume is
the:
a.
Income-adjustment mechanism
b.
Flexible-exchange-rate-adjustment mechanism
c.
Price-adjustment mechanism
d.
Rank-reserve-adjustment mechanism
ANSWER:
c
POINTS:
1
DIFFICULTY:
Moderate
QUESTION TYPE:
Multiple Choice
HAS VARIABLES:
False
NATIONAL STANDARDS:
United States – BUSPROG: Analytic Reflective Thi – BUSPROG: Reflective Thinking
United States – BUSPROG: Promotion – BUSPROG: Analytic
STATE STANDARDS:
United States – PA – DISC: International trade and fi – DISC: International trade and finance
TOPICS:
Price Adjustments
KEYWORDS:
BLOOM’S: Remember
DATE CREATED:
6/22/2016 3:25 PM
DATE MODIFIED:
6/22/2016 3:25 PM
3. Which chain of events would promote payments equilibrium for a surplus nation, according to the price-adjustment
mechanism?
a.
Increasing money supply—increasing domestic prices—rising imports—falling exports
b.
Increasing money supply—falling domestic prices—rising imports—falling exports
c.
Decreasing money supply—increasing domestic prices—falling imports—rising exports
d.
Decreasing money supply—decreasing domestic prices—falling imports—rising exports
ANSWER:
a
POINTS:
1
Copyright Cengage Learning. Powered by Cognero.
Page 2
DIFFICULTY:
Challenging
QUESTION TYPE:
Multiple Choice
HAS VARIABLES:
False
NATIONAL STANDARDS:
United States – BUSPROG: Analytic Reflective Thi – BUSPROG: Reflective Thinking
United States – BUSPROG: Promotion – BUSPROG: Analytic
STATE STANDARDS:
United States – PA – DISC: International trade and fi – DISC: International trade and finance
TOPICS:
Price Adjustments
KEYWORDS:
BLOOM’S: Analyze
DATE CREATED:
6/22/2016 3:25 PM
DATE MODIFIED:
6/22/2016 3:25 PM
4. Which chain of events would promote payments equilibrium for a deficit nation, according to the price-adjustment
mechanism?
a.
Increasing money supply—increasing domestic prices—rising imports—falling exports
b.
Increasing money supply—falling domestic prices—rising imports—falling exports
c.
Decreasing money supply—increasing domestic prices—falling imports—rising exports
d.
Decreasing money supply—decreasing domestic prices—falling imports—rising exports
ANSWER:
d
POINTS:
1
DIFFICULTY:
Challenging
QUESTION TYPE:
Multiple Choice
HAS VARIABLES:
False
NATIONAL STANDARDS:
United States – BUSPROG: Analytic Reflective Thi – BUSPROG: Reflective Thinking
United States – BUSPROG: Promotion – BUSPROG: Analytic
STATE STANDARDS:
United States – PA – DISC: International trade and fi – DISC: International trade and finance
TOPICS:
Price Adjustments
KEYWORDS:
BLOOM’S: Understand
DATE CREATED:
6/22/2016 3:25 PM
DATE MODIFIED:
6/22/2016 3:25 PM
5. During the gold standard era, central bankers agreed to react positively to international gold flows so as to reinforce the
automatic adjustment mechanism. Which of the following best represents the above statement?
a.
Income-adjustment mechanism
b.
Price-adjustment mechanism
c.
Rules of the game
d.
Discretionary fiscal policy
ANSWER:
c
POINTS:
1
DIFFICULTY:
Moderate
QUESTION TYPE:
Multiple Choice
HAS VARIABLES:
False
NATIONAL STANDARDS:
United States – BUSPROG: Analytic Reflective Thi – BUSPROG: Reflective Thinking
United States – BUSPROG: Promotion – BUSPROG: Analytic
STATE STANDARDS:
United States – PA – DISC: International trade and fi – DISC: International trade and finance
TOPICS:
Price Adjustments
KEYWORDS:
BLOOM’S: Understand
Copyright Cengage Learning. Powered by Cognero.
Page 3
DATE CREATED:
6/22/2016 3:25 PM
DATE MODIFIED:
6/22/2016 3:25 PM
6. During the gold standard era, the “rules of the game” suggested that:
a.
Surplus countries should increase their money supplies
b.
Deficit countries should increase their money supplies
c.
Surplus and deficit countries should increase their money supplies
d.
Surplus and deficit countries should decrease their money supplies
ANSWER:
a
POINTS:
1
DIFFICULTY:
Moderate
QUESTION TYPE:
Multiple Choice
HAS VARIABLES:
False
NATIONAL STANDARDS:
United States – BUSPROG: Analytic Reflective Thi – BUSPROG: Reflective Thinking
United States – BUSPROG: Promotion – BUSPROG: Analytic
STATE STANDARDS:
United States – PA – DISC: International trade and fi – DISC: International trade and finance
TOPICS:
Price Adjustments
KEYWORDS:
BLOOM’S: Understand
DATE CREATED:
6/22/2016 3:25 PM
DATE MODIFIED:
6/22/2016 3:25 PM
7. Which of the following balance-of-payments adjustment mechanisms is most closely related to the quantity theory of
money?
a.
Income-adjustment mechanism
b.
Price-adjustment mechanism
c.
Interest-rate-adjustment mechanism
d.
Output-adjustment mechanism
ANSWER:
b
POINTS:
1
DIFFICULTY:
Moderate
QUESTION TYPE:
Multiple Choice
HAS VARIABLES:
False
NATIONAL STANDARDS:
United States – BUSPROG: Analytic Reflective Thi – BUSPROG: Reflective Thinking
United States – BUSPROG: Promotion – BUSPROG: Analytic
STATE STANDARDS:
United States – PA – DISC: International trade and fi – DISC: International trade and finance
TOPICS:
Price Adjustments
KEYWORDS:
BLOOM’S: Understand
DATE CREATED:
6/22/2016 3:25 PM
DATE MODIFIED:
6/22/2016 3:25 PM
8. Under the gold standard, a surplus nation facing a gold inflow and an increase in its money supply would also
experience a:
a.
Rise in its interest rate and a short-term financial inflow
b.
Rise in its interest rate and a short-term financial outflow
c.
Fall in its interest rate and a short-term financial inflow
d.
Fall in its interest rate and a short-term financial outflow
Copyright Cengage Learning. Powered by Cognero.
Page 4
ANSWER:
d
POINTS:
1
DIFFICULTY:
Moderate
QUESTION TYPE:
Multiple Choice
HAS VARIABLES:
False
NATIONAL STANDARDS:
United States – BUSPROG: Analytic Reflective Thi – BUSPROG: Reflective Thinking
United States – BUSPROG: Promotion – BUSPROG: Analytic
STATE STANDARDS:
United States – PA – DISC: International trade and fi – DISC: International trade and finance
TOPICS:
Price Adjustments
KEYWORDS:
BLOOM’S: Understand
DATE CREATED:
6/22/2016 3:25 PM
DATE MODIFIED:
6/22/2016 3:25 PM
9. Under the gold standard, a deficit nation facing a gold outflow and a decrease in its money supply would also
experience a:
a.
Rise in its interest rate and a short-term financial inflow
b.
Rise in its interest rate and a short-term financial outflow
c.
Fall in its interest rate and a short-term financial inflow
d.
Fall in its interest rate and a short-term financial outflow
ANSWER:
a
POINTS:
1
DIFFICULTY:
Moderate
QUESTION TYPE:
Multiple Choice
HAS VARIABLES:
False
NATIONAL STANDARDS:
United States – BUSPROG: Analytic Reflective Thi – BUSPROG: Reflective Thinking
United States – BUSPROG: Promotion – BUSPROG: Analytic
STATE STANDARDS:
United States – PA – DISC: International trade and fi – DISC: International trade and finance
TOPICS:
Price Adjustments
KEYWORDS:
BLOOM’S: Understand
DATE CREATED:
6/22/2016 3:25 PM
DATE MODIFIED:
6/22/2016 3:25 PM
10. Assume that Canada initially faces payments equilibrium in its merchandise trade account as well as in its capital and
financial account. Now suppose that Canadian interest rates increase to levels higher than those abroad. For Canada, this
tends to promote:
a.
Net financial inflows
b.
Net financial outflows
c.
Net merchandise exports
d.
Net merchandise imports
ANSWER:
a
POINTS:
1
DIFFICULTY:
Challenging
QUESTION TYPE:
Multiple Choice
HAS VARIABLES:
False
NATIONAL STANDARDS:
United States – BUSPROG: Analytic Reflective Thi – BUSPROG: Reflective Thinking
United States – BUSPROG: Promotion – BUSPROG: Analytic

Copyright Cengage Learning. Powered by Cognero.
Page 5
STATE STANDARDS:
United States – PA – DISC: International trade and fi – DISC: International trade and finance
TOPICS:
Financial Flows and Interest-Rate Differentials
KEYWORDS:
BLOOM’S: Understand
DATE CREATED:
6/22/2016 3:25 PM
DATE MODIFIED:
6/22/2016 3:25 PM
11. Assume that Canada initially faces payments equilibrium in its merchandise trade account as well as in its capital and
financial account. Now suppose that Canadian interest rates fall to levels below those abroad. For Canada, this tends to
promote:
a.
Net financial inflows
b.
Net financial outflows
c.
Net merchandise exports
d.
Net merchandise imports
ANSWER:
b
POINTS:
1
DIFFICULTY:
Challenging
QUESTION TYPE:
Multiple Choice
HAS VARIABLES:
False
NATIONAL STANDARDS:
United States – BUSPROG: Analytic Reflective Thi – BUSPROG: Reflective Thinking
United States – BUSPROG: Promotion – BUSPROG: Analytic
STATE STANDARDS:
United States – PA – DISC: International trade and fi – DISC: International trade and finance
TOPICS:
Financial Flows and Interest-Rate Differentials
KEYWORDS:
BLOOM’S: Understand
DATE CREATED:
6/22/2016 3:25 PM
DATE MODIFIED:
6/22/2016 3:25 PM
12. Suppose the United States levies an interest equalization tax, which taxes Americans on dividend and interest income
from foreign securities. Such a tax would be intended to:
a.
Encourage financial movements from the United States to overseas
b.
Discourage financial movements from the United States to overseas
c.
Discourage financial movements from overseas to the United States
d.
None of the above
ANSWER:
b
POINTS:
1
DIFFICULTY:
Moderate
QUESTION TYPE:
Multiple Choice
HAS VARIABLES:
False
NATIONAL STANDARDS:
United States – BUSPROG: Analytic Reflective Thi – BUSPROG: Reflective Thinking
United States – BUSPROG: Promotion – BUSPROG: Analytic
STATE STANDARDS:
United States – PA – DISC: International trade and fi – DISC: International trade and finance
TOPICS:
Financial Flows and Interest-Rate Differentials
KEYWORDS:
BLOOM’S: Understand
DATE CREATED:
6/22/2016 3:25 PM
DATE MODIFIED:
6/22/2016 3:25 PM
13. Assume that interest rates on comparable securities are identical in the United States and foreign countries. Now
suppose that investors anticipate that in the future the U.S. dollar will appreciate against foreign currencies. Investment
a.
2
c.
4
funds would thus be expected to:
a.
Flow from the United States to foreign countries
b.
Flow from foreign countries to the United States
c.
Remain totally in foreign countries
d.
Not be affected by the expected dollar appreciation
ANSWER:
b
POINTS:
1
DIFFICULTY:
Challenging
QUESTION TYPE:
Multiple Choice
HAS VARIABLES:
False
NATIONAL STANDARDS:
United States – BUSPROG: Analytic Reflective Thi – BUSPROG: Reflective Thinking
United States – BUSPROG: Promotion – BUSPROG: Analytic
STATE STANDARDS:
United States – PA – DISC: International trade and fi – DISC: International trade and finance
TOPICS:
Financial Flows and Interest-Rate Differentials
KEYWORDS:
BLOOM’S: Understand
DATE CREATED:
6/22/2016 3:25 PM
DATE MODIFIED:
6/22/2016 3:25 PM
14. Suppose Japan increases its imports from Sweden, leading to a rise in Sweden’s exports and income level. With a
higher income level, Sweden imports more goods from Japan. Thus a change in imports in Japan results in a feedback
effect on its exports. This process is best referred to as the:
a.
Monetary approach to balance-of-payments adjustment
b.
Discretionary income adjustment process
c.
Foreign repercussion effect
d.
Price-specie flow mechanism
ANSWER:
c
POINTS:
1
DIFFICULTY:
Moderate
QUESTION TYPE:
Multiple Choice
HAS VARIABLES:
False
NATIONAL STANDARDS:
United States – BUSPROG: Analytic Reflective Thi – BUSPROG: Reflective Thinking
United States – BUSPROG: Promotion – BUSPROG: Analytic
STATE STANDARDS:
United States – PA – DISC: International trade and fi – DISC: International trade and finance
TOPICS:
Income Adjustments
KEYWORDS:
BLOOM’S: Understand
DATE CREATED:
6/22/2016 3:25 PM
DATE MODIFIED:
6/22/2016 3:25 PM
Copyright Cengage Learning. Powered by Cognero.
Page 7
d.
5
ANSWER:
d
POINTS:
1
DIFFICULTY:
Challenging
QUESTION TYPE:
Multiple Choice
HAS VARIABLES:
False
PREFACE NAME:
Exhibit 13.1
NATIONAL STANDARDS:
United States – BUSPROG: Analytic Reflective Thi – BUSPROG: Reflective Thinking
United States – BUSPROG: Promotion – BUSPROG: Analytic
STATE STANDARDS:
United States – PA – DISC: International trade and fi – DISC: International trade and finance
TOPICS:
Income Adjustments
KEYWORDS:
BLOOM’S: Understand
DATE CREATED:
6/22/2016 3:25 PM
DATE MODIFIED:
6/22/2016 3:25 PM
16. Refer to Exhibit 13.1. The change in the level of U.S. income resulting from the additional investment spending equals
a.
$20 billion
b.
$30 billion
c.
$40 billion
d.
$50 billion
ANSWER:
d
POINTS:
1
DIFFICULTY:
Challenging
QUESTION TYPE:
Multiple Choice
HAS VARIABLES:
False
PREFACE NAME:
Exhibit 13.1
NATIONAL STANDARDS:
United States – BUSPROG: Analytic Reflective Thi – BUSPROG: Reflective Thinking
United States – BUSPROG: Promotion – BUSPROG: Analytic
STATE STANDARDS:
United States – PA – DISC: International trade and fi – DISC: International trade and finance
TOPICS:
Income Adjustments
KEYWORDS:
BLOOM’S: Understand
DATE CREATED:
6/22/2016 3:25 PM
DATE MODIFIED:
6/22/2016 3:25 PM
17. Refer to Exhibit 13.1. The change in the level of U.S. imports resulting from the rise in U.S. income equals:
a.
$5 billion
b.
$10 billion
c.
$15 billion
d.
$20 billion
ANSWER:
a
POINTS:
1
DIFFICULTY:
Challenging
QUESTION TYPE:
Multiple Choice
HAS VARIABLES:
False
PREFACE NAME:
Exhibit 13.1
Copyright Cengage Learning. Powered by Cognero.
Page 8
NATIONAL STANDARDS:
United States – BUSPROG: Analytic Reflective Thi – BUSPROG: Reflective Thinking
United States – BUSPROG: Promotion – BUSPROG: Analytic
STATE STANDARDS:
United States – PA – DISC: International trade and fi – DISC: International trade and finance
TOPICS:
Income Adjustments
KEYWORDS:
BLOOM’S: Understand
DATE CREATED:
6/22/2016 3:25 PM
DATE MODIFIED:
6/22/2016 3:25 PM
18. The monetary approach to balance-of-payments adjustments suggests that all payments deficits are the result of:
a.
Too high interest rates in the home country
b.
Too low interest rates in the home country
c.
Excess money supply over money demand in the home country
d.
Excess money demand over money supply in the home country
ANSWER:
c
POINTS:
1
DIFFICULTY:
Moderate
QUESTION TYPE:
Multiple Choice
HAS VARIABLES:
False
NATIONAL STANDARDS:
United States – BUSPROG: Analytic Reflective Thi – BUSPROG: Reflective Thinking
United States – BUSPROG: Promotion – BUSPROG: Analytic
STATE STANDARDS:
United States – PA – DISC: International trade and fi – DISC: International trade and finance
TOPICS:
Monetary Adjustments
KEYWORDS:
BLOOM’S: Understand
DATE CREATED:
6/22/2016 3:25 PM
DATE MODIFIED:
6/22/2016 3:25 PM
19. The monetary approach to balance-of-payments adjustments suggests that all payments surpluses are the result of:
a.
Too high interest rates in the home country
b.
Too low interest rates in the home country
c.
Excess money supply over money demand in the home country
d.
Excess money demand over money supply in the home country
ANSWER:
d
POINTS:
1
DIFFICULTY:
Moderate
QUESTION TYPE:
Multiple Choice
HAS VARIABLES:
False
NATIONAL STANDARDS:
United States – BUSPROG: Analytic Reflective Thi – BUSPROG: Reflective Thinking
United States – BUSPROG: Promotion – BUSPROG: Analytic
STATE STANDARDS:
United States – PA – DISC: International trade and fi – DISC: International trade and finance
TOPICS:
Monetary Adjustments
KEYWORDS:
BLOOM’S: Understand
DATE CREATED:
6/22/2016 3:25 PM
DATE MODIFIED:
6/22/2016 3:25 PM
20. Starting from a position where the nation’s money demand equals the money supply, and its balance of payments is in
equilibrium, economic theory suggests that the nation’s balance of payments would move into a deficit position if there
Copyright Cengage Learning. Powered by Cognero.
Page 9
occurred in the nation a:
a.
Decrease in the money supply
b.
Increase in the money demand
c.
Decrease in the money demand
d.
None of the above
ANSWER:
c
POINTS:
1
DIFFICULTY:
Moderate
QUESTION TYPE:
Multiple Choice
HAS VARIABLES:
False
NATIONAL STANDARDS:
United States – BUSPROG: Analytic Reflective Thi – BUSPROG: Reflective Thinking
United States – BUSPROG: Promotion – BUSPROG: Analytic
STATE STANDARDS:
United States – PA – DISC: International trade and fi – DISC: International trade and finance
TOPICS:
Monetary Adjustments
KEYWORDS:
BLOOM’S: Understand
DATE CREATED:
6/22/2016 3:25 PM
DATE MODIFIED:
6/22/2016 3:25 PM
21. Which approach to balance-of-payments adjustment suggests that balance-of-payments surpluses are the result of
excess money demand in the home country?
a.
Absorption approach
b.
Elasticities approach
c.
Monetary approach
d.
Purchasing-power-parity approach
ANSWER:
c
POINTS:
1
DIFFICULTY:
Moderate
QUESTION TYPE:
Multiple Choice
HAS VARIABLES:
False
NATIONAL STANDARDS:
United States – BUSPROG: Analytic Reflective Thi – BUSPROG: Reflective Thinking
United States – BUSPROG: Promotion – BUSPROG: Analytic
STATE STANDARDS:
United States – PA – DISC: International trade and fi – DISC: International trade and finance
TOPICS:
Monetary Adjustments
KEYWORDS:
BLOOM’S: Understand
DATE CREATED:
6/22/2016 3:25 PM
DATE MODIFIED:
6/22/2016 3:25 PM
22. According to the “rules of the game” of the gold standard era, a country’s central bank agreed to react to international
gold flows so as to:
a.
Officially devalue a currency during eras of payments surpluses
b.
Officially revalue a currency during eras of payments deficits
c.
Offset the automatic-adjustment mechanism (e.g., prices)
d.
Reinforce the automatic-adjustment mechanism
ANSWER:
d
POINTS:
1
DIFFICULTY:
Moderate
Copyright Cengage Learning. Powered by Cognero.
Page 10
QUESTION TYPE:
Multiple Choice
HAS VARIABLES:
False
NATIONAL STANDARDS:
United States – BUSPROG: Analytic Reflective Thi – BUSPROG: Reflective Thinking
United States – BUSPROG: Promotion – BUSPROG: Analytic
STATE STANDARDS:
United States – PA – DISC: International trade and fi – DISC: International trade and finance
TOPICS:
Price Adjustments
KEYWORDS:
BLOOM’S: Understand
DATE CREATED:
6/22/2016 3:25 PM
DATE MODIFIED:
6/22/2016 3:25 PM
23. According to the quantity theory of money, a change in the domestic money supply will bring about:
a.
Inverse and proportionate changes in the price level
b.
Inverse and less-than-proportionate changes in the price level
c.
Direct and proportionate changes in the price level
d.
Direct and less-than-proportionate changes in the price level
ANSWER:
c
POINTS:
1
DIFFICULTY:
Moderate
QUESTION TYPE:
Multiple Choice
HAS VARIABLES:
False
NATIONAL STANDARDS:
United States – BUSPROG: Analytic Reflective Thi – BUSPROG: Reflective Thinking
United States – BUSPROG: Promotion – BUSPROG: Analytic
STATE STANDARDS:
United States – PA – DISC: International trade and fi – DISC: International trade and finance
TOPICS:
Price Adjustments
KEYWORDS:
BLOOM’S: Understand
DATE CREATED:
6/22/2016 3:25 PM
DATE MODIFIED:
6/22/2016 3:25 PM
24. The formulation of the so–called income adjustment mechanism is associated with:
a.
Adam Smith
b.
David Ricardo
c.
David Hume
d.
John Maynard Keynes
ANSWER:
d
POINTS:
1
DIFFICULTY:
Moderate
QUESTION TYPE:
Multiple Choice
HAS VARIABLES:
False
NATIONAL STANDARDS:
United States – BUSPROG: Analytic Reflective Thi – BUSPROG: Reflective Thinking
United States – BUSPROG: Promotion – BUSPROG: Analytic
STATE STANDARDS:
United States – PA – DISC: International trade and fi – DISC: International trade and finance
TOPICS:
Income Adjustments
KEYWORDS:
BLOOM’S: Remember
DATE CREATED:
6/22/2016 3:25 PM
DATE MODIFIED:
6/22/2016 3:25 PM
Copyright Cengage Learning. Powered by Cognero.
Page 11
25. The value of the foreign trade multiplier equals the reciprocal of the sum of the marginal propensities to:
a.
Save plus import
b.
Import plus invest
c.
Consume plus export
d.
Save plus import
ANSWER:
a
POINTS:
1
DIFFICULTY:
Moderate
QUESTION TYPE:
Multiple Choice
HAS VARIABLES:
False
NATIONAL STANDARDS:
United States – BUSPROG: Analytic Reflective Thi – BUSPROG: Reflective Thinking
United States – BUSPROG: Promotion – BUSPROG: Analytic
STATE STANDARDS:
United States – PA – DISC: International trade and fi – DISC: International trade and finance
TOPICS:
Income Adjustments
KEYWORDS:
BLOOM’S: Understand
DATE CREATED:
6/22/2016 3:25 PM
DATE MODIFIED:
6/22/2016 3:25 PM
26. Starting from a position where the nation’s money demand equals the money supply and its balance of payments is in
equilibrium, economic theory suggests that the nation’s balance of payments would move into a deficit position if there
occurred in the nation:
a.
An increase in the money supply
b.
A decrease in the money supply
c.
An increase in money demand
d.
None of the above
ANSWER:
a
POINTS:
1
DIFFICULTY:
Moderate
QUESTION TYPE:
Multiple Choice
HAS VARIABLES:
False
NATIONAL STANDARDS:
United States – BUSPROG: Analytic Reflective Thi – BUSPROG: Reflective Thinking
United States – BUSPROG: Promotion – BUSPROG: Analytic
STATE STANDARDS:
United States – PA – DISC: International trade and fi – DISC: International trade and finance
TOPICS:
Monetary Adjustments
KEYWORDS:
BLOOM’S: Understand
DATE CREATED:
6/22/2016 3:25 PM
DATE MODIFIED:
6/22/2016 3:25 PM
27. Starting from a position where the nation’s money demand equals the money supply and its balance of payments is in
equilibrium, economic theory suggests that the nation’s balance of payments would move into a surplus position if there
occurred in the nation:
a.
A decrease in the money supply
b.
An increase in the money supply
c.
A decrease in the money demand
d.
None of the above
ANSWER:
a

Copyright Cengage Learning. Powered by Cognero.
Page 12
POINTS:
1
DIFFICULTY:
Moderate
QUESTION TYPE:
Multiple Choice
HAS VARIABLES:
False
NATIONAL STANDARDS:
United States – BUSPROG: Analytic Reflective Thi – BUSPROG: Reflective Thinking
United States – BUSPROG: Promotion – BUSPROG: Analytic
STATE STANDARDS:
United States – PA – DISC: International trade and fi – DISC: International trade and finance
TOPICS:
Monetary Adjustments
KEYWORDS:
BLOOM’S: Understand
DATE CREATED:
6/22/2016 3:25 PM
DATE MODIFIED:
6/22/2016 3:25 PM
28. Starting from a position where the nation’s money demand equals the money supply and its balance of payments is in
equilibrium, economic theory suggests that the nation’s balance of payments would move into a surplus position if there
occurred in the nation:
a.
An increase in the money demand
b.
A decrease in the money demand
c.
An increase in the money supply
d.
None of the above
ANSWER:
a
POINTS:
1
DIFFICULTY:
Moderate
QUESTION TYPE:
Multiple Choice
HAS VARIABLES:
False
NATIONAL STANDARDS:
United States – BUSPROG: Analytic Reflective Thi – BUSPROG: Reflective Thinking
United States – BUSPROG: Promotion – BUSPROG: Analytic
STATE STANDARDS:
United States – PA – DISC: International trade and fi – DISC: International trade and finance
TOPICS:
Monetary Adjustments
KEYWORDS:
BLOOM’S: Understand
DATE CREATED:
6/22/2016 3:25 PM
DATE MODIFIED:
6/22/2016 3:25 PM
29. Assume identical interest rates on comparable securities in the United States and foreign countries. Suppose investors
anticipate that in the future the U.S. dollar will depreciate against foreign currencies. Investment funds would tend to:
a.
Flow from the United States to foreign countries
b.
Flow from foreign countries to the United States
c.
Remain totally in foreign countries
d.
Remain totally in the United States
ANSWER:
a
POINTS:
1
DIFFICULTY:
Challenging
QUESTION TYPE:
Multiple Choice
HAS VARIABLES:
False
NATIONAL STANDARDS:
United States – BUSPROG: Analytic Reflective Thi – BUSPROG: Reflective Thinking
United States – BUSPROG: Promotion – BUSPROG: Analytic
STATE STANDARDS:
United States – PA – DISC: International trade and fi – DISC: International trade and finance
Copyright Cengage Learning. Powered by Cognero.
Page 13
TOPICS:
Financial Flows and Interest-Rate Differentials
KEYWORDS:
BLOOM’S: Understand
DATE CREATED:
6/22/2016 3:25 PM
DATE MODIFIED:
6/22/2016 3:25 PM
30. Suppose that rising U.S. income leads to higher sales and profits in the United States. This would likely result in:
a.
Increasing portfolio investment into the United States
b.
Decreasing portfolio investment into the United States
c.
Increasing direct investment into the United States
d.
Decreasing direct investment into the United States
ANSWER:
c
POINTS:
1
DIFFICULTY:
Moderate
QUESTION TYPE:
Multiple Choice
HAS VARIABLES:
False
NATIONAL STANDARDS:
United States – BUSPROG: Analytic Reflective Thi – BUSPROG: Reflective Thinking
United States – BUSPROG: Promotion – BUSPROG: Analytic
STATE STANDARDS:
United States – PA – DISC: International trade and fi – DISC: International trade and finance
TOPICS:
Income Adjustments
KEYWORDS:
BLOOM’S: Understand
DATE CREATED:
6/22/2016 3:25 PM
DATE MODIFIED:
6/22/2016 3:25 PM
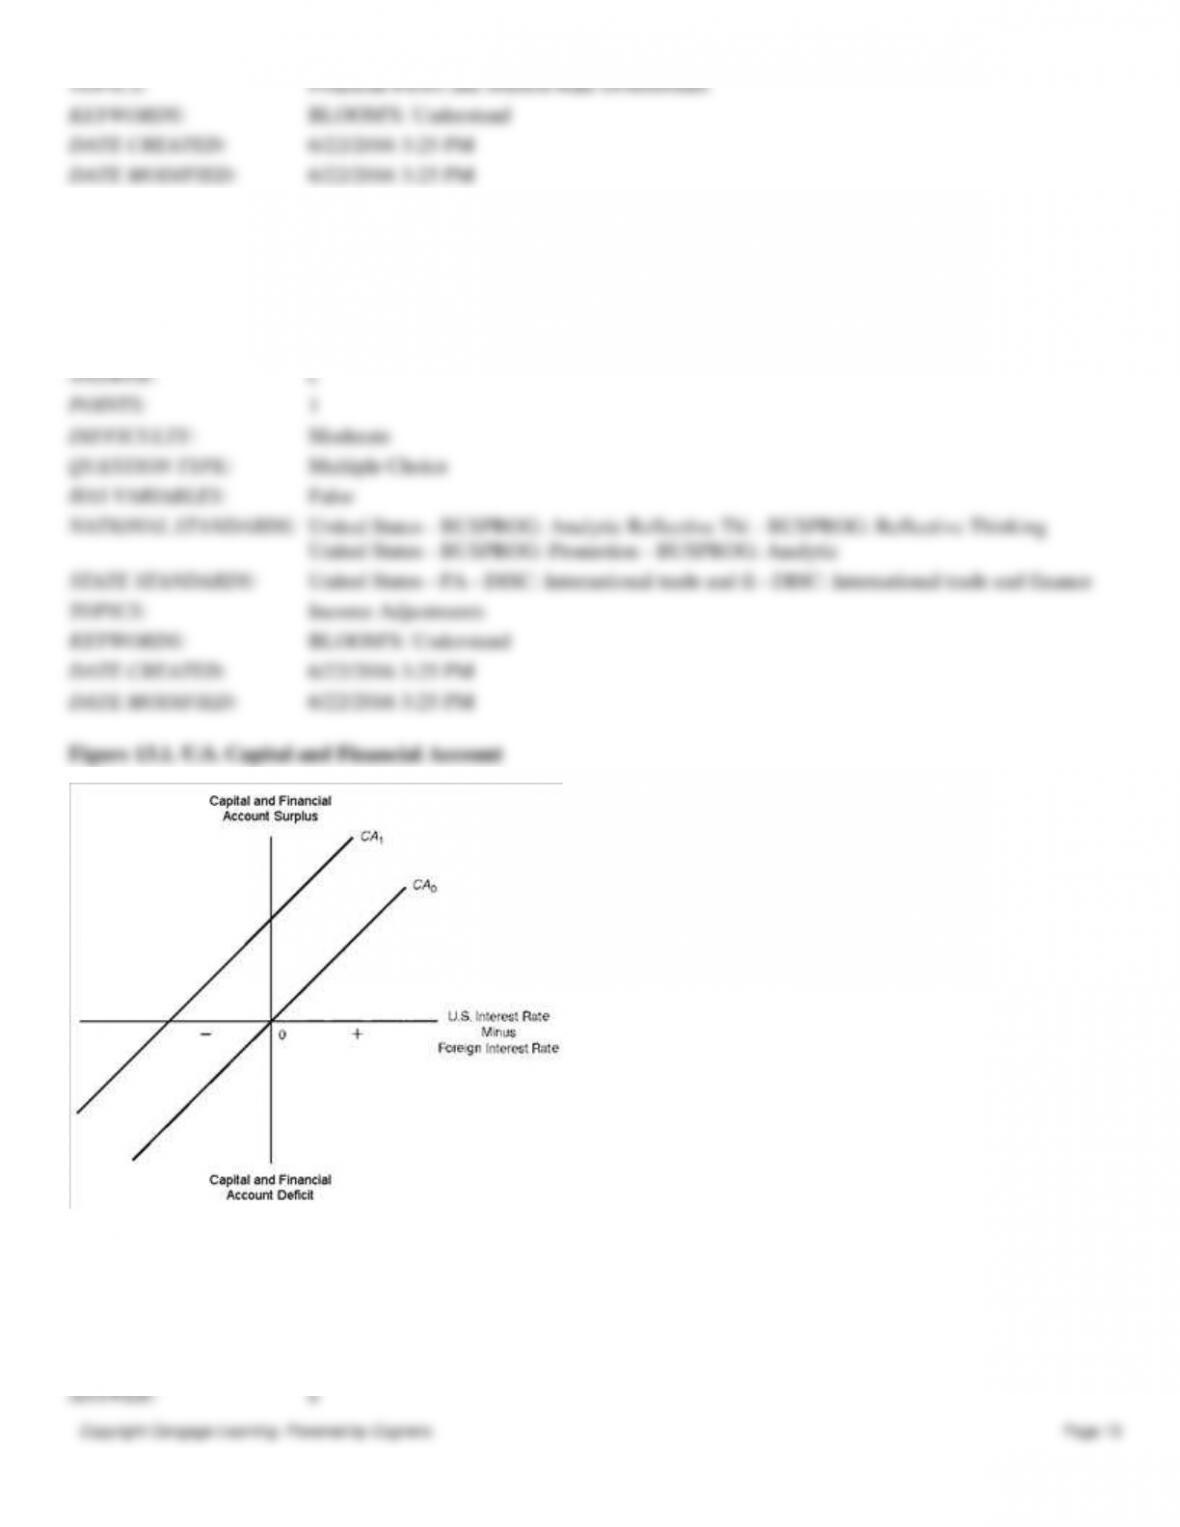
31. Refer to Figure 13.1. Upward movements along U.S. capital and financial account schedule CA0 would be caused by:
a.
U.S. interest rates rising relative to foreign interest rates
b.
U.S. interest rates falling relative to foreign interest rates
c.
Taxes placed on income earned by U.S. residents from their foreign investments
d.
Taxes placed on income earned by foreign residents from their U.S. investments
ANSWER:
a
Copyright Cengage Learning. Powered by Cognero.
Page 14
POINTS:
1
DIFFICULTY:
Challenging
QUESTION TYPE:
Multiple Choice
HAS VARIABLES:
False
PREFACE NAME:
Figure 13.1
NATIONAL STANDARDS:
United States – BUSPROG: Promotion – BUSPROG: Analytic
STATE STANDARDS:
United States – PA – DISC: Reading and interpreting g – DISC: Reading and interpreting
graphs
TOPICS:
Financial Flows and Interest-Rate Differentials
KEYWORDS:
BLOOM’S: Analyze
DATE CREATED:
6/22/2016 3:25 PM
DATE MODIFIED:
6/22/2016 3:25 PM
32. Refer to Figure 13.1. Downward movements along U.S. capital and financial account schedule CA0 would be caused
by:
a.
U.S. interest rates rising relative to foreign interest rates
b.
U.S. interest rates falling relative to foreign interest rates
c.
Taxes placed on income earned by U.S. residents from their foreign investments
d.
Taxes placed on income earned by foreign residents from their U.S. investments
ANSWER:
b
POINTS:
1
DIFFICULTY:
Challenging
QUESTION TYPE:
Multiple Choice
HAS VARIABLES:
False
PREFACE NAME:
Figure 13.1
NATIONAL STANDARDS:
United States – BUSPROG: Promotion – BUSPROG: Analytic
STATE STANDARDS:
United States – PA – DISC: Reading and interpreting g – DISC: Reading and interpreting
graphs
TOPICS:
Financial Flows and Interest-Rate Differentials
KEYWORDS:
BLOOM’S: Analyze
DATE CREATED:
6/22/2016 3:25 PM
DATE MODIFIED:
6/22/2016 3:25 PM
33. Refer to Figure 13.1. The U.S. capital and financial account schedule would shift upward from CA0 to CA1 if:
a.
U.S. interest rates exceeded foreign interest rates
b.
Foreign interest rates exceeded U.S. interest rates
c.
Taxes were placed on income earned by U.S. residents from their foreign investments
d.
Taxes were placed on income earned by foreign residents from their U.S. investments
ANSWER:
c
POINTS:
1
DIFFICULTY:
Challenging
QUESTION TYPE:
Multiple Choice
HAS VARIABLES:
False
PREFACE NAME:
Figure 13.1
NATIONAL STANDARDS:
United States – BUSPROG: Analytic Reflective Thi – BUSPROG: Reflective Thinking
Copyright Cengage Learning. Powered by Cognero.
Page 15
United States – BUSPROG: Promotion – BUSPROG: Analytic
STATE STANDARDS:
United States – PA – DISC: Reading & Interpreting Gra – DISC: Reading & interpreting
graphs
TOPICS:
Financial Flows and Interest-Rate Differentials
KEYWORDS:
BLOOM’S: Analyze
DATE CREATED:
6/22/2016 3:25 PM
DATE MODIFIED:
6/22/2016 3:25 PM
34. Refer to Figure 13.1. The U.S. capital and financial account schedule would shift upward from CA0 to CA1 if:
a.
U.S. residents receive subsidies to invest in foreign nations
b.
U.S. interest rates rise relative to foreign interest rates
c.
Taxes are reduced on income earned by U.S. residents from their foreign investments
d.
Expected profits decline on U.S. investments in foreign manufacturing
ANSWER:
d
POINTS:
1
DIFFICULTY:
Challenging
QUESTION TYPE:
Multiple Choice
HAS VARIABLES:
False
PREFACE NAME:
Figure 13.1
NATIONAL STANDARDS:
United States – BUSPROG: Promotion – BUSPROG: Analytic
STATE STANDARDS:
United States – PA – DISC: Reading and interpreting g – DISC: Reading and interpreting
graphs
TOPICS:
Financial Flows and Interest-Rate Differentials
KEYWORDS:
BLOOM’S: Analyze
DATE CREATED:
6/22/2016 3:25 PM
DATE MODIFIED:
6/22/2016 3:25 PM
35. Refer to Figure 13.1. The U.S. capital and financial account schedule would shift upward from CA0 to CA1 if:
a.
U.S. political stability improves relative to foreign political stability
b.
U.S. interest rates rise relative to foreign interest rates
c.
Taxes are placed on income earned by U.S. residents from foreign investments
d.
Restrictions are imposed on international loans granted by foreign banks
ANSWER:
a
POINTS:
1
DIFFICULTY:
Challenging
QUESTION TYPE:
Multiple Choice
HAS VARIABLES:
False
PREFACE NAME:
Figure 13.1
NATIONAL STANDARDS:
United States – BUSPROG: Analytic Reflective Thi – BUSPROG: Reflective Thinking
United States – BUSPROG: Promotion – BUSPROG: Analytic
STATE STANDARDS:
United States – PA – DISC: Reading and interpreting g – DISC: Reading and interpreting
graphs
TOPICS:
Financial Flows and Interest-Rate Differentials
KEYWORDS:
BLOOM’S: Analyze
DATE CREATED:
6/22/2016 3:25 PM
Copyright Cengage Learning. Powered by Cognero.
Page 16
DATE MODIFIED:
6/22/2016 3:25 PM
36. Refer to Figure 13.1. U.S. capital and financial account schedule CA0 would shift upwards, or downwards, for all of
the following reasons except:
a.
U.S. residents being taxed on income earned from foreign investments
b.
U.S. banks being restricted on loans that can be made abroad
c.
U.S. political stability changing relative to foreign political stability
d.
U.S. interest rates changing relative to foreign interest rates
ANSWER:
d
POINTS:
1
DIFFICULTY:
Challenging
QUESTION TYPE:
Multiple Choice
HAS VARIABLES:
False
PREFACE NAME:
Figure 13.1
NATIONAL STANDARDS:
United States – BUSPROG: Analytic Reflective Thi – BUSPROG: Reflective Thinking
United States – BUSPROG: Promotion – BUSPROG: Analytic
STATE STANDARDS:
United States – PA – DISC: Reading and interpreting g – DISC: Reading and interpreting
graphs
TOPICS:
Financial Flows and Interest-Rate Differentials
KEYWORDS:
BLOOM’S: Analyze
DATE CREATED:
6/22/2016 3:25 PM
DATE MODIFIED:
6/22/2016 3:25 PM
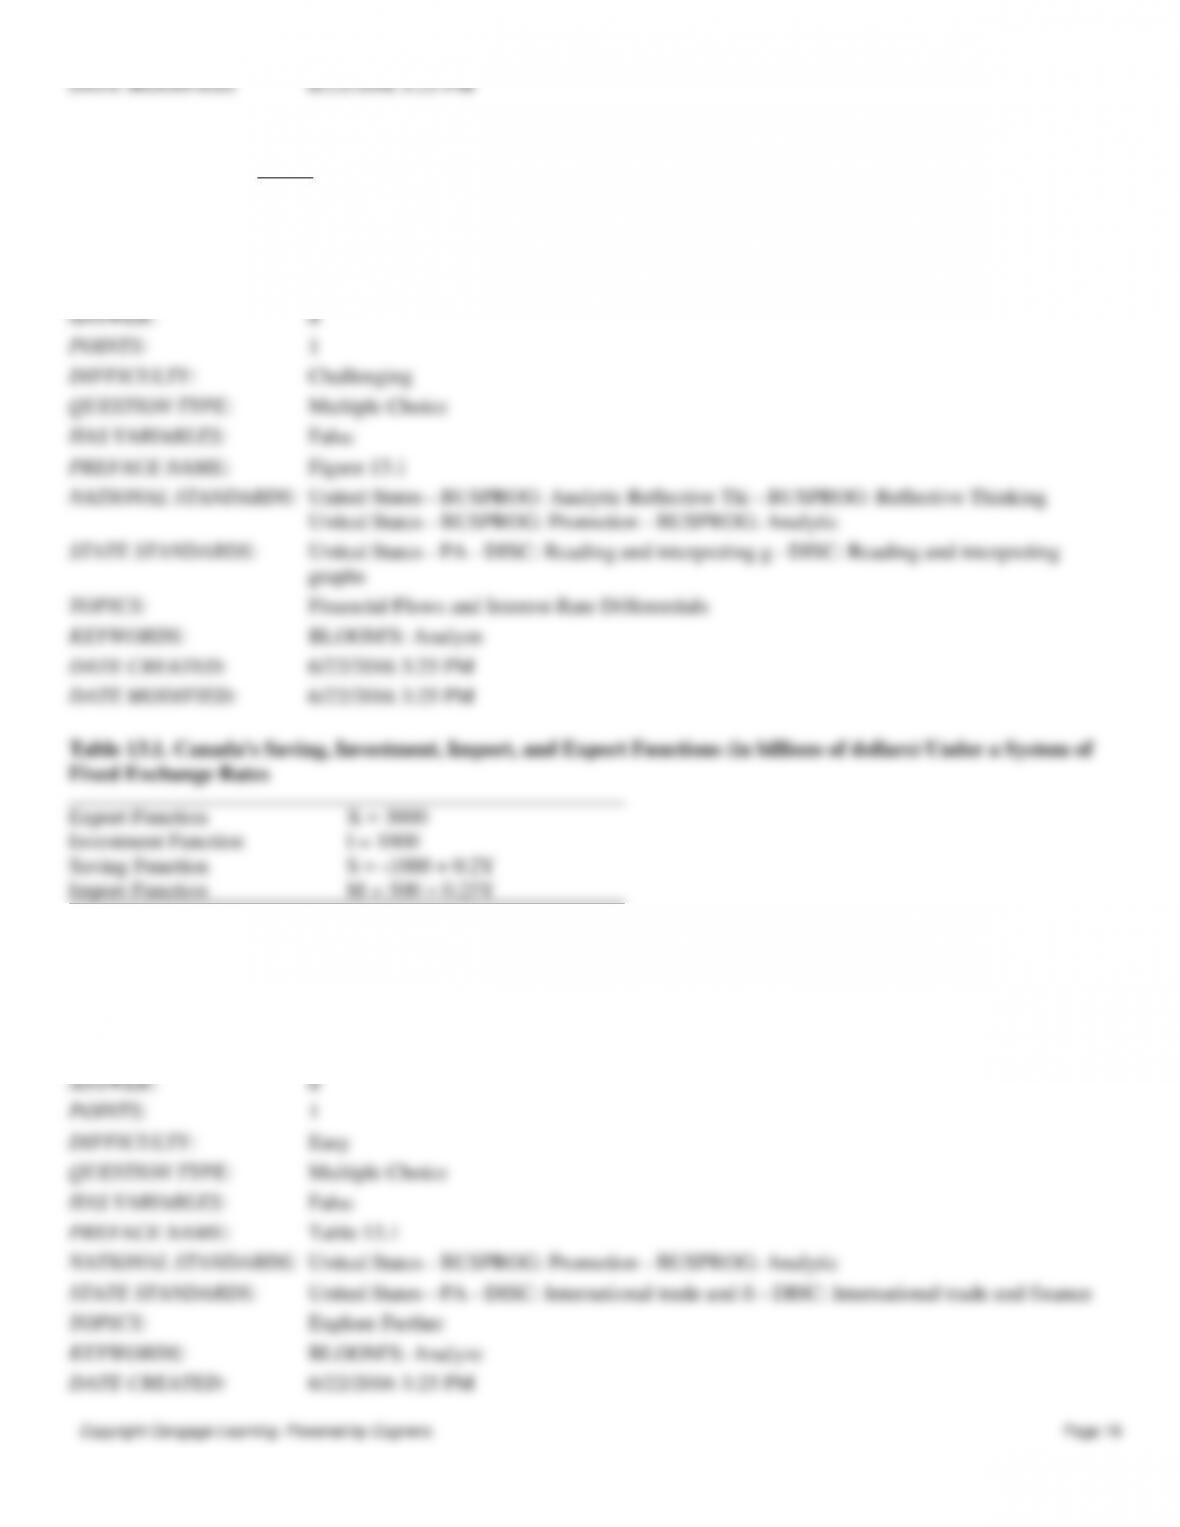
Export Function
X = 3000
Investment Function
I = 1000
Saving Function
S = -1000 + 0.2Y
Import Function
M = 500 + 0.25Y
a.
$10 billion
b.
$20 billion
c.
$30 billion
d.
$40 billion
ANSWER:
d
POINTS:
1
DIFFICULTY:
Easy
QUESTION TYPE:
Multiple Choice
HAS VARIABLES:
False
PREFACE NAME:
Table 13.1
NATIONAL STANDARDS:
United States – BUSPROG: Promotion – BUSPROG: Analytic
STATE STANDARDS:
United States – PA – DISC: International trade and fi – DISC: International trade and finance
KEYWORDS:
BLOOM’S: Analyze
DATE CREATED:
6/22/2016 3:25 PM
Copyright Cengage Learning. Powered by Cognero.
Page 17
DATE MODIFIED:
6/22/2016 3:25 PM
38. Referring to Table 13.1, if Canada’s income rises by $200 billion, imports would rise by:
a.
$50 billion
b.
$75 billion
c.
$100 billion
d.
$125 billion
ANSWER:
a
POINTS:
1
DIFFICULTY:
Moderate
QUESTION TYPE:
Multiple Choice
HAS VARIABLES:
False
PREFACE NAME:
Table 13.1
NATIONAL STANDARDS:
United States – BUSPROG: Promotion – BUSPROG: Analytic
STATE STANDARDS:
United States – PA – DISC: International trade and fi – DISC: International trade and finance
TOPICS:
Explore Further
KEYWORDS:
BLOOM’S: Analyze
DATE CREATED:
6/22/2016 3:25 PM
DATE MODIFIED:
6/22/2016 3:25 PM
39. Referring to Table 13.1, Canada’s foreign trade multiplier equals:
a.
1.75
b.
2.05
c.
2.22
d.
2.64
ANSWER:
c
POINTS:
1
DIFFICULTY:
Moderate
QUESTION TYPE:
Multiple Choice
HAS VARIABLES:
False
PREFACE NAME:
Table 13.1
NATIONAL STANDARDS:
United States – BUSPROG: Promotion – BUSPROG: Analytic
STATE STANDARDS:
United States – PA – DISC: International trade and fi – DISC: International trade and finance
TOPICS:
Explore Further
KEYWORDS:
BLOOM’S: Analyze
DATE CREATED:
6/22/2016 3:25 PM
DATE MODIFIED:
6/22/2016 3:25 PM
40. Referring to Table 13.1, Canada’s equilibrium level of income is:
a.
$8000 billion
b.
$9000 billion
c.
$10,000 billion
d.
$11,000 billion
ANSWER:
c
POINTS:
1
Copyright Cengage Learning. Powered by Cognero.
Page 18
DIFFICULTY:
Moderate
QUESTION TYPE:
Multiple Choice
HAS VARIABLES:
False
PREFACE NAME:
Table 13.1
NATIONAL STANDARDS:
United States – BUSPROG: Promotion – BUSPROG: Analytic
STATE STANDARDS:
United States – PA – DISC: International trade and fi – DISC: International trade and finance
TOPICS:
Explore Further
KEYWORDS:
BLOOM’S: Analyze
DATE CREATED:
6/22/2016 3:25 PM
DATE MODIFIED:
6/22/2016 3:25 PM
41. Refer to Table 13.1. If improved business optimism leads to increases in Canada’s planned investment spending from
$1000 billion to $1200 billion, Canada’s equilibrium income rises by approximately:
a.
$444 billion
b.
$555 billion
c.
$666 billion
d.
$777 billion
ANSWER:
a
POINTS:
1
DIFFICULTY:
Moderate
QUESTION TYPE:
Multiple Choice
HAS VARIABLES:
False
PREFACE NAME:
Table 13.1
NATIONAL STANDARDS:
United States – BUSPROG: Promotion – BUSPROG: Analytic
STATE STANDARDS:
United States – PA – DISC: International trade and fi – DISC: International trade and finance
TOPICS:
Explore Further
KEYWORDS:
BLOOM’S: Analyze
DATE CREATED:
6/22/2016 3:25 PM
DATE MODIFIED:
6/22/2016 3:25 PM
42. Refer to Table 13.1. If weak economic conditions abroad result in Canada’s exports falling from $3000 billion to
$2500 billion, Canada’s equilibrium income falls by approximately:
a.
$888 billion
b.
$990 billion
c.
$1110 billion
d.
$1220 billion
ANSWER:
c
POINTS:
1
DIFFICULTY:
Moderate
QUESTION TYPE:
Multiple Choice
HAS VARIABLES:
False
PREFACE NAME:
Table 13.1
NATIONAL STANDARDS:
United States – BUSPROG: Promotion – BUSPROG: Analytic
STATE STANDARDS:
United States – PA – DISC: International trade and fi – DISC: International trade and finance
TOPICS:
Explore Further
Copyright Cengage Learning. Powered by Cognero.
Page 19
KEYWORDS:
BLOOM’S: Analyze
DATE CREATED:
6/22/2016 3:25 PM
DATE MODIFIED:
6/22/2016 3:25 PM
STATE STANDARDS:
United States – PA – DISC: Reading and interpreting g – DISC: Reading and interpreting
graphs
TOPICS:
Explore Further
KEYWORDS:
BLOOM’S: Analyze
DATE CREATED:
6/22/2016 3:25 PM
DATE MODIFIED:
6/22/2016 3:25 PM
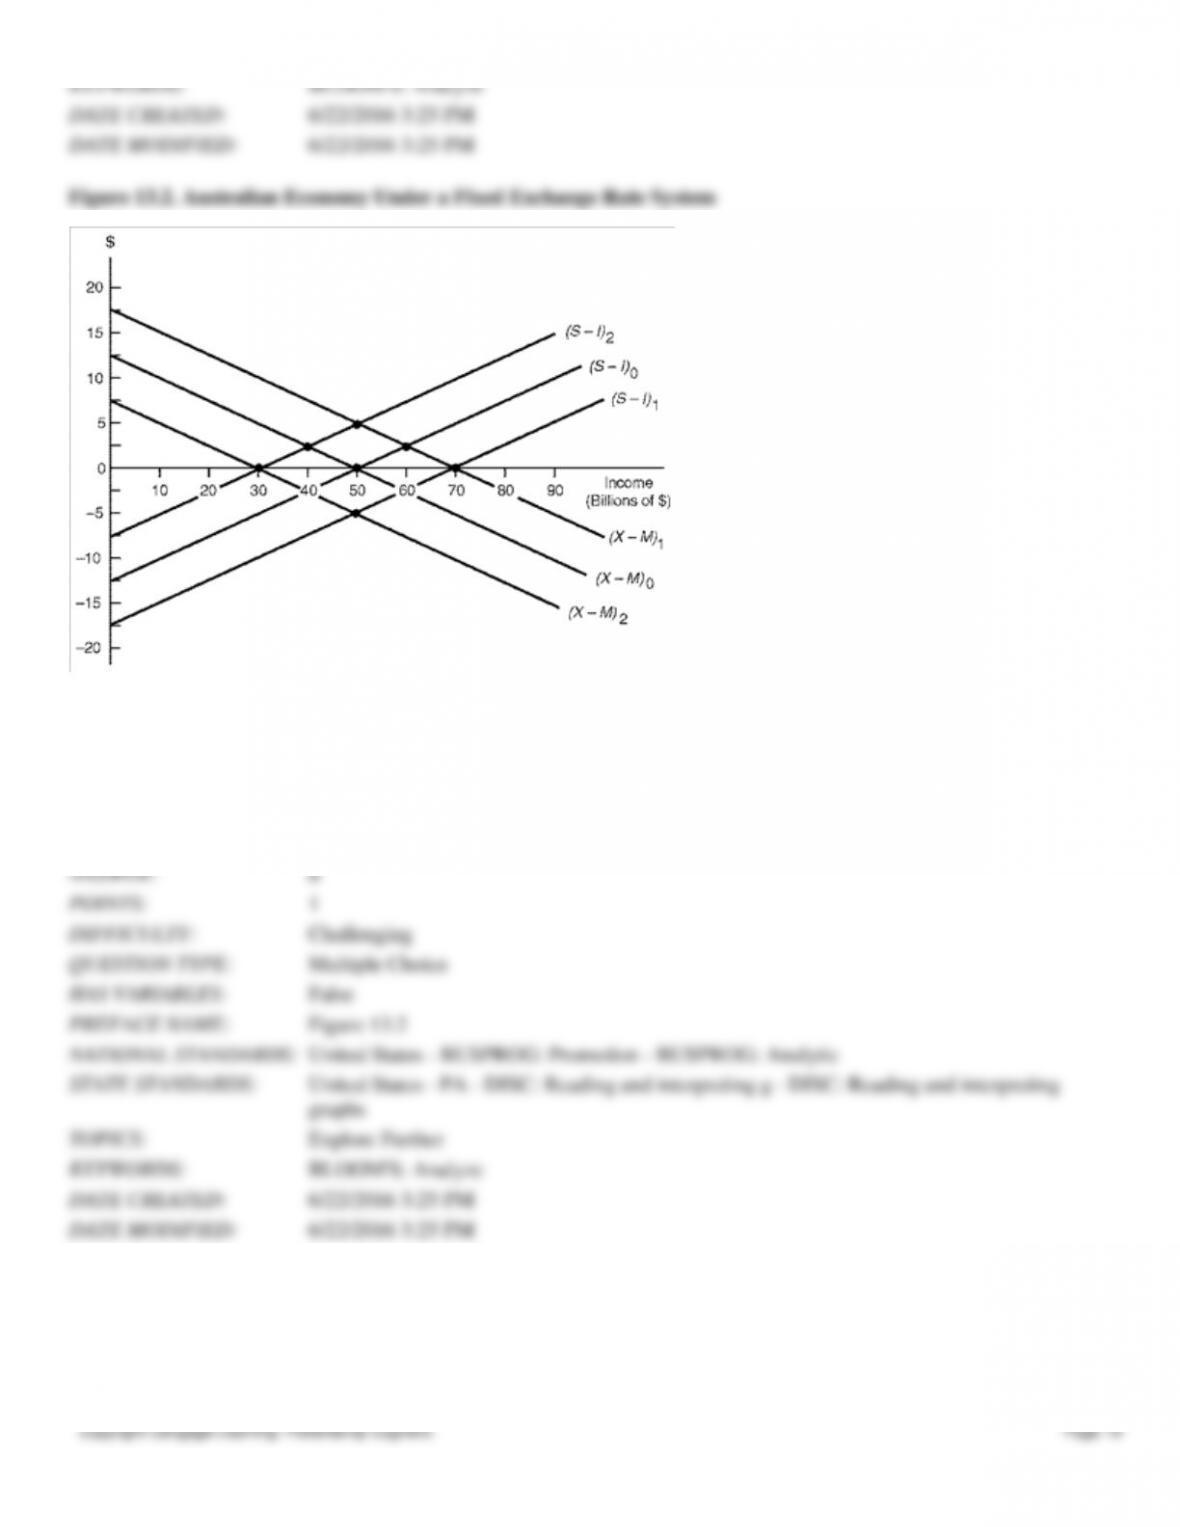
44. Refer to Figure 13.2. Starting at equilibrium income $50 billion, where (S–I)0 intersects (X–M)0, suppose that
improving economic conditions abroad lead to an autonomous increase in Australian exports of $5 billion. Australian
income thus ____ which leads to Australia’s trade account moving to a ____.
a.
Rises to $60 billion, surplus of $2.5 billion
b.
Rises to $60 billion, surplus of $5 billion
a.
b.
c.
d.
ANSWER:
POINTS:
DIFFICULTY:
QUESTION TYPE:
Multiple Choice
HAS VARIABLES:
PREFACE NAME:
Figure 13.2
NATIONAL STANDARDS:
United States – BUSPROG: Promotion – BUSPROG: Analytic
Copyright Cengage Learning. Powered by Cognero.
Page 20
c.
Falls to $40 billion, deficit of $2.5 billion
d.
Falls to $40 billion, deficit of $5 billion
ANSWER:
a
POINTS:
1
DIFFICULTY:
Challenging
QUESTION TYPE:
Multiple Choice
HAS VARIABLES:
False
PREFACE NAME:
Figure 13.2
NATIONAL STANDARDS:
United States – BUSPROG: Promotion – BUSPROG: Analytic
STATE STANDARDS:
United States – PA – DISC: Reading and interpreting g – DISC: Reading and interpreting
graphs
TOPICS:
Explore Further
KEYWORDS:
BLOOM’S: Analyze
DATE CREATED:
6/22/2016 3:25 PM
DATE MODIFIED:
6/22/2016 3:25 PM
45. Refer to Figure 13.2. Starting at equilibrium income $50 billion, where (S– I)0 intersects (X–M)0, suppose that
worsening economic conditions abroad lead to an autonomous decrease in Australian exports of $5 billion. Australian
income thus ____ which leads to Australia’s trade account moving to a ____.
a.
Rises to $60 billion, surplus of $2.5 billion
b.
Rises to $60 billion, surplus of $5 billion
c.
Falls to $40 billion, deficit of $2.5 billion
d.
Falls to $40 billion, deficit of $5 billion
ANSWER:
c
POINTS:
1
DIFFICULTY:
Challenging
QUESTION TYPE:
Multiple Choice
HAS VARIABLES:
False
PREFACE NAME:
Figure 13.2
NATIONAL STANDARDS:
United States – BUSPROG: Promotion – BUSPROG: Analytic
STATE STANDARDS:
United States – PA – DISC: Reading and interpreting g – DISC: Reading and interpreting
graphs
TOPICS:
Explore Further
KEYWORDS:
BLOOM’S: Analyze
DATE CREATED:
6/22/2016 3:25 PM
DATE MODIFIED:
6/22/2016 3:25 PM
46. Refer to Figure 13.2. Starting at equilibrium income $50 billion, where (S–I)0 intersects (X–M)0, suppose that
improving profit expectations lead to an autonomous increase in Australian investment of $5 billion. Australian income
thus ____ which leads to Australia’s trade account moving to a ____.
a.
Rises to $60 billion, deficit of $2.5 billion
b.
Rises to $60 billion, deficit of $5 billion
c.
Falls to $40 billion, surplus of $2.5 billion
d.
Falls to $40 billion, surplus of $5 billion
ANSWER:
a
POINTS:
1