Copyright Cengage Learning. Powered by Cognero.
Page 21
DIFFICULTY:
Challenging
QUESTION TYPE:
Multiple Choice
HAS VARIABLES:
False
PREFACE NAME:
Figure 13.2
NATIONAL STANDARDS:
United States – BUSPROG: Analytic Reflective Thi – BUSPROG: Reflective Thinking
United States – BUSPROG: Promotion – BUSPROG: Analytic
STATE STANDARDS:
United States – PA – DISC: Reading and interpreting g – DISC: Reading and interpreting
graphs
TOPICS:
Explore Further
KEYWORDS:
BLOOM’S: Analyze
DATE CREATED:
6/22/2016 3:25 PM
DATE MODIFIED:
6/22/2016 3:25 PM
47. Refer to Figure 13.2. Starting at equilibrium income $50 billion, where (S–I)0 intersects (X–M)0, suppose that
worsening profit expectations lead to an autonomous decrease in Australian investment of $5 billion. Australian income
thus ____ which leads to Australia’s trade account moving to a ____.
a.
Rises to $60 billion, deficit of $2.5 billion
b.
Rises to $60 billion, deficit of $5 billion
c.
Falls to $40 billion, surplus of $2.5 billion
d.
Falls to $40 billion, surplus of $5 billion
ANSWER:
c
POINTS:
1
DIFFICULTY:
Challenging
QUESTION TYPE:
Multiple Choice
HAS VARIABLES:
False
PREFACE NAME:
Figure 13.2
NATIONAL STANDARDS:
United States – BUSPROG: Promotion – BUSPROG: Analytic
STATE STANDARDS:
United States – PA – DISC: Reading and interpreting g – DISC: Reading and interpreting
graphs
TOPICS:
Explore Further
KEYWORDS:
BLOOM’S: Analyze
DATE CREATED:
6/22/2016 3:25 PM
DATE MODIFIED:
6/22/2016 3:25 PM
48. Refer to Figure 13.2. Starting at equilibrium income $50 billion, where (S–I)0 intersects (X–M)0, suppose that
increased thriftiness leads to an autonomous increase in Australian saving of $5 billion. Australian income thus ____
which leads to Australia’s trade account moving to a ____.
a.
Rises to $60 billion, deficit of $2.5 billion
b.
Rises to $60 billion, deficit of $5 billion
c.
Falls to $40 billion, surplus of $2.5 billion
d.
Falls to $40 billion, surplus of $5 billion
ANSWER:
c
POINTS:
1
DIFFICULTY:
Challenging
QUESTION TYPE:
Multiple Choice
HAS VARIABLES:
False
Copyright Cengage Learning. Powered by Cognero.
Page 22
PREFACE NAME:
Figure 13.2
NATIONAL STANDARDS:
United States – BUSPROG: Promotion – BUSPROG: Analytic
STATE STANDARDS:
United States – PA – DISC: Reading and interpreting g – DISC: Reading and interpreting
graphs
TOPICS:
Explore Further
KEYWORDS:
BLOOM’S: Analyze
DATE CREATED:
6/22/2016 3:25 PM
DATE MODIFIED:
6/22/2016 3:25 PM
49. Refer to Figure 13.2. Starting at equilibrium income $50 billion, where (S–I)0 intersects (X–M)0, suppose that
dwindling thriftiness leads to an autonomous decrease in Australian saving to $5 billion. Australian income thus ____
which leads to Australia’s trade account moving to a ____.
a.
Rises to $60 billion, deficit of $2.5 billion
b.
Rises to $60 billion, deficit of $5 billion
c.
Falls to $40 billion, surplus of $2.5 billion
d.
Falls to $40 billion, surplus of $5 billion
ANSWER:
a
POINTS:
1
DIFFICULTY:
Challenging
QUESTION TYPE:
Multiple Choice
HAS VARIABLES:
False
PREFACE NAME:
Figure 13.2
NATIONAL STANDARDS:
United States – BUSPROG: Promotion – BUSPROG: Analytic
STATE STANDARDS:
United States – PA – DISC: Reading and interpreting g – DISC: Reading and interpreting
graphs
TOPICS:
Explore Further
KEYWORDS:
BLOOM’S: Analyze
DATE CREATED:
6/22/2016 3:25 PM
DATE MODIFIED:
6/22/2016 3:25 PM
50. Refer to Figure 13.2. Starting at equilibrium income $50 billion, where (S–I)0 intersects (X–M)0, suppose that
changing preferences lead to an autonomous increase in Australian imports of $5 billion. Australian income thus ____
which leads to Australia’s trade account moving to a ____.
a.
Rises to $60 billion, surplus of $2.5 billion
b.
Rises to $60 billion, surplus of $5 billion
c.
Falls to $40 billion, deficit of $2.5 billion
d.
Falls to $40 billion, deficit of $5 billion
ANSWER:
c
POINTS:
1
DIFFICULTY:
Challenging
QUESTION TYPE:
Multiple Choice
HAS VARIABLES:
False
PREFACE NAME:
Figure 13.2
NATIONAL STANDARDS:
United States – BUSPROG: Promotion – BUSPROG: Analytic
STATE STANDARDS:
United States – PA – DISC: Reading and interpreting g – DISC: Reading and interpreting
graphs
Copyright Cengage Learning. Powered by Cognero.
Page 23
TOPICS:
Explore Further
KEYWORDS:
BLOOM’S: Analyze
DATE CREATED:
6/22/2016 3:25 PM
DATE MODIFIED:
6/22/2016 3:25 PM
51. Refer to Figure 13.2. Starting at equilibrium income $50 billion, where (S–I)0 intersects (X–M)0, suppose that
changing preferences lead to an autonomous decrease in Australian imports of $5 billion. Australian income thus ____
which leads to Australia’s trade account moving to a ____.
a.
Rises to $60 billion, surplus of $2.5 billion
b.
Rises to $60 billion, surplus of $5 billion
c.
Falls to $40 billion, deficit of $2.5 billion
d.
Falls to $40 billion, deficit of $5 billion
ANSWER:
a
POINTS:
1
DIFFICULTY:
Challenging
QUESTION TYPE:
Multiple Choice
HAS VARIABLES:
False
PREFACE NAME:
Figure 13.2
NATIONAL STANDARDS:
United States – BUSPROG: Promotion – BUSPROG: Analytic
STATE STANDARDS:
United States – PA – DISC: Reading and interpreting g – DISC: Reading and interpreting
graphs
TOPICS:
Explore Further
KEYWORDS:
BLOOM’S: Analyze
DATE CREATED:
6/22/2016 3:25 PM
DATE MODIFIED:
6/22/2016 3:25 PM
52. In explaining balance-of-payments adjustments, the classical economists
a.
Focused on interest rates exclusively
b.
Remained aware of the role of interest rates
c.
Only focused their attention on short-term interest rates
d.
Paid exclusive attention to long-tem interest rates
ANSWER:
b
POINTS:
1
DIFFICULTY:
Moderate
QUESTION TYPE:
Multiple Choice
HAS VARIABLES:
False
NATIONAL STANDARDS:
United States – BUSPROG: Analytic Reflective Thi – BUSPROG: Reflective Thinking
United States – BUSPROG: Promotion – BUSPROG: Analytic
STATE STANDARDS:
United States – PA – DISC: International trade and fi – DISC: International trade and finance
TOPICS:
Income Adjustments
KEYWORDS:
BLOOM’S: Understand
DATE CREATED:
6/22/2016 3:25 PM
DATE MODIFIED:
6/22/2016 3:25 PM
53. J. M. Keynes suggested that a trade deficit nation
a.
Would experience a fall in income
Copyright Cengage Learning. Powered by Cognero.
Page 24
b.
Would experience a decline in imports
c.
Would require active intervention by the government
d.
Both a and b
ANSWER:
a
POINTS:
1
DIFFICULTY:
Moderate
QUESTION TYPE:
Multiple Choice
HAS VARIABLES:
False
NATIONAL STANDARDS:
United States – BUSPROG: Analytic Reflective Thi – BUSPROG: Reflective Thinking
United States – BUSPROG: Promotion – BUSPROG: Analytic
STATE STANDARDS:
United States – PA – DISC: International trade and fi – DISC: International trade and finance
TOPICS:
Income Adjustments
KEYWORDS:
BLOOM’S: Understand
DATE CREATED:
6/22/2016 3:25 PM
DATE MODIFIED:
6/22/2016 3:25 PM
54. The classical gold standard
a.
Existed from early 1800’s to early 1900’s
b.
Did not allow for imports and exports of gold
c.
Led to the outflow of gold from surplus nations
d.
Led to the inflow of gold to deficit nations
ANSWER:
a
POINTS:
1
DIFFICULTY:
Easy
QUESTION TYPE:
Multiple Choice
HAS VARIABLES:
False
NATIONAL STANDARDS:
United States – BUSPROG: Analytic Reflective Thi – BUSPROG: Reflective Thinking
United States – BUSPROG: Promotion – BUSPROG: Analytic
STATE STANDARDS:
United States – PA – DISC: International trade and fi – DISC: International trade and finance
TOPICS:
Price Adjustments
KEYWORDS:
BLOOM’S: Remember
DATE CREATED:
6/22/2016 3:25 PM
DATE MODIFIED:
6/22/2016 3:25 PM
55. The classical economists assumed
a.
That the volume of final output is fixed at the full-employment level in the long-run
b.
The velocity of money is constant
c.
The velocity of money depends on physical, structural, and institutional factors
d.
All of the above
ANSWER:
d
POINTS:
1
DIFFICULTY:
Moderate
QUESTION TYPE:
Multiple Choice
HAS VARIABLES:
False
NATIONAL STANDARDS:
United States – BUSPROG: Analytic Reflective Thi – BUSPROG: Reflective Thinking
United States – BUSPROG: Promotion – BUSPROG: Analytic
Copyright Cengage Learning. Powered by Cognero.
Page 25
STATE STANDARDS:
United States – PA – DISC: International trade and fi – DISC: International trade and finance
TOPICS:
Income Adjustments
KEYWORDS:
BLOOM’S: Understand
DATE CREATED:
6/22/2016 3:25 PM
DATE MODIFIED:
6/22/2016 3:25 PM
56. Under a fixed exchange rate system, adjustment mechanisms work for the automatic return to current-account balance
after the initial balance has been disrupted.
a.
True
b.
False
ANSWER:
True
POINTS:
1
DIFFICULTY:
Easy
QUESTION TYPE:
True / False
HAS VARIABLES:
False
NATIONAL STANDARDS:
United States – BUSPROG: Analytic Reflective Thi – BUSPROG: Reflective Thinking
United States – BUSPROG: Promotion – BUSPROG: Analytic
STATE STANDARDS:
United States – PA – DISC: International trade and fi – DISC: International trade and finance
TOPICS:
Price Adjustments
KEYWORDS:
BLOOM’S: Remember
DATE CREATED:
6/22/2016 3:25 PM
DATE MODIFIED:
6/22/2016 3:25 PM
57. When a country’s current account moves into disequilibrium, automatic adjustments in tariffs and quotas occur which
move the current account back into equilibrium.
a.
True
b.
False
ANSWER:
False
POINTS:
1
DIFFICULTY:
Easy
QUESTION TYPE:
True / False
HAS VARIABLES:
False
NATIONAL STANDARDS:
United States – BUSPROG: Analytic Reflective Thi – BUSPROG: Reflective Thinking
United States – BUSPROG: Promotion – BUSPROG: Analytic
STATE STANDARDS:
United States – PA – DISC: International trade and fi – DISC: International trade and finance
TOPICS:
Price Adjustments
KEYWORDS:
BLOOM’S: Understand
DATE CREATED:
6/22/2016 3:25 PM
DATE MODIFIED:
6/22/2016 3:25 PM
58. Prices, interest rates, and income are the automatic adjustment variables that help restore current-account equilibrium
under a system of fixed exchange rates.
a.
True
b.
False
ANSWER:
True
POINTS:
1
Copyright Cengage Learning. Powered by Cognero.
Page 26
DIFFICULTY:
Easy
QUESTION TYPE:
True / False
HAS VARIABLES:
False
NATIONAL STANDARDS:
United States – BUSPROG: Analytic Reflective Thi – BUSPROG: Reflective Thinking
United States – BUSPROG: Promotion – BUSPROG: Analytic
STATE STANDARDS:
United States – PA – DISC: International trade and fi – DISC: International trade and finance
TOPICS:
Price Adjustments
KEYWORDS:
BLOOM’S: Understand
DATE CREATED:
6/22/2016 3:25 PM
DATE MODIFIED:
6/22/2016 3:25 PM
59. That the balance of payments could be adjusted by prices and interest rates, under a fixed exchange rate system,
originated with Keynesian theory during the 1930s.
a.
True
b.
False
ANSWER:
False
POINTS:
1
DIFFICULTY:
Moderate
QUESTION TYPE:
True / False
HAS VARIABLES:
False
NATIONAL STANDARDS:
United States – BUSPROG: Analytic Reflective Thi – BUSPROG: Reflective Thinking
United States – BUSPROG: Promotion – BUSPROG: Analytic
STATE STANDARDS:
United States – PA – DISC: International trade and fi – DISC: International trade and finance
TOPICS:
Income Adjustments
KEYWORDS:
BLOOM’S: Remember
DATE CREATED:
6/22/2016 3:25 PM
DATE MODIFIED:
6/22/2016 3:25 PM
60. David Hume’s price-adjustment mechanism supported the mercantilist view that a nation could maintain a trade
surplus indefinitely.
a.
True
b.
False
ANSWER:
False
POINTS:
1
DIFFICULTY:
Moderate
QUESTION TYPE:
True / False
HAS VARIABLES:
False
NATIONAL STANDARDS:
United States – BUSPROG: Analytic Reflective Thi – BUSPROG: Reflective Thinking
United States – BUSPROG: Promotion – BUSPROG: Analytic
STATE STANDARDS:
United States – PA – DISC: International trade and fi – DISC: International trade and finance
TOPICS:
Price Adjustments
KEYWORDS:
BLOOM’S: Understand
DATE CREATED:
6/22/2016 3:25 PM
DATE MODIFIED:
6/22/2016 3:25 PM
61. Under the price-adjustment mechanism, a government’s efforts to maintain a current-account surplus is self defeating
over the long run because a nation’s current account automatically moves toward equilibrium.
Copyright Cengage Learning. Powered by Cognero.
Page 27
a.
True
b.
False
ANSWER:
True
POINTS:
1
DIFFICULTY:
Moderate
QUESTION TYPE:
True / False
HAS VARIABLES:
False
NATIONAL STANDARDS:
United States – BUSPROG: Analytic Reflective Thi – BUSPROG: Reflective Thinking
United States – BUSPROG: Promotion – BUSPROG: Analytic
STATE STANDARDS:
United States – PA – DISC: International trade and fi – DISC: International trade and finance
TOPICS:
Price Adjustments
KEYWORDS:
BLOOM’S: Understand
DATE CREATED:
6/22/2016 3:25 PM
DATE MODIFIED:
6/22/2016 3:25 PM
62. Under the gold standard of the 1800s, exchange rates were allowed to float freely in the currency markets.
a.
True
b.
False
ANSWER:
False
POINTS:
1
DIFFICULTY:
Easy
QUESTION TYPE:
True / False
HAS VARIABLES:
False
NATIONAL STANDARDS:
United States – BUSPROG: Analytic Reflective Thi – BUSPROG: Reflective Thinking
United States – BUSPROG: Promotion – BUSPROG: Analytic
STATE STANDARDS:
United States – PA – DISC: International trade and fi – DISC: International trade and finance
TOPICS:
Price Adjustments
KEYWORDS:
BLOOM’S: Remember
DATE CREATED:
6/22/2016 3:25 PM
DATE MODIFIED:
6/22/2016 3:25 PM
63. Under the gold standard, each participating nation defined the mint price of gold in terms of its national currency was
prepared to buy and sell gold at that price.
a.
True
b.
False
ANSWER:
True
POINTS:
1
DIFFICULTY:
Easy
QUESTION TYPE:
True / False
HAS VARIABLES:
False
NATIONAL STANDARDS:
United States – BUSPROG: Analytic Reflective Thi – BUSPROG: Reflective Thinking
United States – BUSPROG: Promotion – BUSPROG: Analytic
STATE STANDARDS:
United States – PA – DISC: International trade and fi – DISC: International trade and finance
TOPICS:
Price Adjustments
KEYWORDS:
BLOOM’S: Understand
DATE CREATED:
6/22/2016 3:25 PM
Copyright Cengage Learning. Powered by Cognero.
Page 28
DATE MODIFIED:
6/22/2016 3:25 PM
64. Under the gold standard, a nation with a current-account surplus would realize gold outflows, a decrease in its money
supply, and a fall in its domestic price level.
a.
True
b.
False
ANSWER:
False
POINTS:
1
DIFFICULTY:
Easy
QUESTION TYPE:
True / False
HAS VARIABLES:
False
NATIONAL STANDARDS:
United States – BUSPROG: Analytic Reflective Thi – BUSPROG: Reflective Thinking
United States – BUSPROG: Promotion – BUSPROG: Analytic
STATE STANDARDS:
United States – PA – DISC: International trade and fi – DISC: International trade and finance
TOPICS:
Price Adjustments
KEYWORDS:
BLOOM’S: Understand
DATE CREATED:
6/22/2016 3:25 PM
DATE MODIFIED:
6/22/2016 3:25 PM
65. The essence of the classical price-adjustment mechanism is embodied in the quantity theory of money.
a.
True
b.
False
ANSWER:
True
POINTS:
1
DIFFICULTY:
Moderate
QUESTION TYPE:
True / False
HAS VARIABLES:
False
NATIONAL STANDARDS:
United States – BUSPROG: Analytic Reflective Thi – BUSPROG: Reflective Thinking
United States – BUSPROG: Promotion – BUSPROG: Analytic
STATE STANDARDS:
United States – PA – DISC: International trade and fi – DISC: International trade and finance
TOPICS:
Price Adjustments
KEYWORDS:
BLOOM’S: Understand
DATE CREATED:
6/22/2016 3:25 PM
DATE MODIFIED:
6/22/2016 3:25 PM
66. According to the equation of exchange, the total expenditures on final goods equals the monetary value of the final
goods sold.
a.
True
b.
False
ANSWER:
True
POINTS:
1
DIFFICULTY:
Moderate
QUESTION TYPE:
True / False
HAS VARIABLES:
False
NATIONAL STANDARDS:
United States – BUSPROG: Analytic Reflective Thi – BUSPROG: Reflective Thinking
United States – BUSPROG: Promotion – BUSPROG: Analytic
Copyright Cengage Learning. Powered by Cognero.
Page 29
STATE STANDARDS:
United States – PA – DISC: International trade and fi – DISC: International trade and finance
TOPICS:
Price Adjustments
KEYWORDS:
BLOOM’S: Understand
DATE CREATED:
6/22/2016 3:25 PM
DATE MODIFIED:
6/22/2016 3:25 PM
67. Regarding the equation of exchange, the classical economists assumed that final output was below its maximum level
while the velocity of money was volatile.
a.
True
b.
False
ANSWER:
False
POINTS:
1
DIFFICULTY:
Moderate
QUESTION TYPE:
True / False
HAS VARIABLES:
False
NATIONAL STANDARDS:
United States – BUSPROG: Analytic Reflective Thi – BUSPROG: Reflective Thinking
United States – BUSPROG: Promotion – BUSPROG: Analytic
STATE STANDARDS:
United States – PA – DISC: International trade and fi – DISC: International trade and finance
TOPICS:
Price Adjustments
KEYWORDS:
BLOOM’S: Understand
DATE CREATED:
6/22/2016 3:25 PM
DATE MODIFIED:
6/22/2016 3:25 PM
68. According to the quantity theory of money, a change in the money supply will induce an inverse and less-than-
proportionate change in the price level.
a.
True
b.
False
ANSWER:
False
POINTS:
1
DIFFICULTY:
Moderate
QUESTION TYPE:
True / False
HAS VARIABLES:
False
NATIONAL STANDARDS:
United States – BUSPROG: Analytic Reflective Thi – BUSPROG: Reflective Thinking
United States – BUSPROG: Promotion – BUSPROG: Analytic
STATE STANDARDS:
United States – PA – DISC: International trade and fi – DISC: International trade and finance
TOPICS:
Price Adjustments
KEYWORDS:
BLOOM’S: Understand
DATE CREATED:
6/22/2016 3:25 PM
DATE MODIFIED:
6/22/2016 3:25 PM
69. Under the price-adjustment mechanism, a trade-surplus nation would realize gold inflows, an increase in its money
supply, and a loss of international competitiveness.
a.
True
b.
False
ANSWER:
True
POINTS:
1
Copyright Cengage Learning. Powered by Cognero.
Page 30
DIFFICULTY:
Moderate
QUESTION TYPE:
True / False
HAS VARIABLES:
False
NATIONAL STANDARDS:
United States – BUSPROG: Analytic Reflective Thi – BUSPROG: Reflective Thinking
United States – BUSPROG: Promotion – BUSPROG: Analytic
STATE STANDARDS:
United States – PA – DISC: International trade and fi – DISC: International trade and finance
TOPICS:
Price Adjustments
KEYWORDS:
BLOOM’S: Understand
DATE CREATED:
6/22/2016 3:25 PM
DATE MODIFIED:
6/22/2016 3:25 PM
70. The price-adjustment mechanism’s relevance to the real world has been questioned on the grounds that national output
is generally not at the full-employment level and that the velocity of money is not always constant.
a.
True
b.
False
ANSWER:
True
POINTS:
1
DIFFICULTY:
Moderate
QUESTION TYPE:
True / False
HAS VARIABLES:
False
NATIONAL STANDARDS:
United States – BUSPROG: Analytic Reflective Thi – BUSPROG: Reflective Thinking
United States – BUSPROG: Promotion – BUSPROG: Analytic
STATE STANDARDS:
United States – PA – DISC: International trade and fi – DISC: International trade and finance
TOPICS:
Price Adjustments
KEYWORDS:
BLOOM’S: Understand
DATE CREATED:
6/22/2016 3:25 PM
DATE MODIFIED:
6/22/2016 3:25 PM
71. According to the price-adjustment mechanism, trade deficits can occur only in the long run rather than in the short run.
a.
True
b.
False
ANSWER:
False
POINTS:
1
DIFFICULTY:
Moderate
QUESTION TYPE:
True / False
HAS VARIABLES:
False
NATIONAL STANDARDS:
United States – BUSPROG: Analytic Reflective Thi – BUSPROG: Reflective Thinking
United States – BUSPROG: Promotion – BUSPROG: Analytic
STATE STANDARDS:
United States – PA – DISC: International trade and fi – DISC: International trade and finance
TOPICS:
Price Adjustments
KEYWORDS:
BLOOM’S: Understand
DATE CREATED:
6/22/2016 3:25 PM
DATE MODIFIED:
6/22/2016 3:25 PM
72. Under the price-adjustment mechanism, trade-deficit nations realize price inflation and a loss of competitiveness while
trade surplus nations realize price deflation and an improvement in competitiveness.
Copyright Cengage Learning. Powered by Cognero.
Page 31
a.
True
b.
False
ANSWER:
False
POINTS:
1
DIFFICULTY:
Moderate
QUESTION TYPE:
True / False
HAS VARIABLES:
False
NATIONAL STANDARDS:
United States – BUSPROG: Analytic Reflective Thi – BUSPROG: Reflective Thinking
United States – BUSPROG: Promotion – BUSPROG: Analytic
STATE STANDARDS:
United States – PA – DISC: International trade and fi – DISC: International trade and finance
TOPICS:
Price Adjustments
KEYWORDS:
BLOOM’S: Understand
DATE CREATED:
6/22/2016 3:25 PM
DATE MODIFIED:
6/22/2016 3:25 PM
73. Under the classical gold standard, adjustments in domestic prices and short-term interest rates automatically promoted
balance-of-payments equilibrium over the long run.
a.
True
b.
False
ANSWER:
True
POINTS:
1
DIFFICULTY:
Moderate
QUESTION TYPE:
True / False
HAS VARIABLES:
False
NATIONAL STANDARDS:
United States – BUSPROG: Analytic Reflective Thi – BUSPROG: Reflective Thinking
United States – BUSPROG: Promotion – BUSPROG: Analytic
STATE STANDARDS:
United States – PA – DISC: International trade and fi – DISC: International trade and finance
TOPICS:
Price Adjustments
KEYWORDS:
BLOOM’S: Understand
DATE CREATED:
6/22/2016 3:25 PM
DATE MODIFIED:
6/22/2016 3:25 PM
74. Under the classical gold standard, a trade surplus nation would realize gold inflows, an increase in its money supply,
rising interest rates, and net investment inflows.
a.
True
b.
False
ANSWER:
False
POINTS:
1
DIFFICULTY:
Moderate
QUESTION TYPE:
True / False
HAS VARIABLES:
False
NATIONAL STANDARDS:
United States – BUSPROG: Analytic Reflective Thi – BUSPROG: Reflective Thinking
United States – BUSPROG: Promotion – BUSPROG: Analytic
STATE STANDARDS:
United States – PA – DISC: International trade and fi – DISC: International trade and finance
TOPICS:
Price Adjustments
KEYWORDS:
BLOOM’S: Understand
Copyright Cengage Learning. Powered by Cognero.
Page 32
DATE CREATED:
6/22/2016 3:25 PM
DATE MODIFIED:
6/22/2016 3:25 PM
75. The gold standard’s “rules of the game” required central bankers in a surplus country to initiate contractionary
monetary policies which lead to higher interest rates and net investment inflows.
a.
True
b.
False
ANSWER:
False
POINTS:
1
DIFFICULTY:
Moderate
QUESTION TYPE:
True / False
HAS VARIABLES:
False
NATIONAL STANDARDS:
United States – BUSPROG: Analytic Reflective Thi – BUSPROG: Reflective Thinking
United States – BUSPROG: Promotion – BUSPROG: Analytic
STATE STANDARDS:
United States – PA – DISC: International trade and fi – DISC: International trade and finance
TOPICS:
Price Adjustments
KEYWORDS:
BLOOM’S: Understand
DATE CREATED:
6/22/2016 3:25 PM
DATE MODIFIED:
6/22/2016 3:25 PM
76. The gold standard’s “rules of the game” required central bankers in a trade deficit nation to expand the money supply,
leading to falling interest rates and net investment outflows.
a.
True
b.
False
ANSWER:
False
POINTS:
1
DIFFICULTY:
Moderate
QUESTION TYPE:
True / False
HAS VARIABLES:
False
NATIONAL STANDARDS:
United States – BUSPROG: Analytic Reflective Thi – BUSPROG: Reflective Thinking
United States – BUSPROG: Promotion – BUSPROG: Analytic
STATE STANDARDS:
United States – PA – DISC: International trade and fi – DISC: International trade and finance
TOPICS:
Price Adjustments
KEYWORDS:
BLOOM’S: Understand
DATE CREATED:
6/22/2016 3:25 PM
DATE MODIFIED:
6/22/2016 3:25 PM
77. The “rules of the game” served to reinforce and speed up the interest-rate-adjustment mechanism under a system of
fixed exchange rates.
a.
True
b.
False
ANSWER:
True
POINTS:
1
DIFFICULTY:
Moderate
QUESTION TYPE:
True / False
HAS VARIABLES:
False
Copyright Cengage Learning. Powered by Cognero.
Page 33
NATIONAL STANDARDS:
United States – BUSPROG: Analytic Reflective Thi – BUSPROG: Reflective Thinking
United States – BUSPROG: Promotion – BUSPROG: Analytic
STATE STANDARDS:
United States – PA – DISC: International trade and fi – DISC: International trade and finance
TOPICS:
Price Adjustments
KEYWORDS:
BLOOM’S: Analyze
DATE CREATED:
6/22/2016 3:25 PM
DATE MODIFIED:
6/22/2016 3:25 PM
PREFACE NAME:
Figure 13.3
NATIONAL STANDARDS:
United States – BUSPROG: Promotion – BUSPROG: Analytic
STATE STANDARDS:
United States – PA – DISC: Reading and interpreting g – DISC: Reading and interpreting
graphs
TOPICS:
Financial Flows and Interest-Rate Differentials
KEYWORDS:
BLOOM’S: Analyze
DATE CREATED:
6/22/2016 3:25 PM
DATE MODIFIED:
6/22/2016 3:25 PM
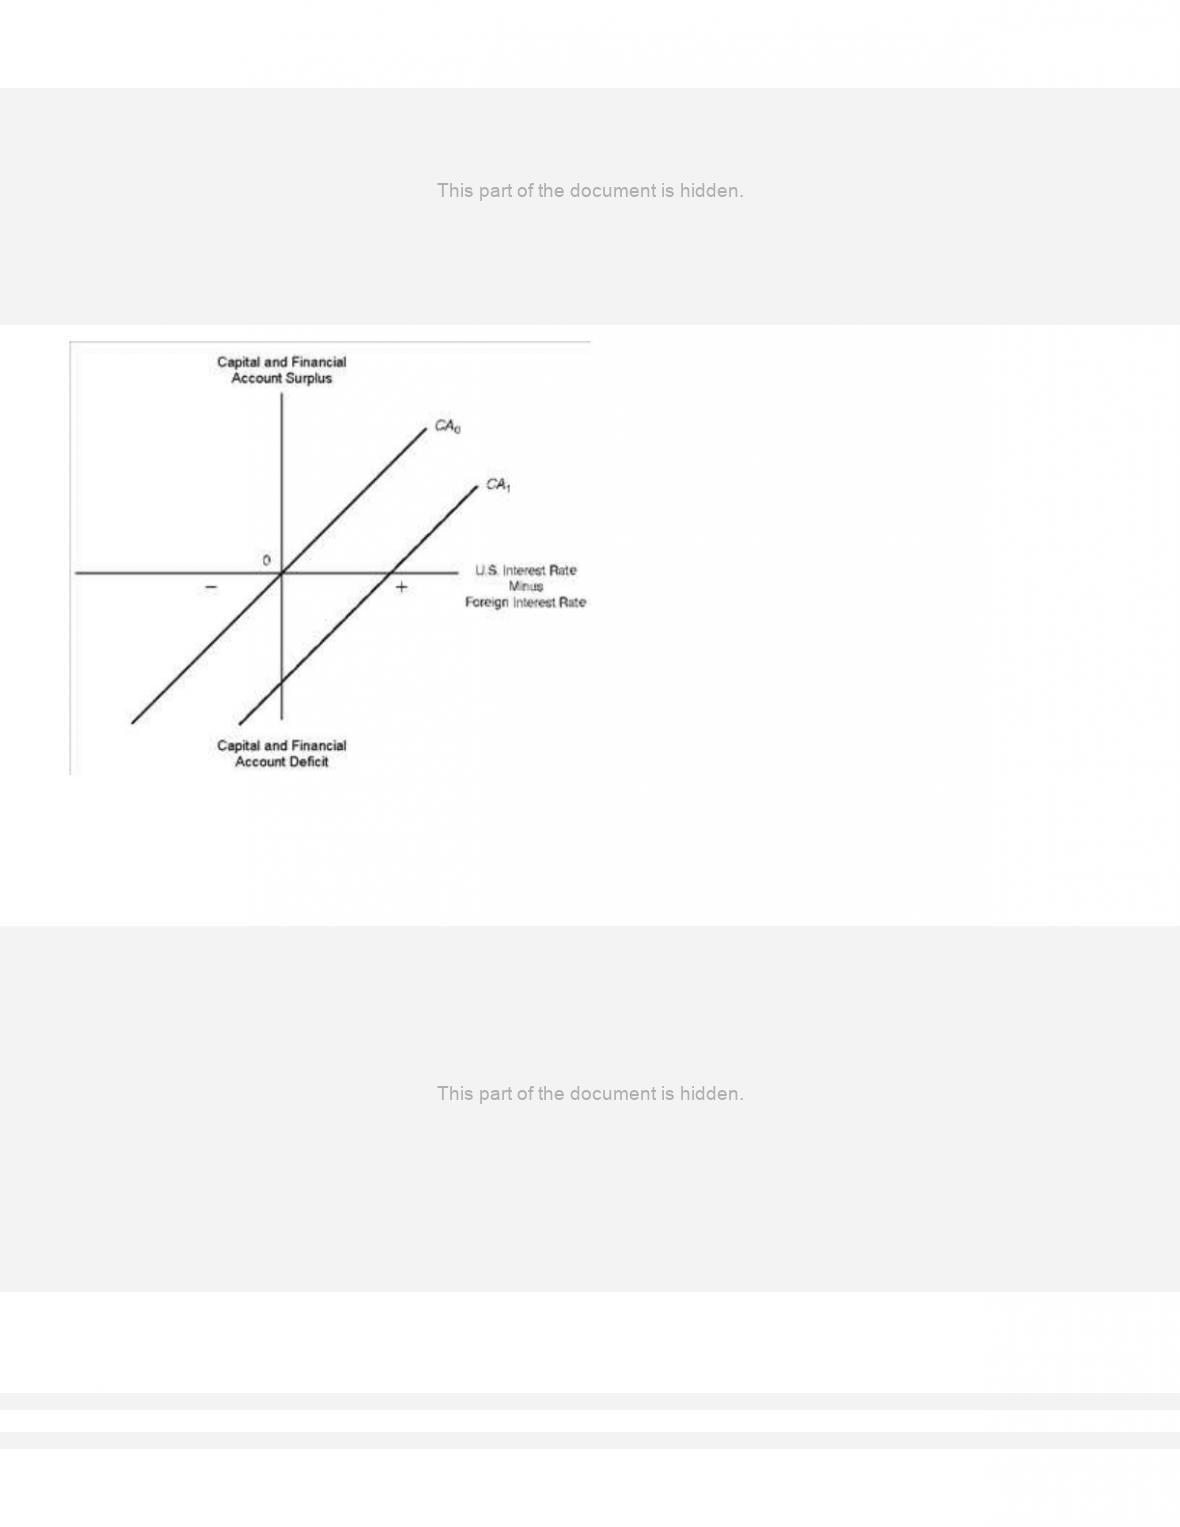
79. Refer to Figure 13.3. Decreases in U.S. interest rates relative to foreign interest rates would shift U.S. capital and
financial account schedule CA0 downward toward CA1, resulting in net financial outflows from the United States.
a.
True
True
b.
False
ANSWER:
True
POINTS:
1
DIFFICULTY:
Challenging
QUESTION TYPE:
True / False
HAS VARIABLES:
False