One of the properties of the mean is that the sum of the deviations of each observation
from the mean is zero.
In the average linkage clustering, the distance between two clusters is defined as the
average of distances between all pairs of objects, where each pair is made up of one
object from each group.
For the average payoff strategy, the decision with the best average payoff is chosen.
Absolute value functions, in optimization models, result in non-smooth functions.
If the alternative hypothesis includes the symbol <, the rejection region is in the upper
tail.
As Monte Carlo simulation is essentially statistical sampling, the larger the number of
trials used, the more precise is the result.
Decision variables that are forced to be integers are called general integer variables.
Excel’s Trendline feature cannot be used in modeling trends which include time
variables.
Decision support systems evolved from efforts to improve military operations prior to
and during World War II.
A deterministic model is one in which all model input information is either known or
assumed to be known with certainty.
A binding constraint is one for which the Cell Value is greater than the right-hand side
of the value of the constraint.
The value of a coefficient of skewness falling between 0.5 and -0.5 indicates relative
symmetry.
To use the VLOOKUP(lookup_value, table_array, col_index_num), the table must be
sorted in descending order.
A sample is a subset of a population.
Not specifying a Bin Range will not allow Excel to automatically determine bin values
for the frequency distribution and histogram.
Lagging and leading measures in cause-and-effect modeling are uncorrelated.
Using Chebyshev’s theorem for standard deviation, calculate the percentage of data that
lie within five standard deviations of the mean.
A) 89%
B) 75%
C) 96%
D) 50%
Which of the following is the first phase in problem solving?
A) defining the problem
B) analyzing the problem
C) recognizing the problem
D) structuring the problem
Problem statements such as the amount of material used in production cannot exceed
the amount available in inventory would be categorized as a ________ constraint.
A) proportional relationships
B) limitations
C) requirements
D) simple bounds
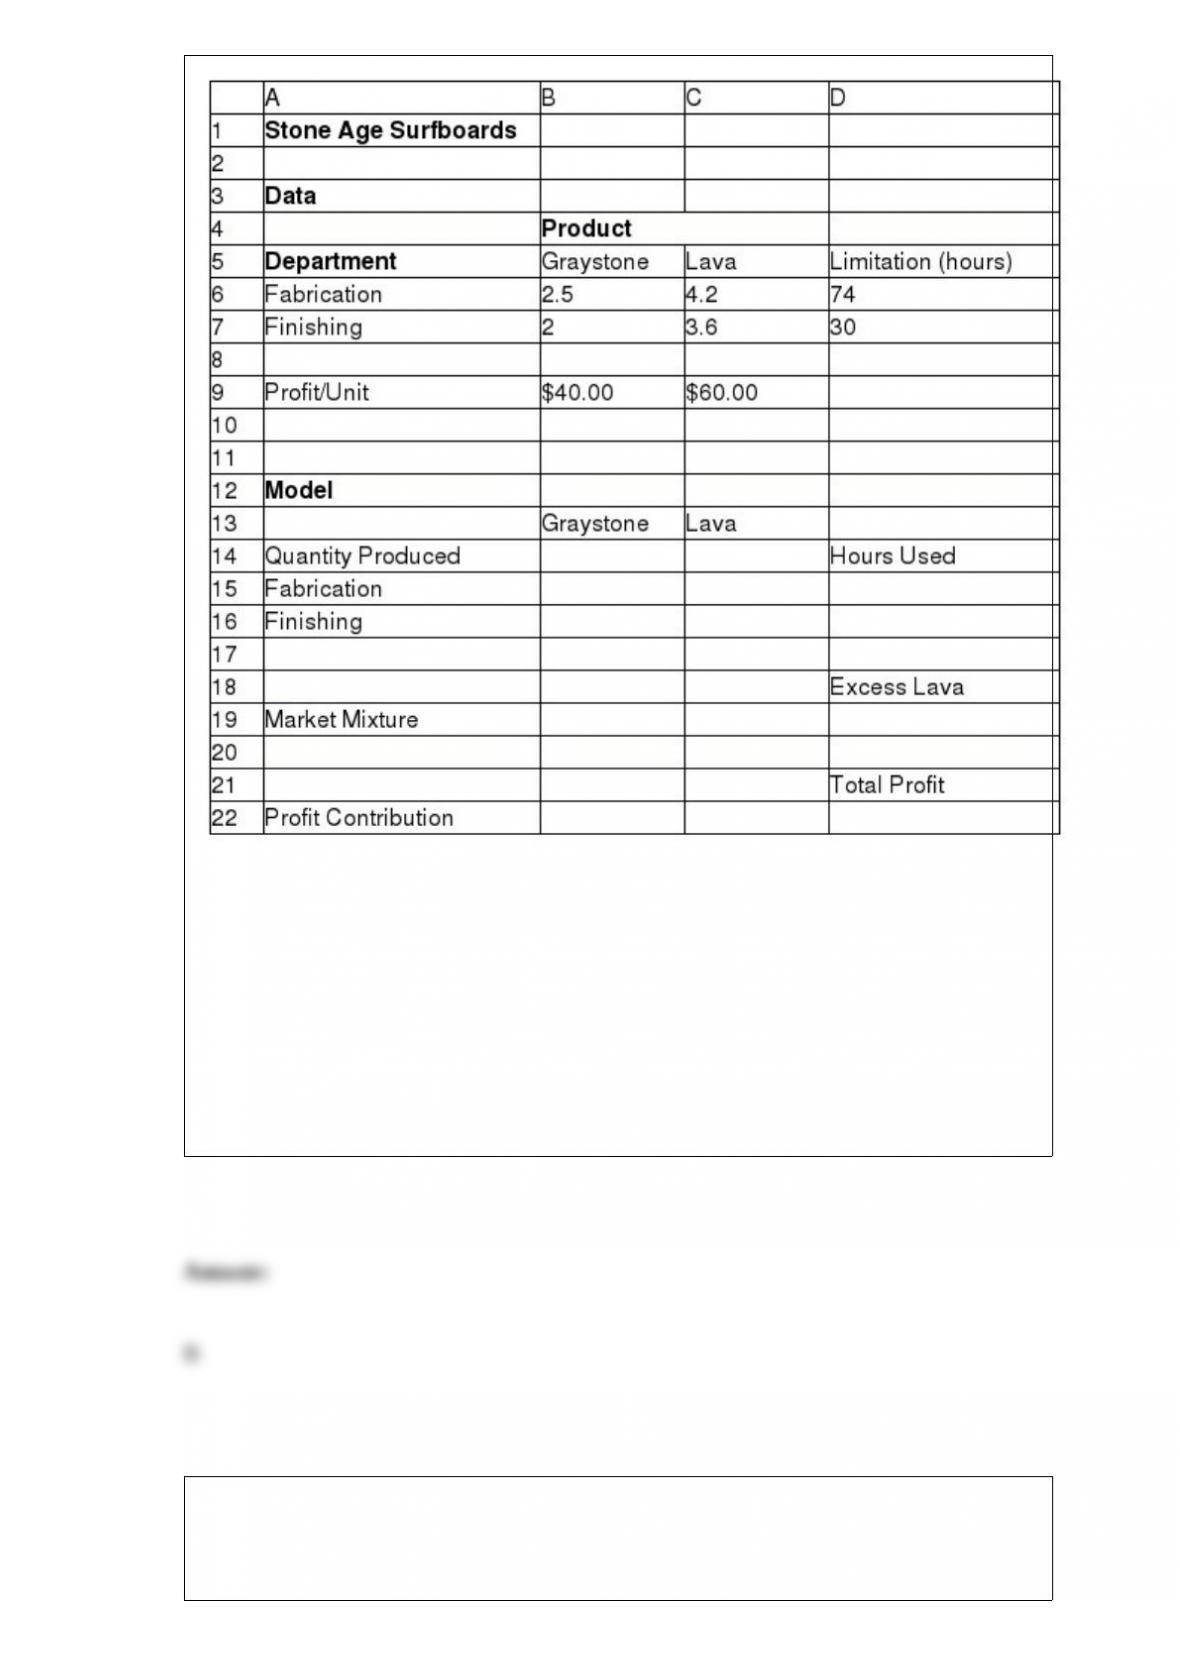
Stone Age Surfboards is a small manufacturer of two types of popular low-tide
surfboards, the Graystone and the Lava models. The manufacturing process consists of
two departments: fabrication and finishing. The fabrication department has 8 skilled
workers, each of whom works 9.25 hours per day. The finishing department has 5
workers, each of whom works a 6 -hour shift per day. Each pair of Graystone
surfboards requires 2.5 labor hours in the fabrication department and 2 labor hours in
finishing. The Lava model requires 4.2 labor-hours in fabrication and 3.6 labor-hours in
finishing. The company operates 6 days a week. It makes a per unit profit of $40 on the
Graystone model and $60 on the Lava model. The company anticipates selling at least
twice as many Lava models as Graystone models.
What is the value of slack obtained from the answer report?
A) 46.78
B) 38.46
C) 59.24
D) 23.85
Identify the equation for calculating the net present value for a stated period of time,
where
Ft = cash flow in period t, and i is the discount rate.
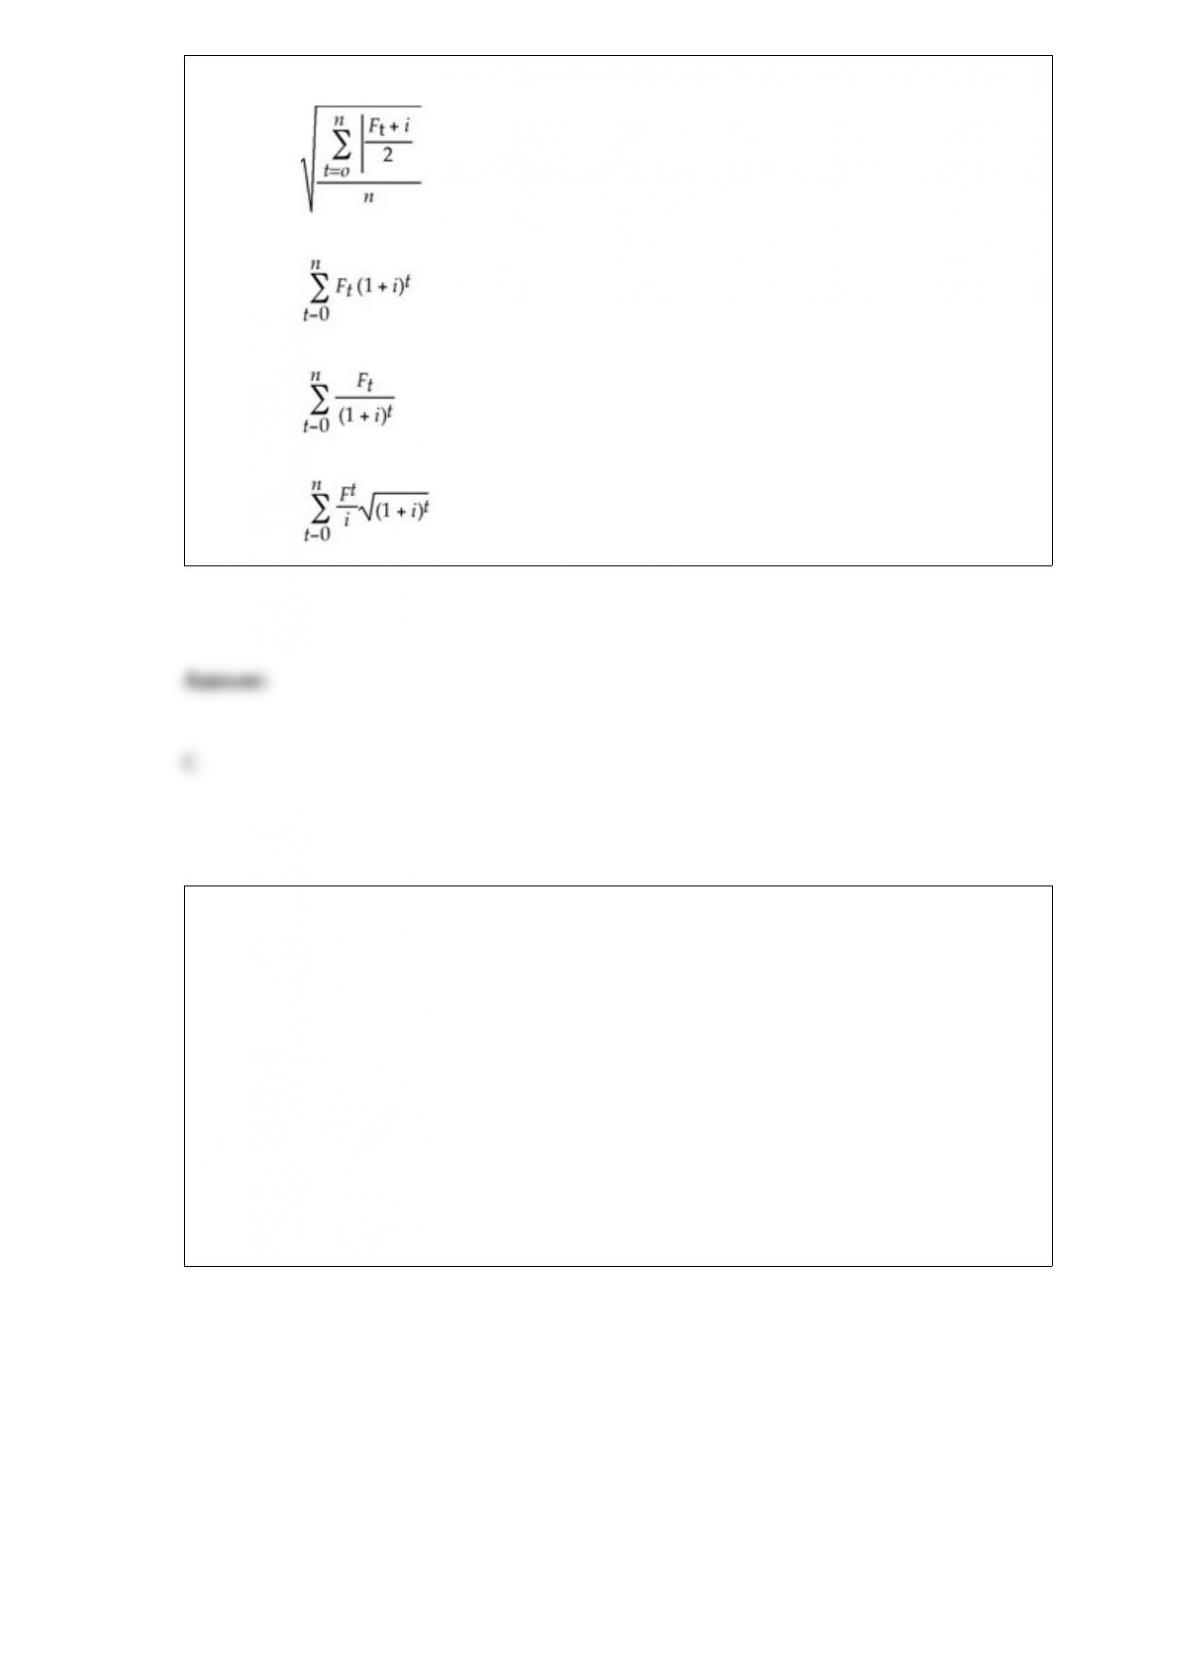
A) NPV =
B) NPV =
C) NPV =
D) NPV =
The Riviera Transport Company (RTC) produces car accessories at two plants: Dallas
and Atlanta. They ship them to major distribution centers in Houston, San Jose,
Jacksonville, and Memphis. The accounting, production, and marketing departments
have provided the information in the table below, which shows the unit cost of shipping
between any plant and distribution center, plant capacities over the next planning
period, and distribution center demands. RTC’s supply chain manager faces the problem
of determining how much to ship between each plant and distribution center to
minimize the total transportation cost, not exceed available capacity, and meet customer
demand.
Assume Xij = amount shipped from plant i to distribution center j, where i = 1
represents Dallas, i = 2 represents Atlanta, j = 1 represents Houston, and so on.
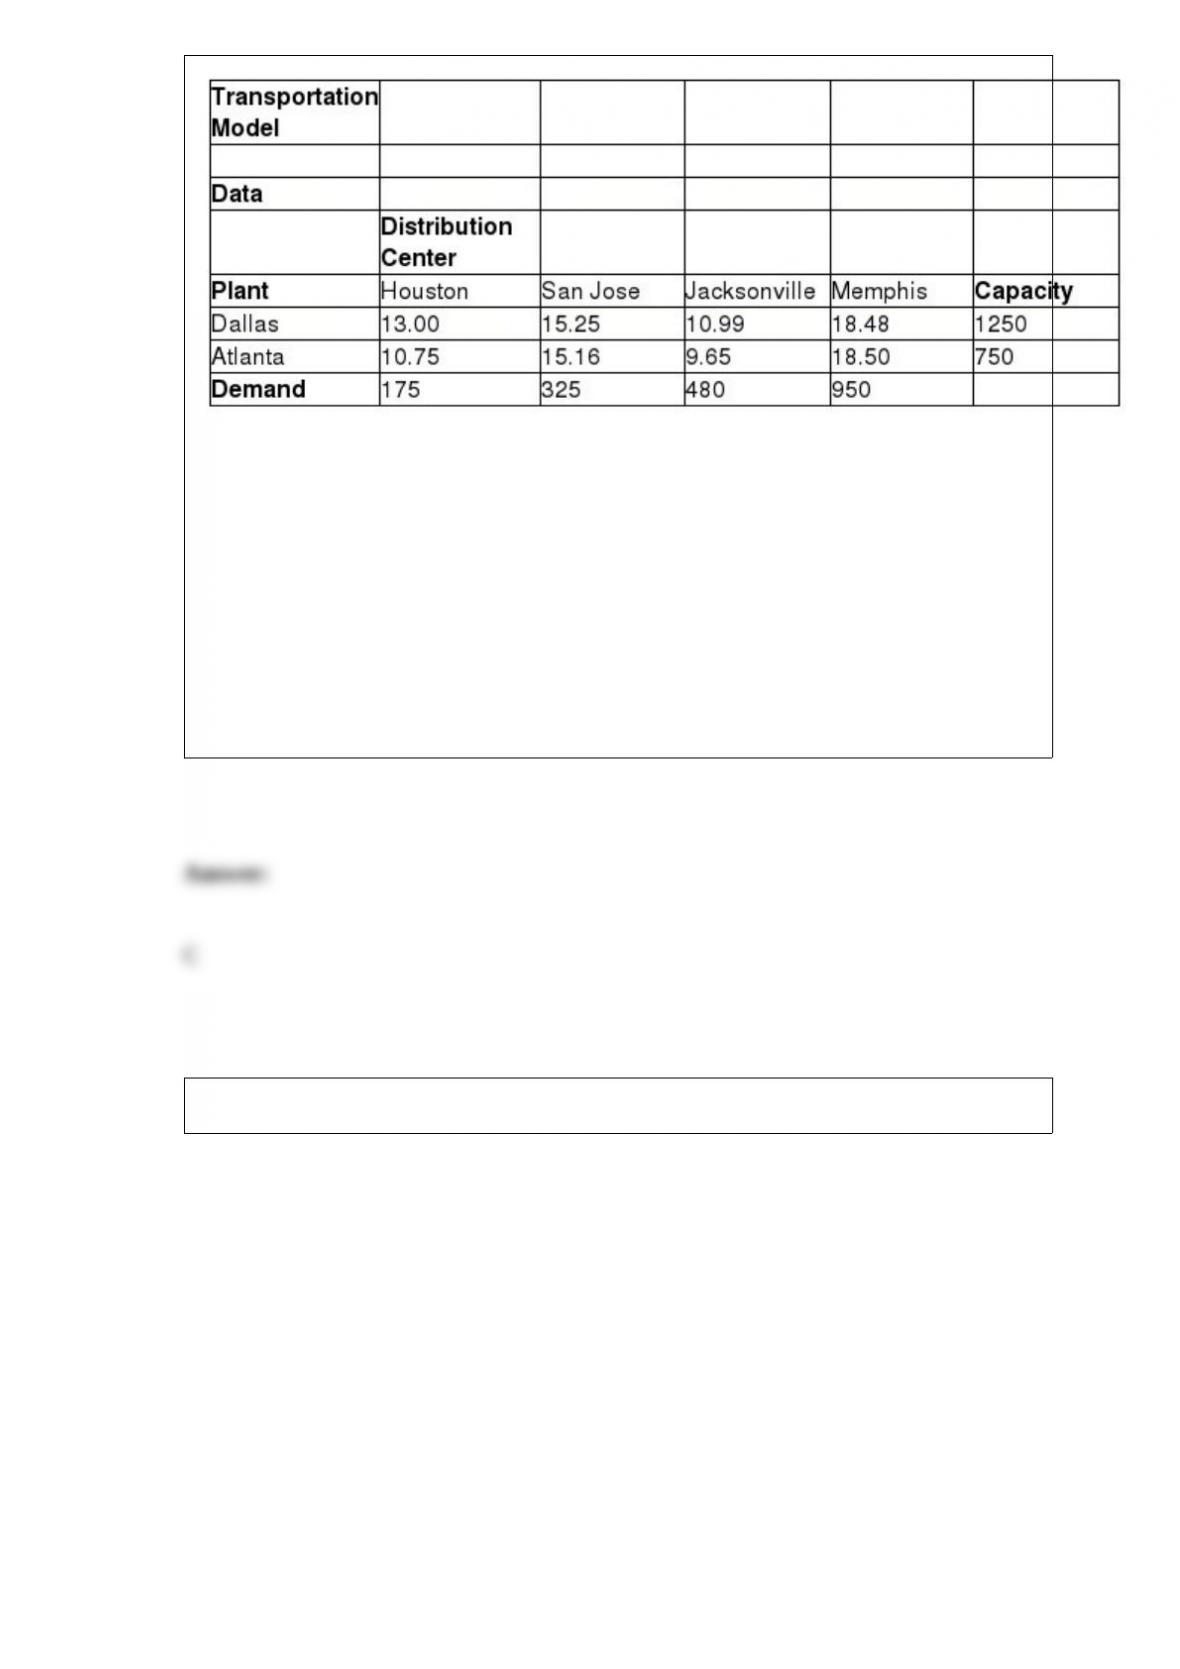
According to the transportation model, which of the following is the amount shipped
from Dallas to San Jose?
A) 0
B) 95
C) 230
D) 325
Consider the spreadsheet for a Newsvendor Model.
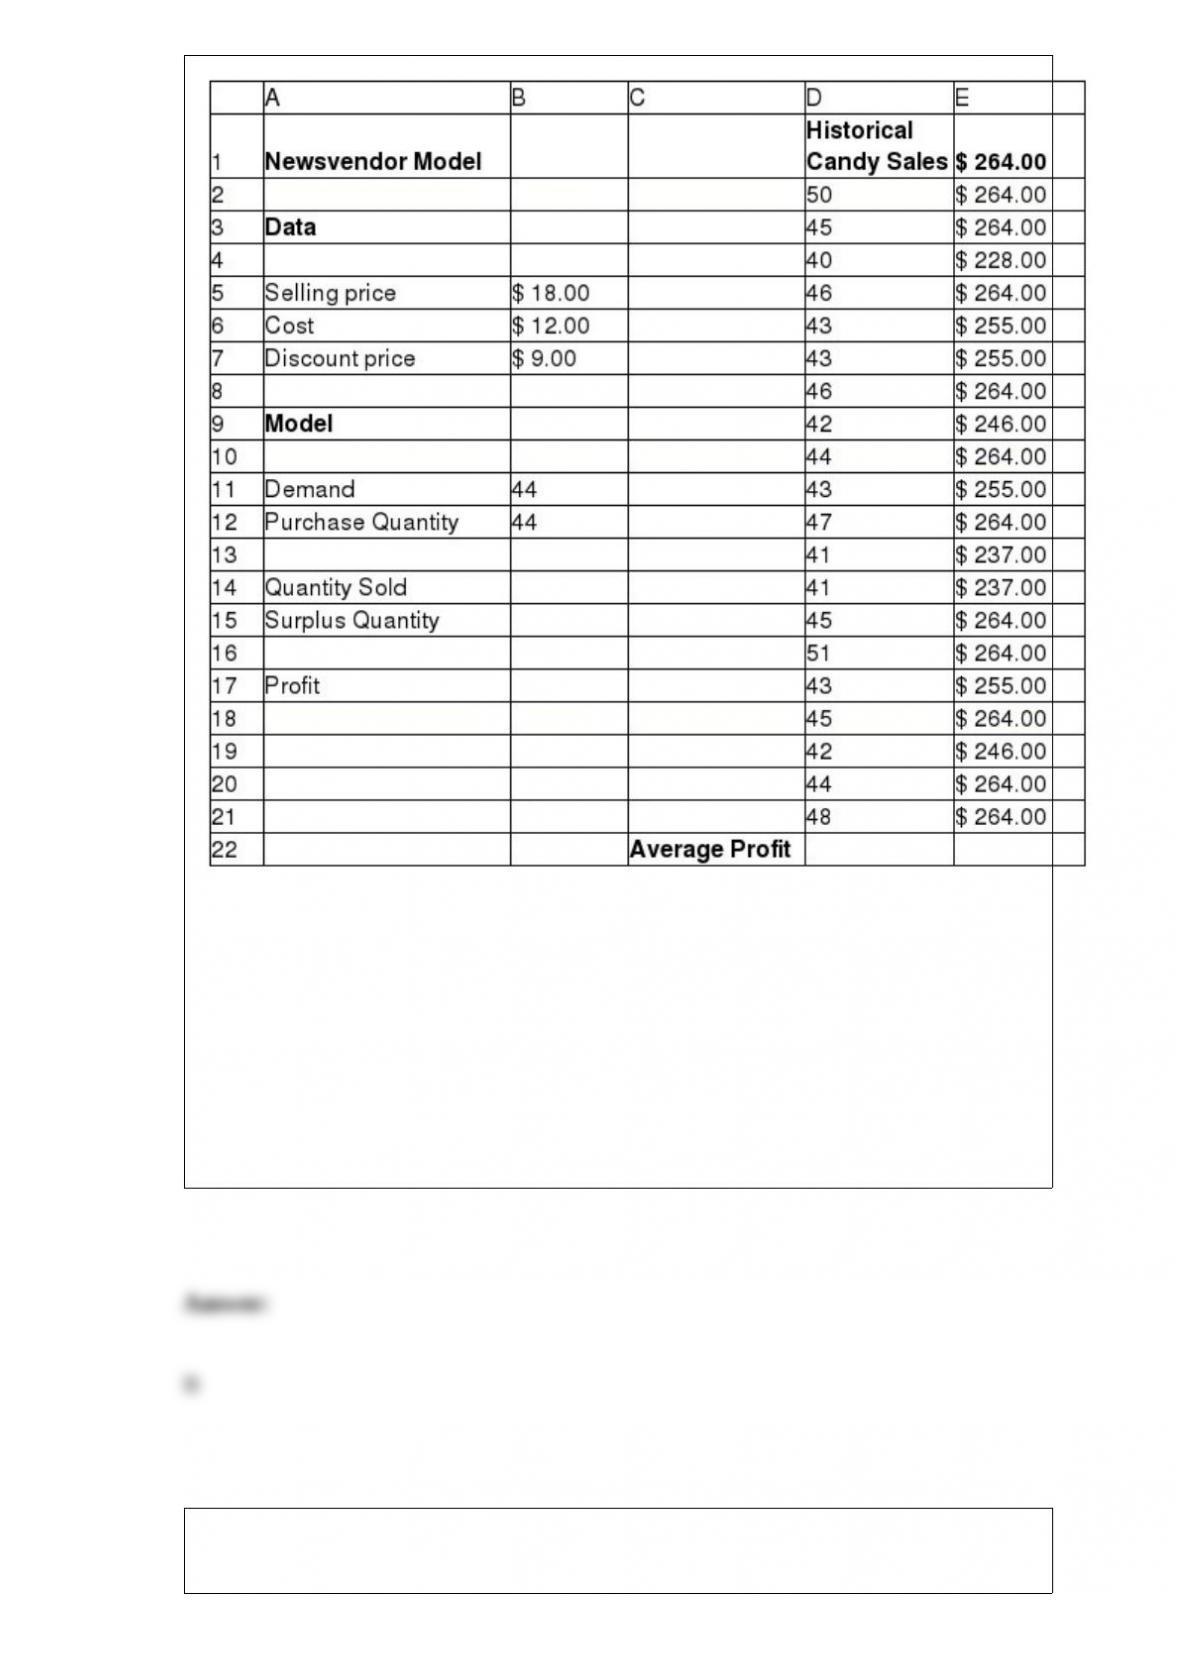
What is the value of standard deviation?
A) $12.50
B) $10.99
C) $15.86
D) $20.25
Which of the following describes a positively skewed histogram?
A) a histogram that tails off toward the right
B) a histogram that has no fluctuation in mass
C) a histogram where more mass tails off toward the left
D) a histogram where mass is only concentrated in the middle
If the given time series has no trend and no seasonality, the most appropriate forecasting
model to determine the forecast of the time series is the ________ model.
A) single moving average
B) Holt-Winters no-trend smoothing
C) double exponential smoothing
D) Holt-Winters additive
The measure of location that specifies the middle value when the data are arranged
from least to greatest is the ________.
A) outlier
B) mean
C) median
D) mode
Predictive analytics:
A) summarizes data into meaningful charts and reports that can be standardized or
customized.
B) identifies the best alternatives to minimize or maximize an objective.
C) uses data to determine a course of action to be executed in a given situation.
D) detects patterns in historical data and extrapolates them forward in time.
Which of the following is true about the Random Number Generation tool?
A) The Random Number Generation dialog presents only three distributions to choose
from: beta, lognormal, and triangular.
B) The default distribution in this tool is the continuous distribution.
C) Repeating the process generates a new set of sample values.
D) Pressing the recalculation (F9) key is an easy way to change the values generated.
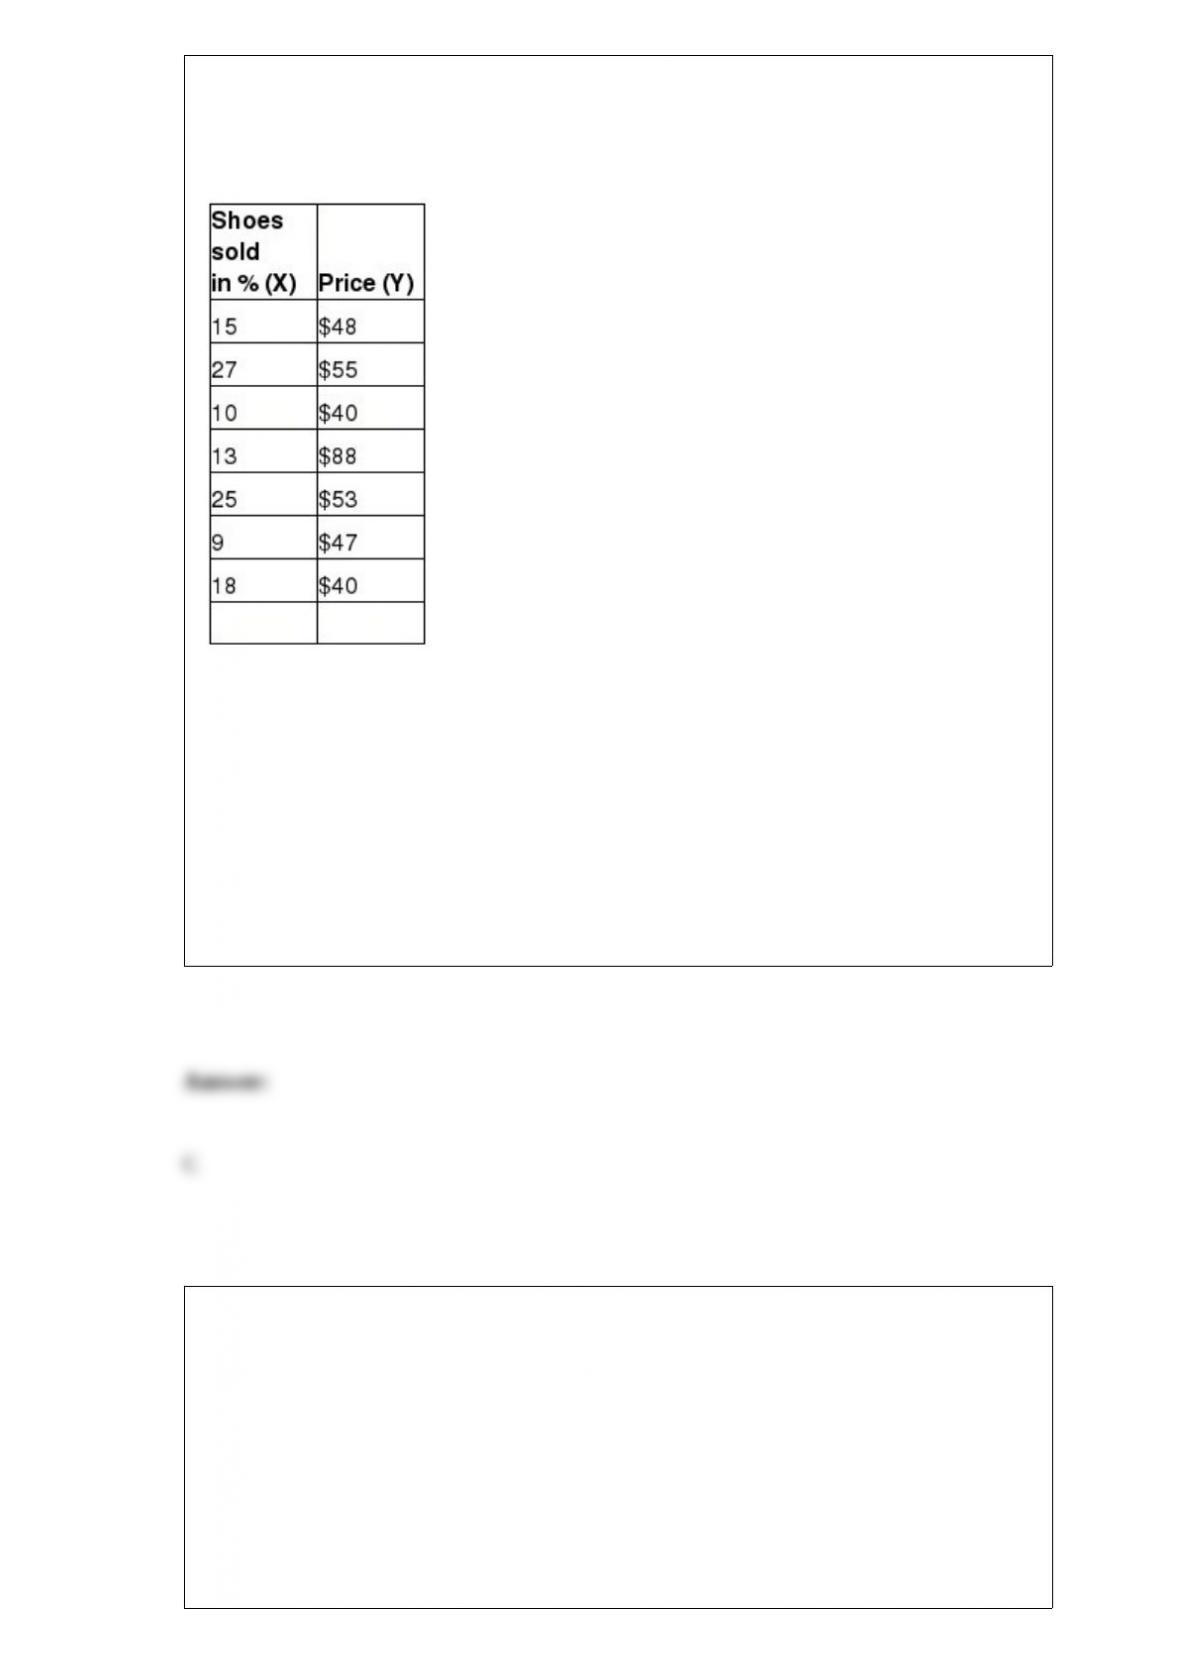
Below is the table showing rate of shoes sold per day and the highest-priced shoe sold
that day for a one-week period. The rate of shoes sold per day (X) and the price of the
shoes (Y).
Use Excel to calculate the variance of X.
A) 271.33
B) 16.47
C) 49.57
D) 7.04
Pickson Luthiers Corporation is studying where to locate a phone charging point on the
factory floor. The locations of five production cells are expressed as X– and
Y-coordinates on a rectangular grid of the factory layout. The daily demand for the
charging point (measured as the number of trips to the charging point) at each
production cell is also known. Because of the nature of the equipment layout in the
factory and for safety reasons, workers must travel along marked horizontal and vertical
aisles to access the charger. Thus, the distance from a cell to the charger is measured as
rectilinear distance.
The table below provides the relevant information.
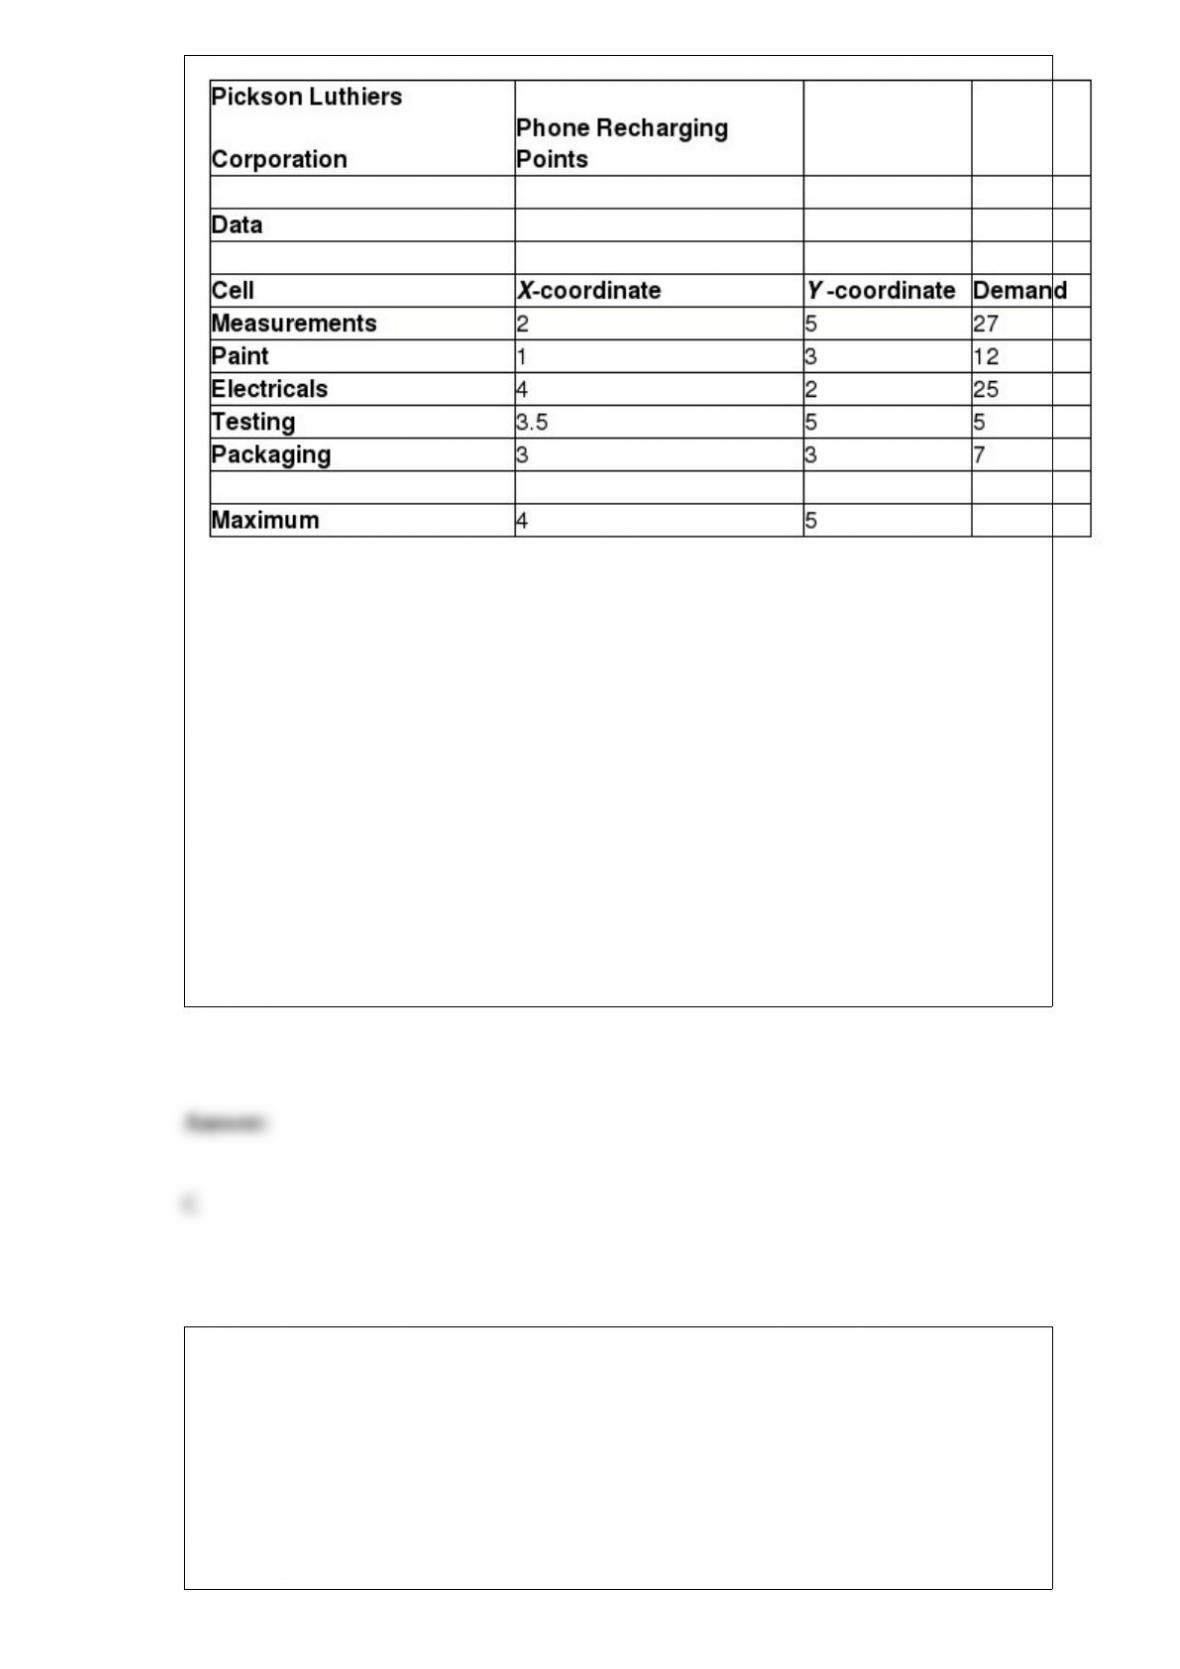
The optimal location should minimize the total weighted distance between the charging
point and all production cells, where the weights are the daily number of trips to the
phone charging point.
According to the model, which of the following is the weighted distance between the
phone charger and Packaging cell?
A) 10.50
B) 0
C) 7.00
D) 14.00
Peige, a stock broker, has data consisting of price, price/earnings ratio, and market
capitalization for seven different stocks on one particular day. She wishes to plot these
three variables in two dimensions. Which of the following charts must Peige use?
A) Stock chart
B) Surface chart
C) Bubble chart
D) Line chart
Compare between the t-distribution and the standard normal distribution.
Define a chance constraint.
Explain the implementation of a project-selection model.
Explain the simplex method used by Solver.
While conducting regression analysis, how is constructing a normal probability plot
useful?
P(Q|P) = P(P or Q) – P(Q)
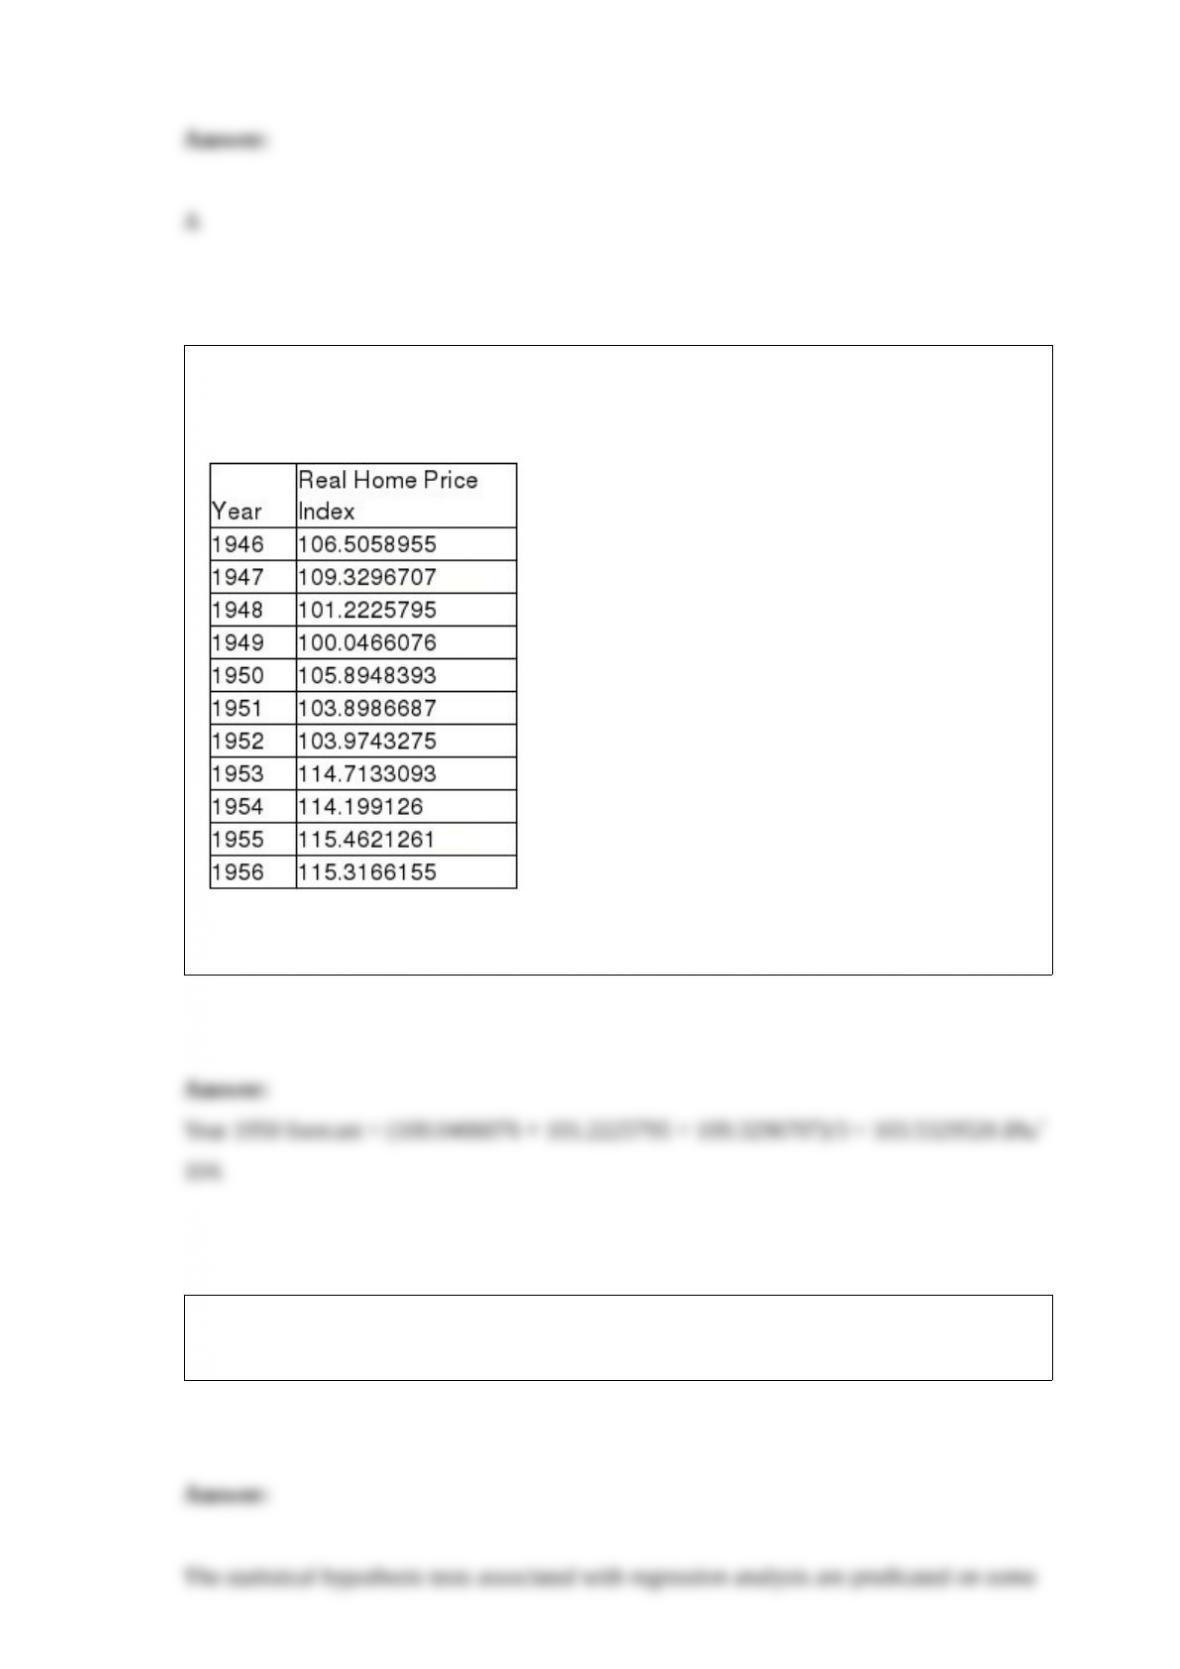
The table below is the data set of the Shiller Real Home Price Index for the years
1946-1956.
Setting k = 3, determine the simple moving average forecast for the year 1950.
Briefly explain the assumptions on which the statistical hypothesis tests associated with
regression analysis are predicated.