________ constraints essentially state that input = output and ensure that the flow of
material or money is accounted for at locations or between time periods.
A) Requirements
B) Proportional relationships
C) Balance
D) Limitations
Which of the following measures of location is calculated using the formula is the
number of observations?
A) midrange
B) sample mean
C) mode
D) median
Following is an extract from the Cost per Order Database of Grogtes LLC.
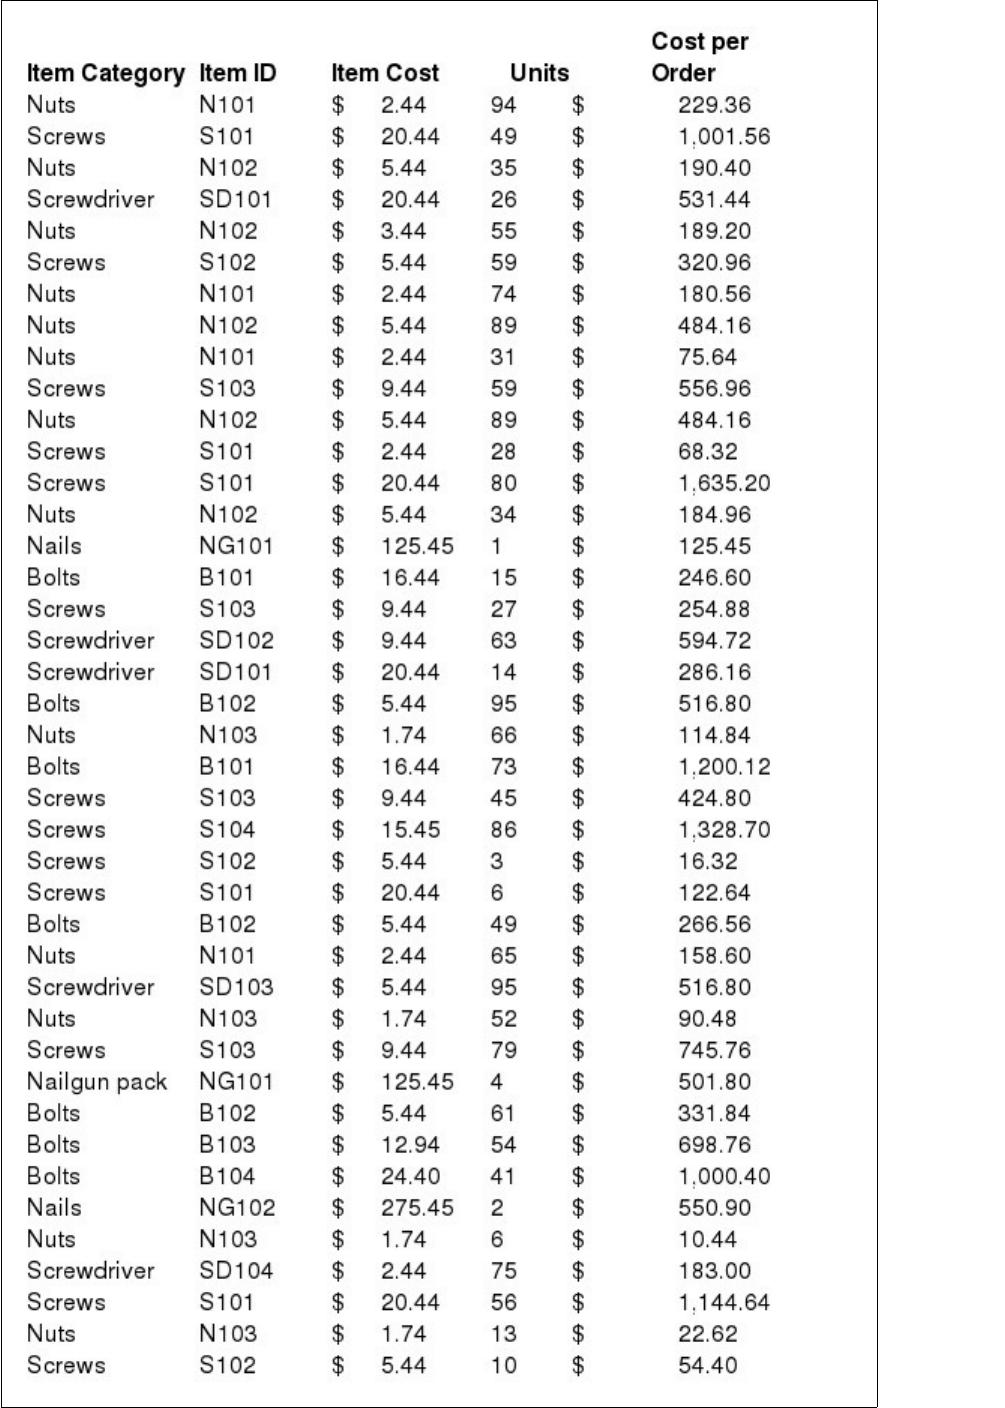
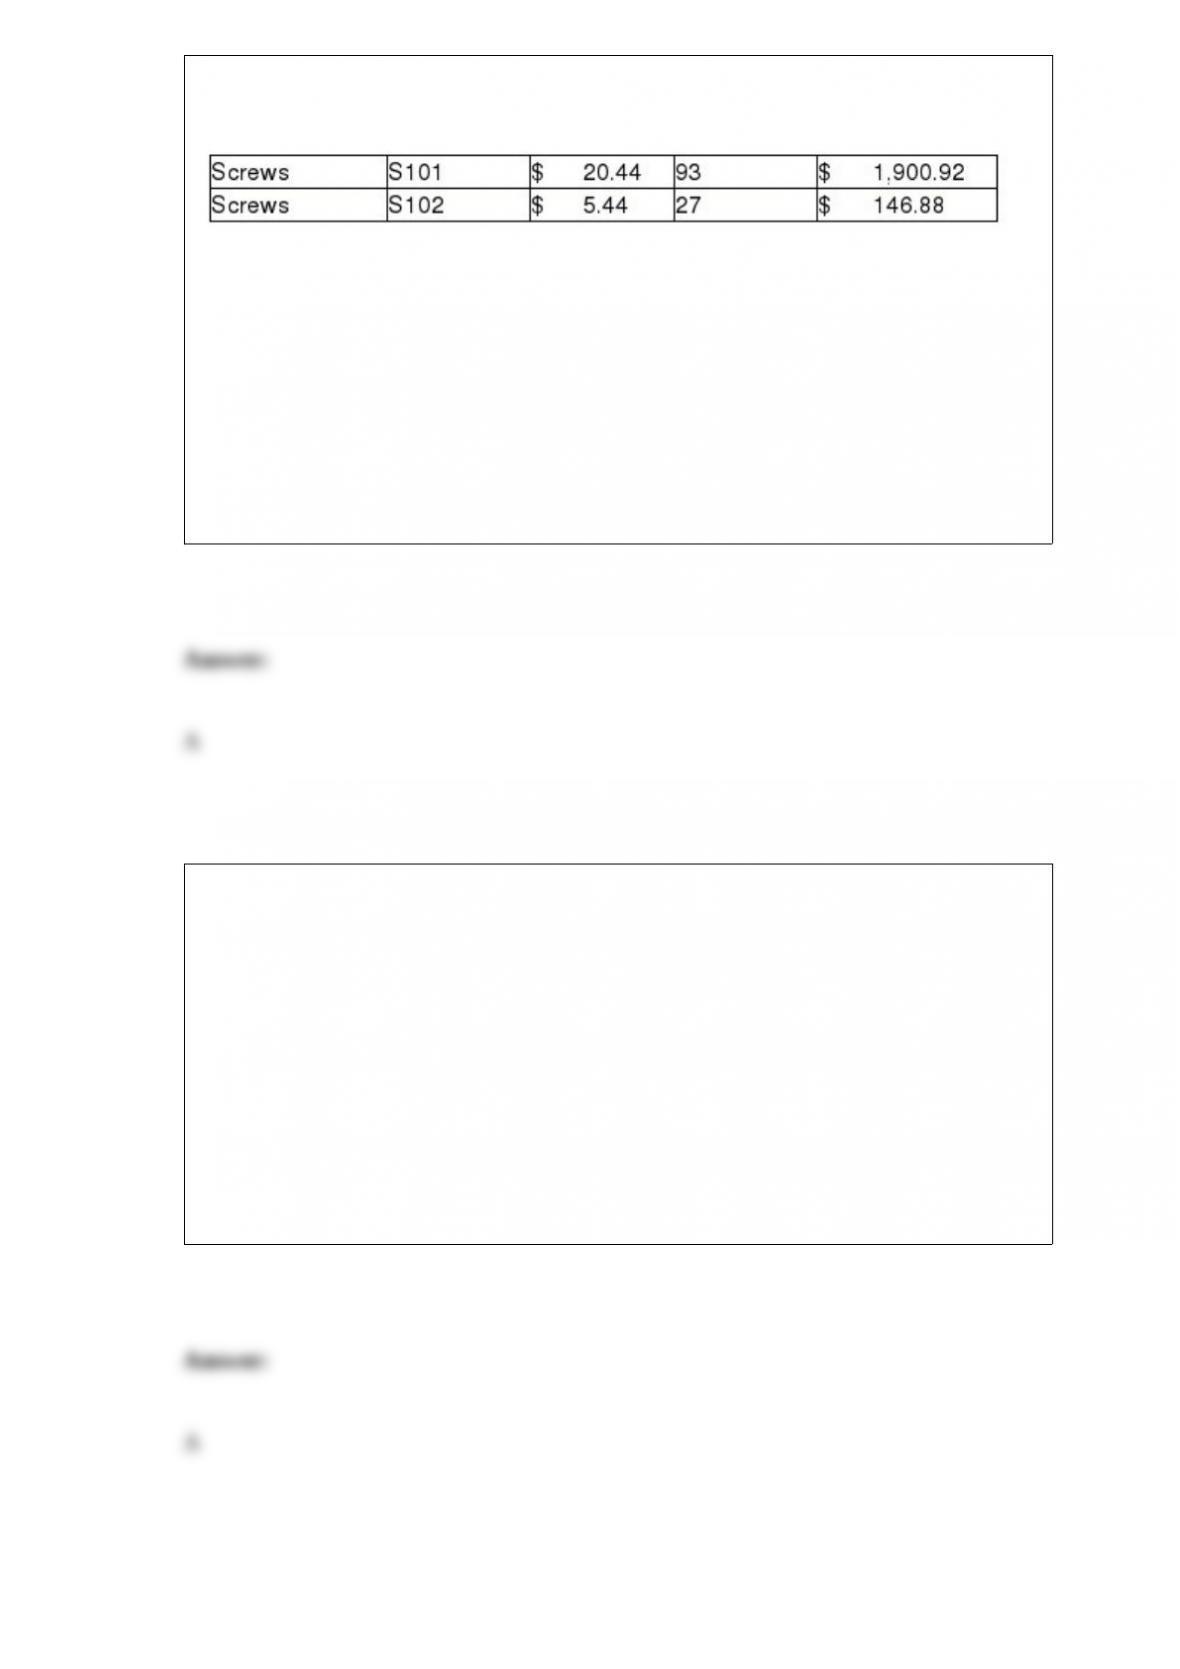
Which of the following will give the value for the third quartile?
A) PERCENTILE.INC(array, 0.75)
B) QUARTILE.INC(array, 0.75)
C) DECILE.INC(array, 0.30)
D) QUARTILE.INC(array, 0.25)
The Kolmogorov-Smirnov procedure:
A) compares the cumulative distribution of the data with the theoretical distribution to
base its conclusion.
B) puts more weight on the differences between the tails of the distributions.
C) breaks down the theoretical distribution into areas of equal probability and compares
the data points within each area to the number that would be expected for that
distribution.
D) is useful when a better fit is needed at the extreme tails of the distribution.
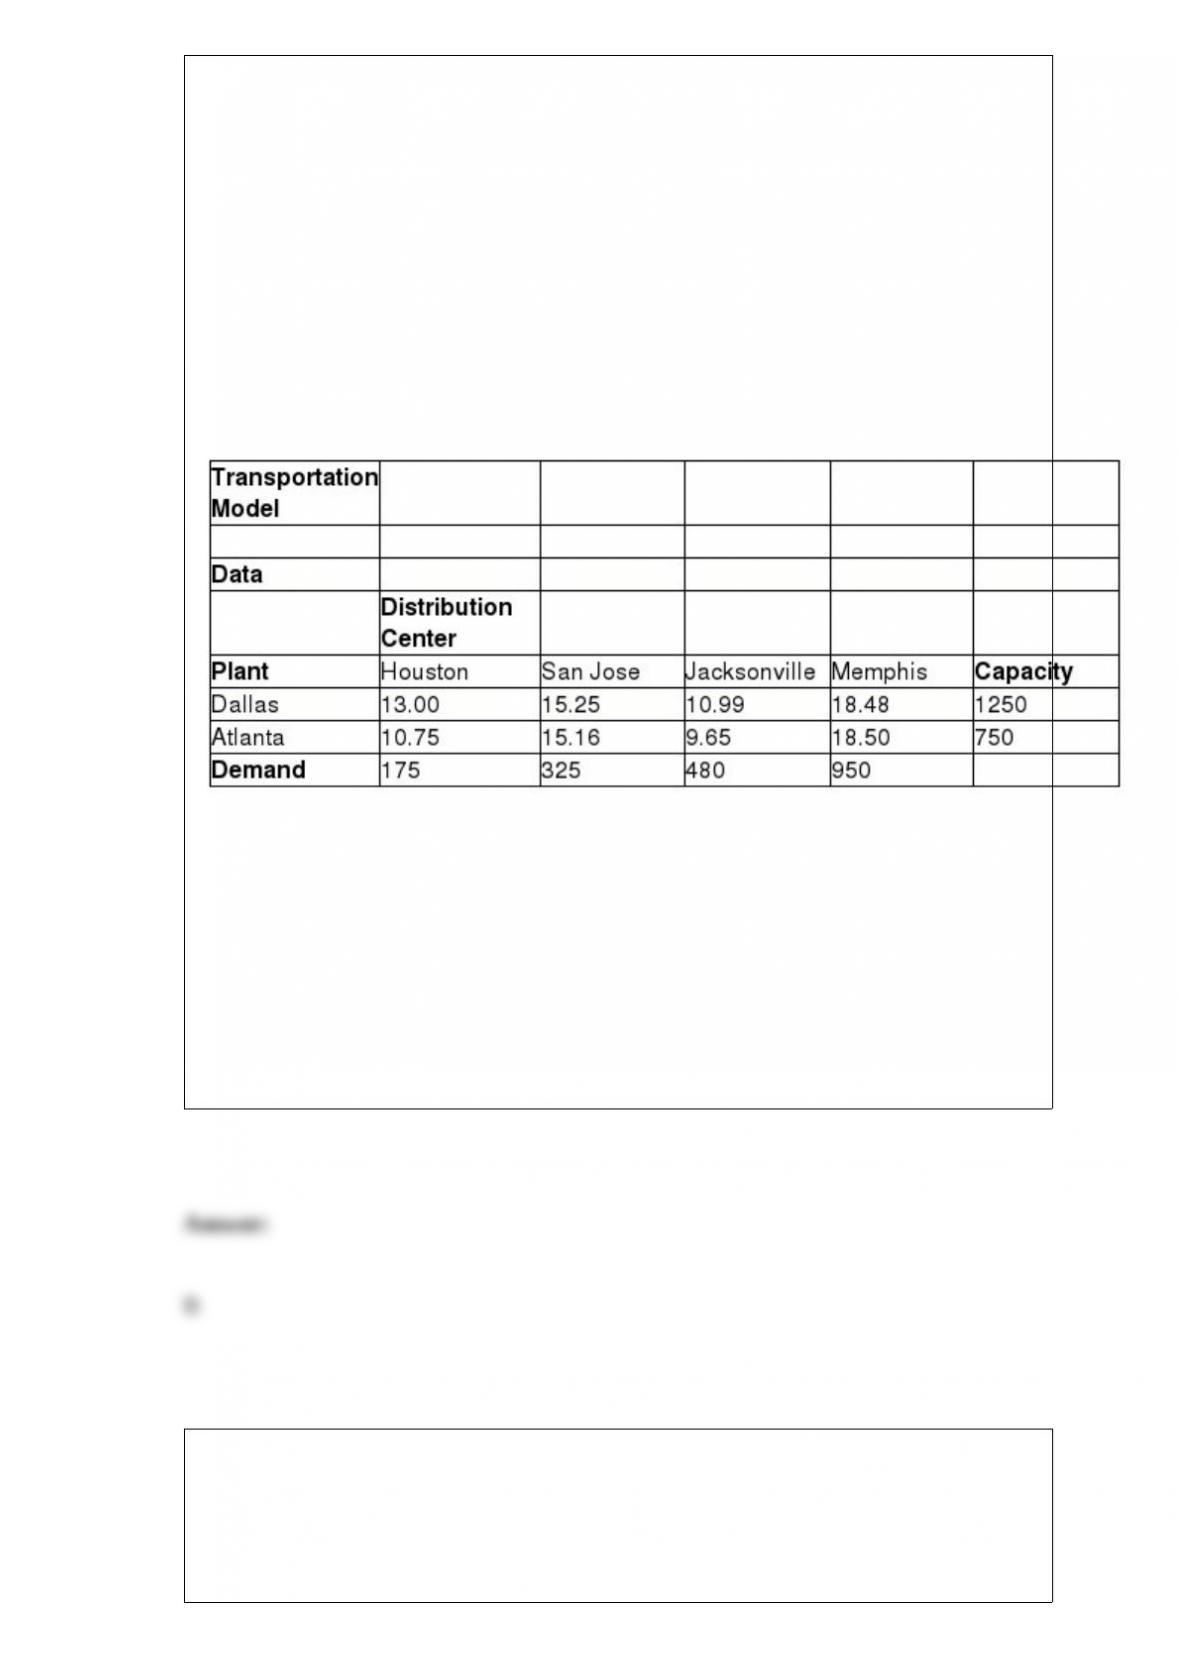
The Riviera Transport Company (RTC) produces car accessories at two plants: Dallas
and Atlanta. They ship them to major distribution centers in Houston, San Jose,
Jacksonville, and Memphis. The accounting, production, and marketing departments
have provided the information in the table below, which shows the unit cost of shipping
between any plant and distribution center, plant capacities over the next planning
period, and distribution center demands. RTC’s supply chain manager faces the problem
of determining how much to ship between each plant and distribution center to
minimize the total transportation cost, not exceed available capacity, and meet customer
demand.
Assume Xij = amount shipped from plant i to distribution center j, where i = 1
represents Dallas, i = 2 represents Atlanta, j = 1 represents Houston, and so on.
Which of the following is the constraint for total amount shipped from Atlanta?
A) X11 + X12 + X13 + X14 – X21 + X22 + X23 + X24 ≤ 850
B) X21 + X22 + X23 + X24 ≤ 750
C) X21 + X22 + X23 + X24 ≤ 1250
D) X11 + X12 + X13 + X14 ≤ 1250
Which of the following describes periodic sampling?
A) It is a sampling method based solely on expert opinion.
B) It is a sampling method based on selecting a time and then sampling the products
after that time.
C) It is a sampling method based on selecting every nth item from a population.
D) It is a sampling method exclusively used for population that is divided into subsets.
Which of the following is true about the classical definition of probability?
A) It is based on judgment and experience.
B) If the process that generates the outcomes is known, probabilities can be deduced
from theoretical arguments.
C) The probability that an outcome will occur is simply the relative frequency
associated with that outcome.
D) It is based on observed data.
The worldwide sales of cars from 1981-1990 are shown in the table below. Given: α =
0.2 and β = 0.15 (Hint: Use XLMiner)
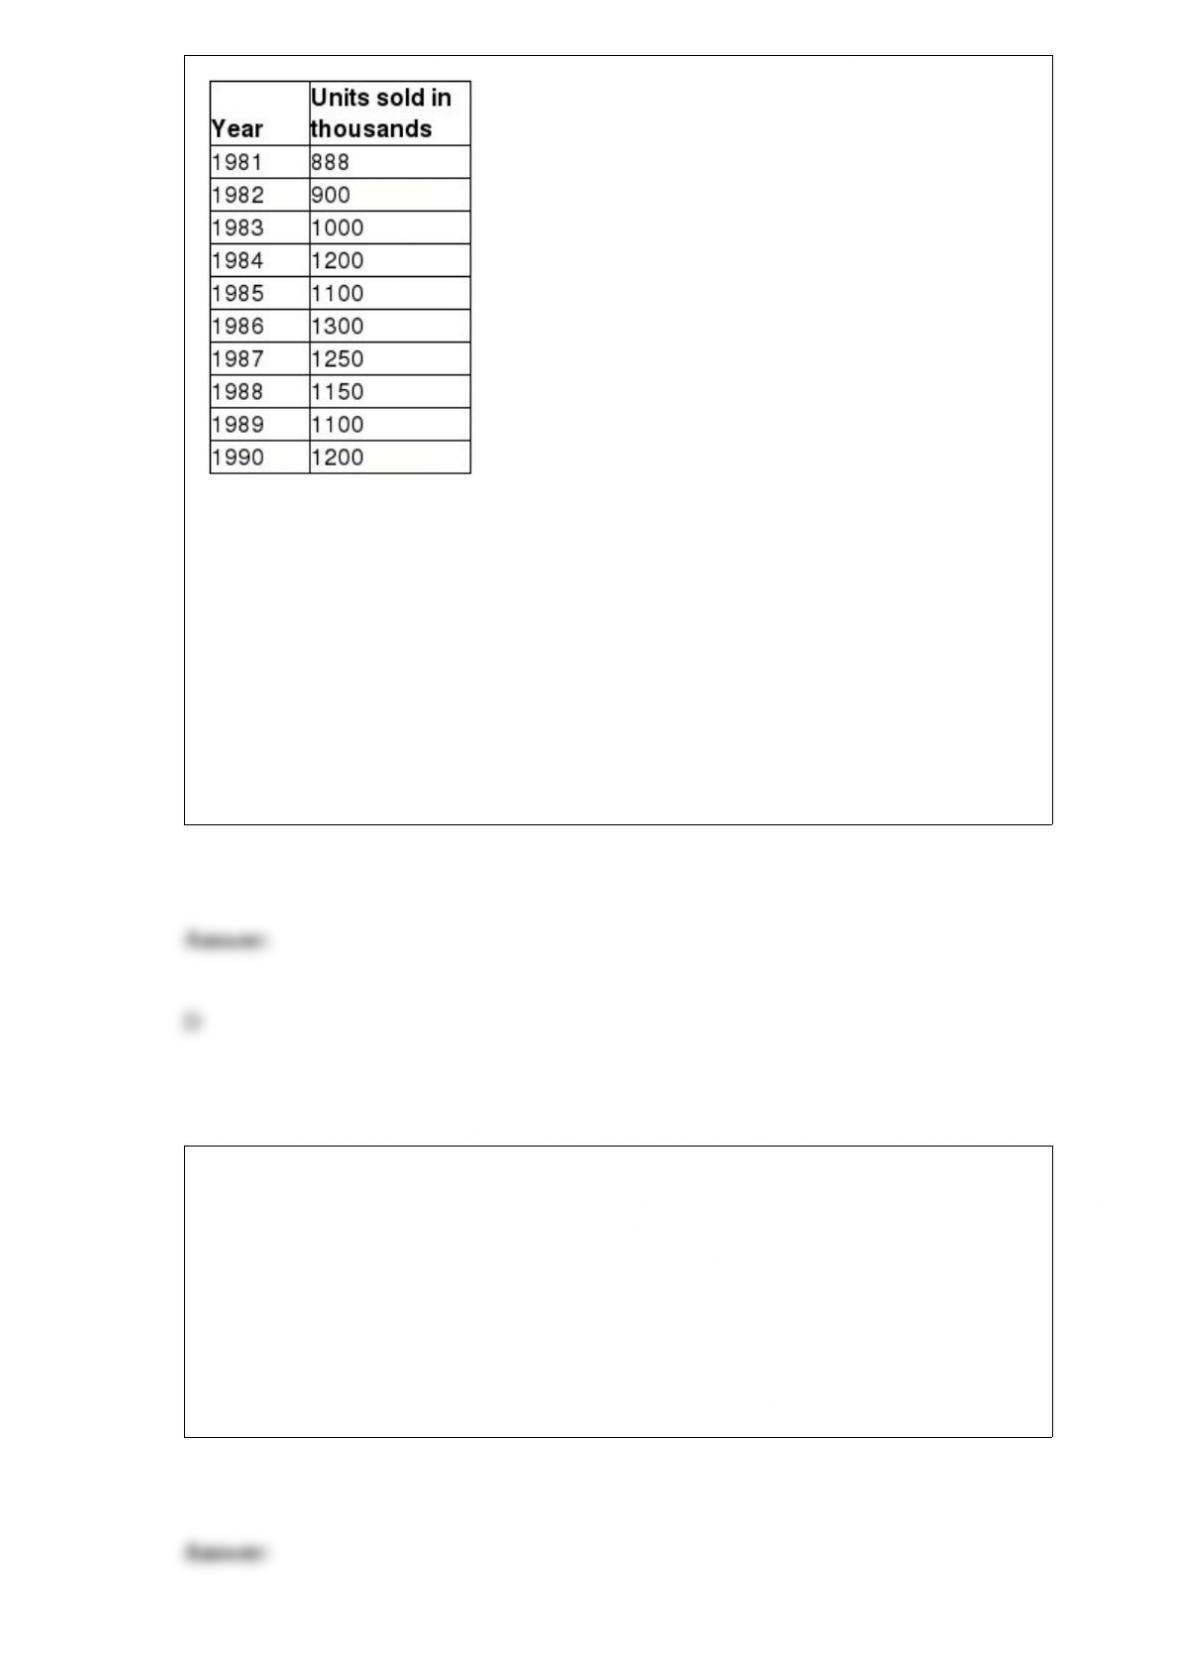
Identify the value of the mean square error using double exponential smoothing for the
given set of data.
A) 8.10
B) 1.80
C) 91.27
D) 11976.17
Type II error occurs when the test:
A) correctly fails to reject an actually true null hypothesis.
B) incorrectly fails to reject an actually false null hypothesis.
C) correctly rejects an actually false null hypothesis.
D) incorrectly rejects an actually true null hypothesis.
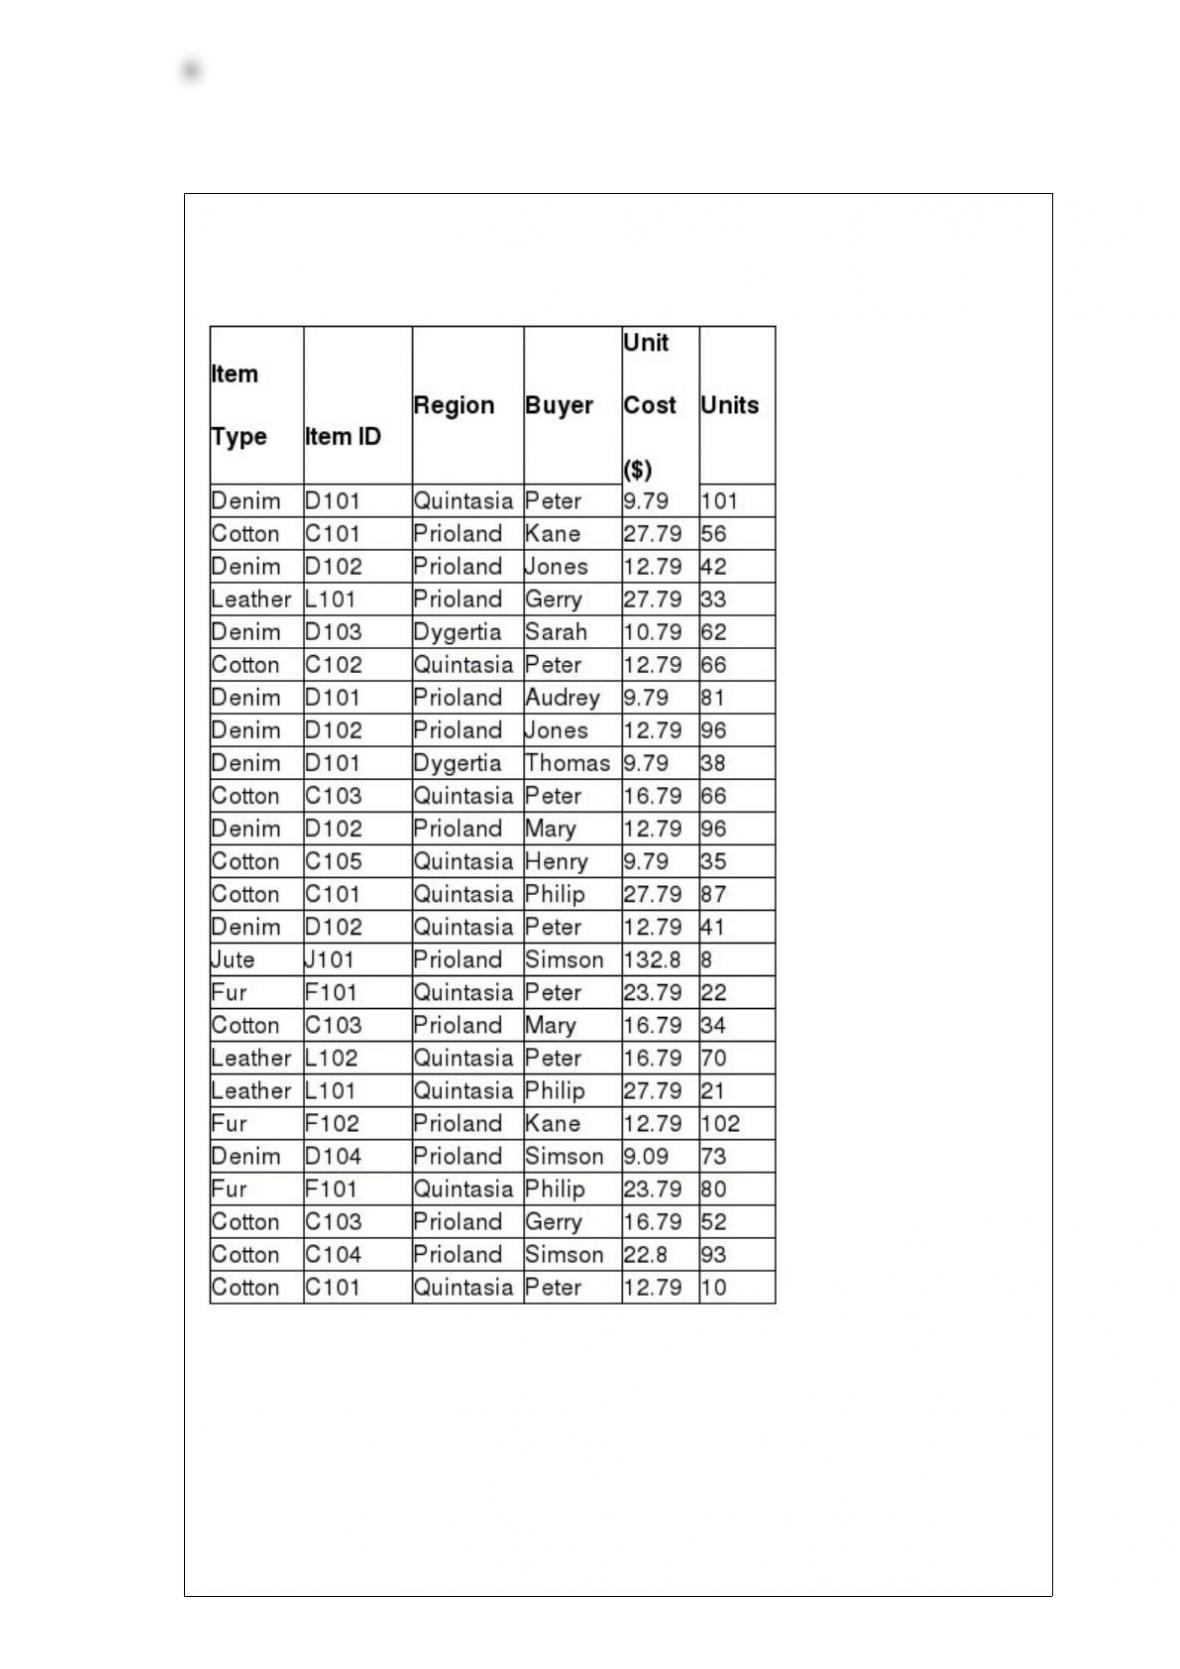
Following is the Sales database of Pointler’s Inc., a manufacturer of clothing material.
Use Excel to identify the buyer who made the highest single purchase of cotton (in
terms of sales revenue for Pointler’s Inc.) in Quintasia.
A) Peter
B) Henry
C) Philip
D) Simson
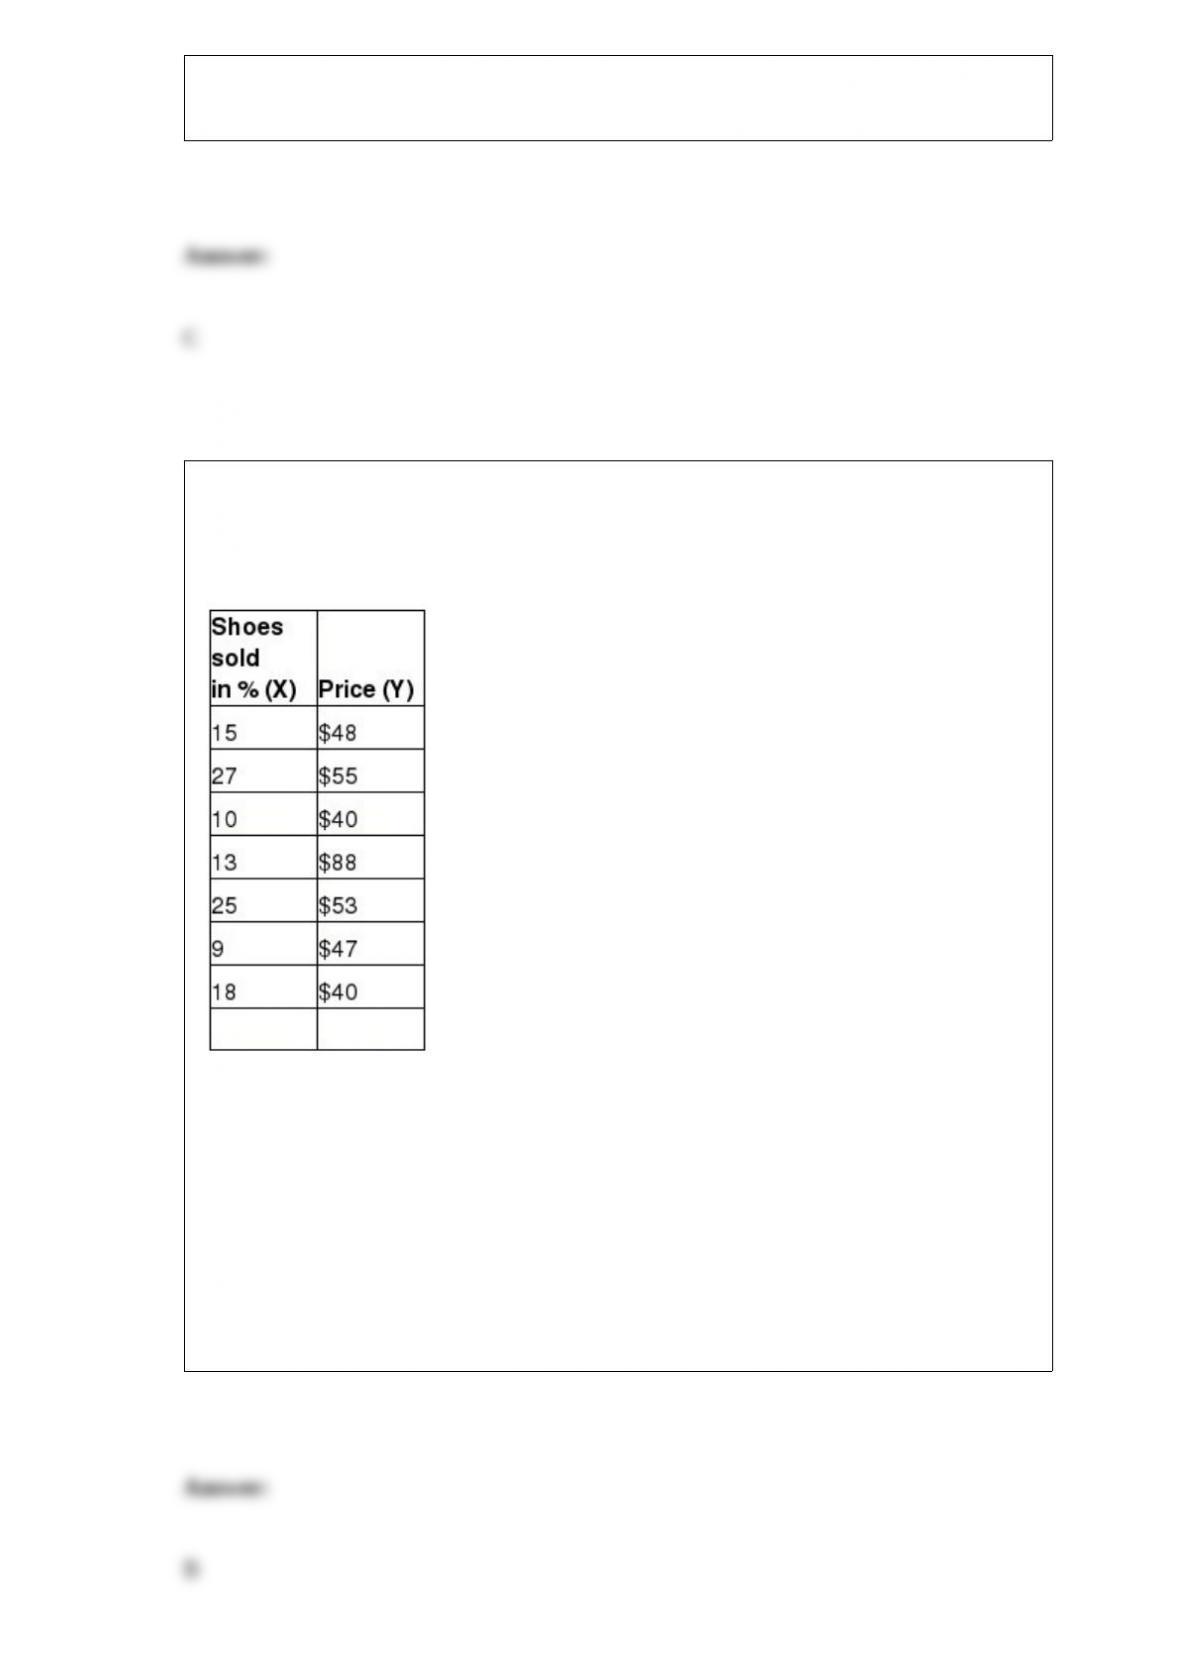
Below is the table showing rate of shoes sold per day and the highest-priced shoe sold
that day for a one-week period. The rate of shoes sold per day (X) and the price of the
shoes (Y).
Use Excel to calculate the standard deviation for Y.
A) 49.57
B) 16.47
C) 7.04
D) 2.6
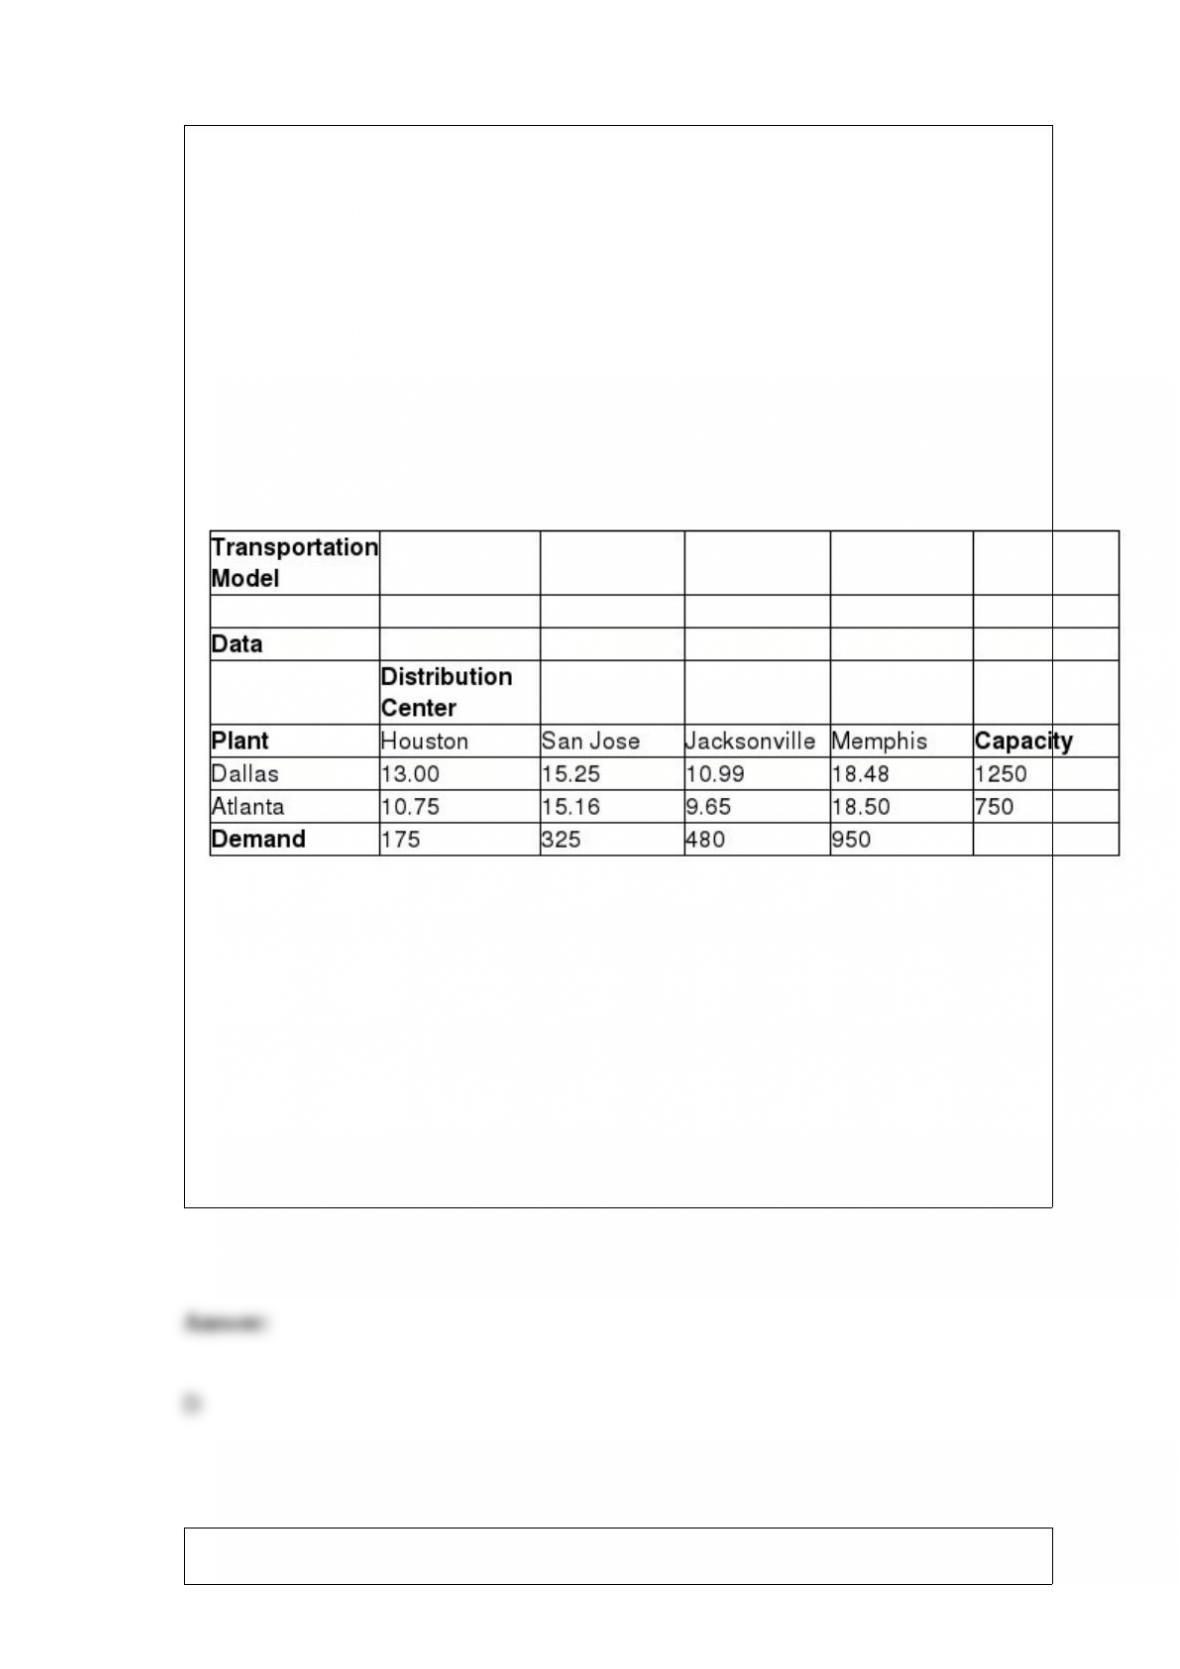
The Riviera Transport Company (RTC) produces car accessories at two plants: Dallas
and Atlanta. They ship them to major distribution centers in Houston, San Jose,
Jacksonville, and Memphis. The accounting, production, and marketing departments
have provided the information in the table below, which shows the unit cost of shipping
between any plant and distribution center, plant capacities over the next planning
period, and distribution center demands. RTC’s supply chain manager faces the problem
of determining how much to ship between each plant and distribution center to
minimize the total transportation cost, not exceed available capacity, and meet customer
demand.
Assume Xij = amount shipped from plant i to distribution center j, where i = 1
represents Dallas, i = 2 represents Atlanta, j = 1 represents Houston, and so on.
From the Sensitivity Report on the model, to which of the following cities can Atlanta
not ship to without reducing unit cost of production?
A) Houston
B) San Jose
C) Jacksonville
D) Memphis
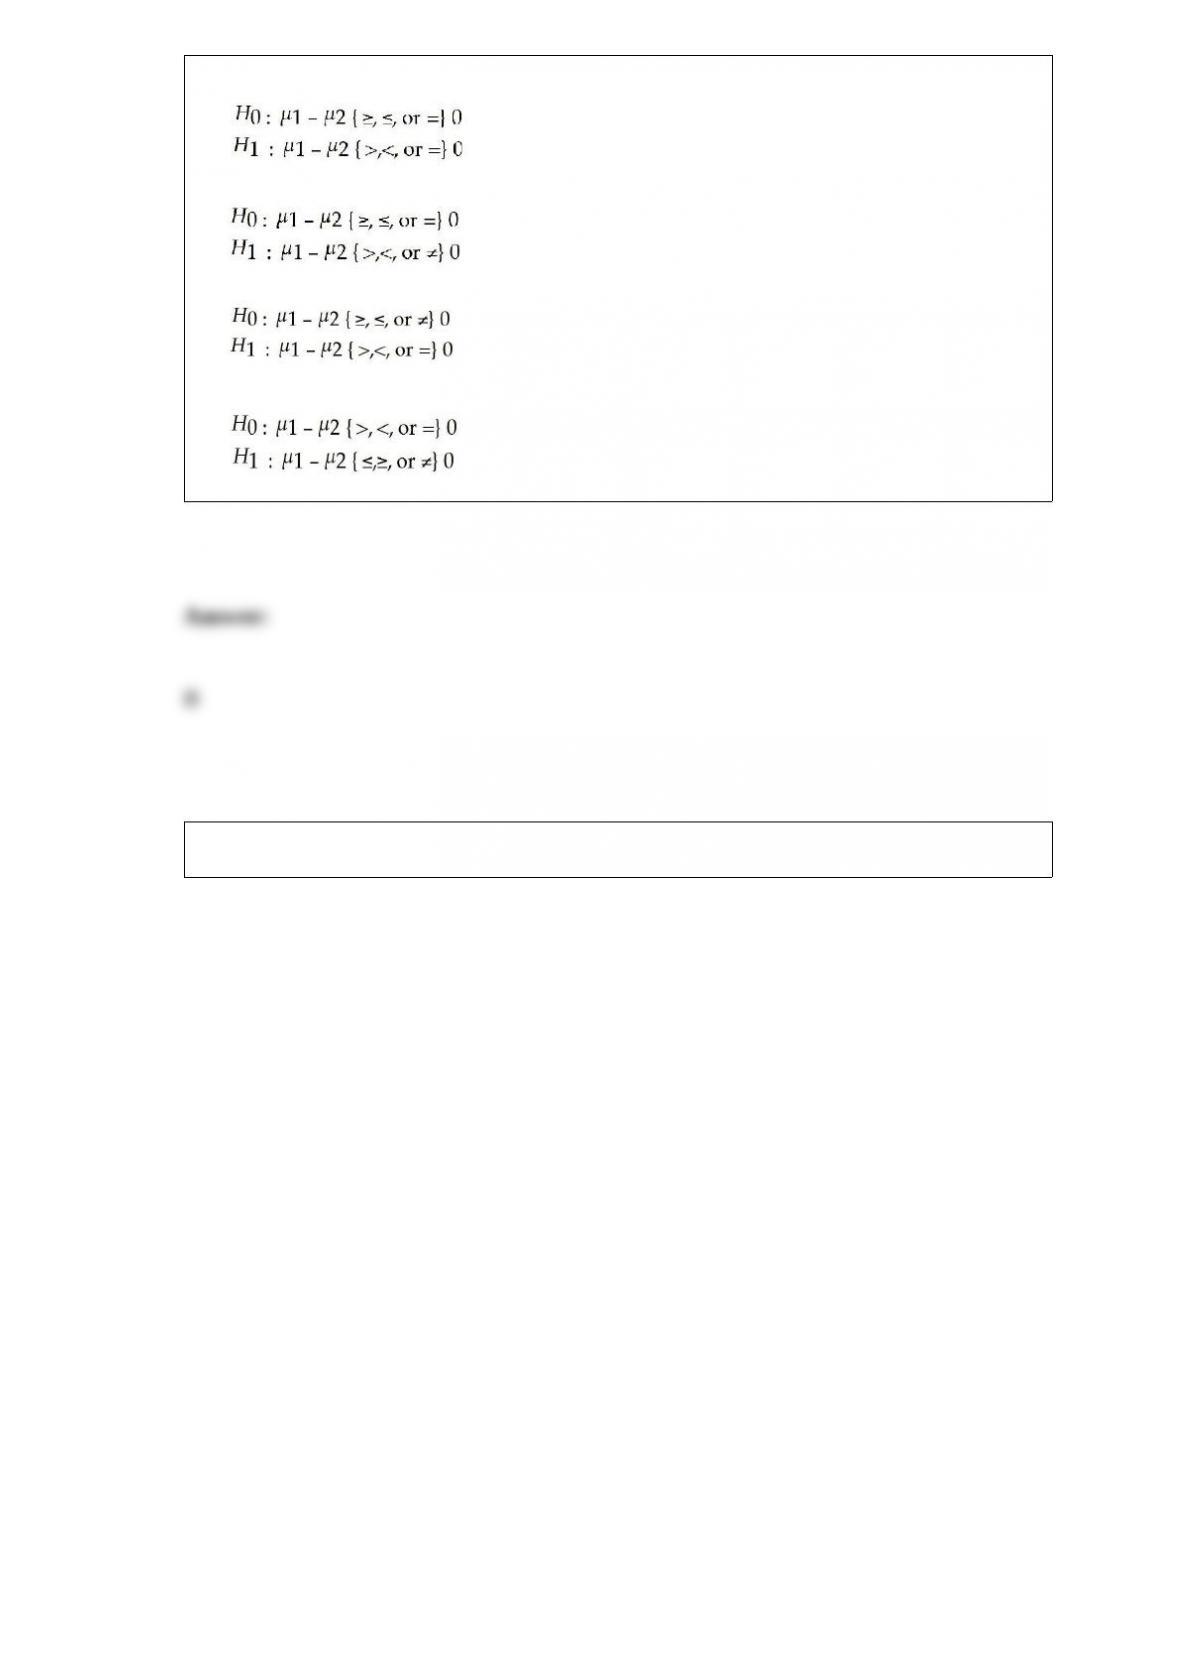
In a two-sample test for differences in means, the hypotheses are of the form:
A)
B)
C)
D)
Below is the spreadsheet for a project selection model:
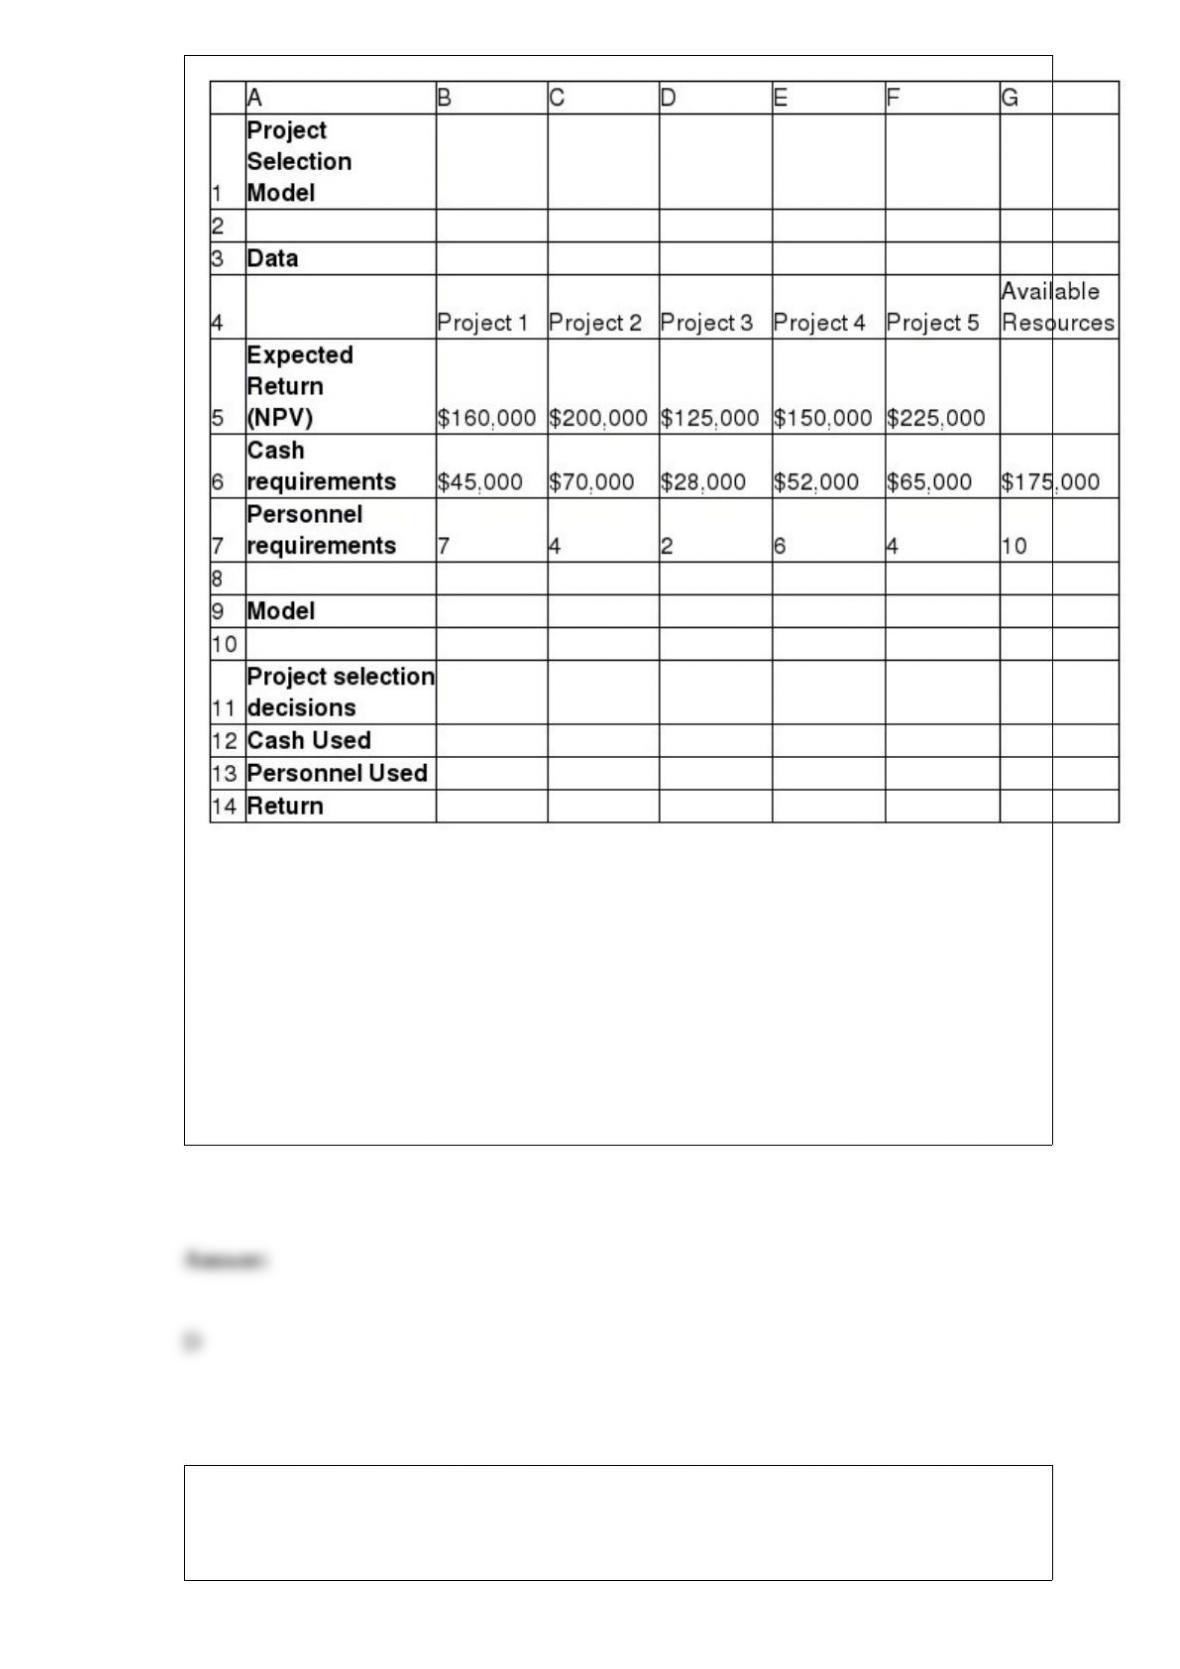
What is the amount of cash used for Project 2?
A) $ 105,000
B) $ 25,000
C) $ 115,000
D) $ 70,000
Below is the table showing rate of shoes sold per day and the highest-priced shoe sold
that day for a one-week period. The rate of shoes sold per day (X) and the price of the
shoes (Y).
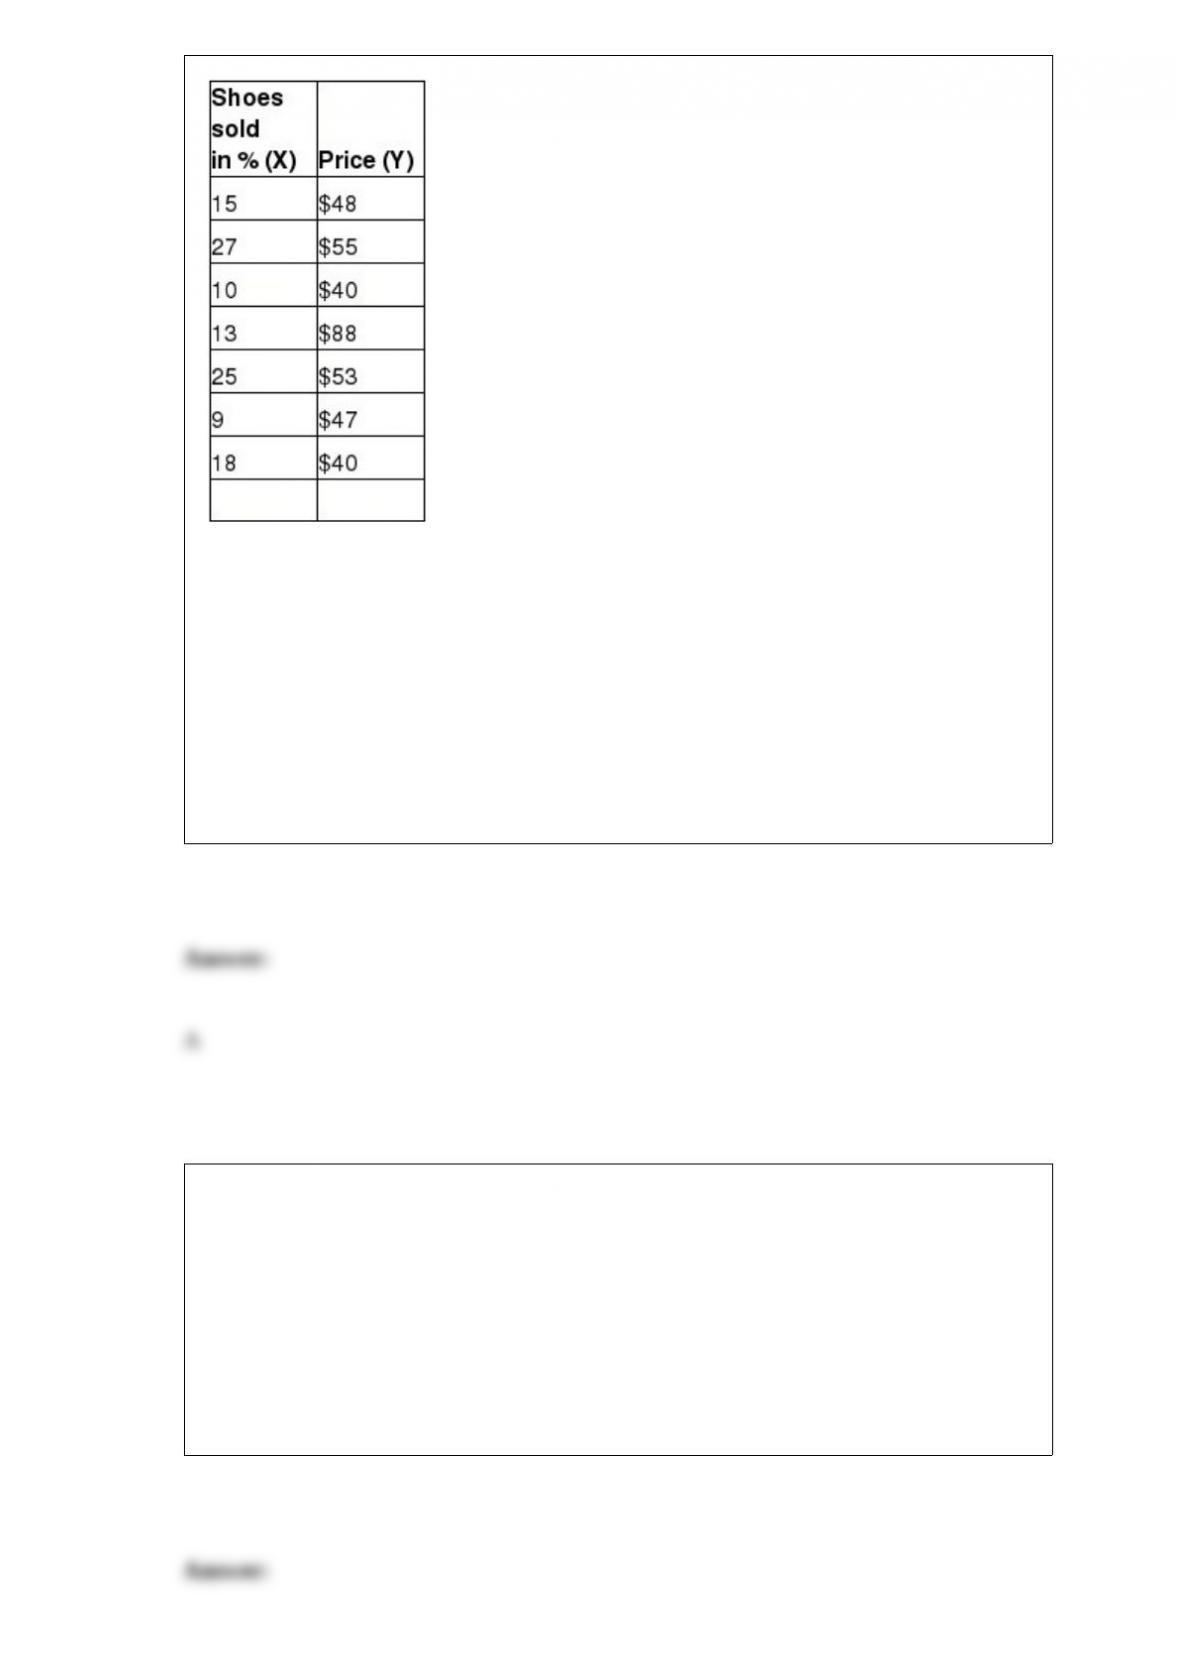
Use Excel to calculate the coefficient of variation of X.
A) 0.42
B) 0.31
C) 7.04
D) 16.47
Which of the following is a disadvantage of ordinal data?
A) They bear no relationship to one another.
B) They have no fixed units of measurement.
C) They have no natural zero.
D) They are not comparable with each other.
In a lower one -tailed hypothesis test, chosen level of significance = 0.10, sample size =
55, and t-test statistic = -1.76.
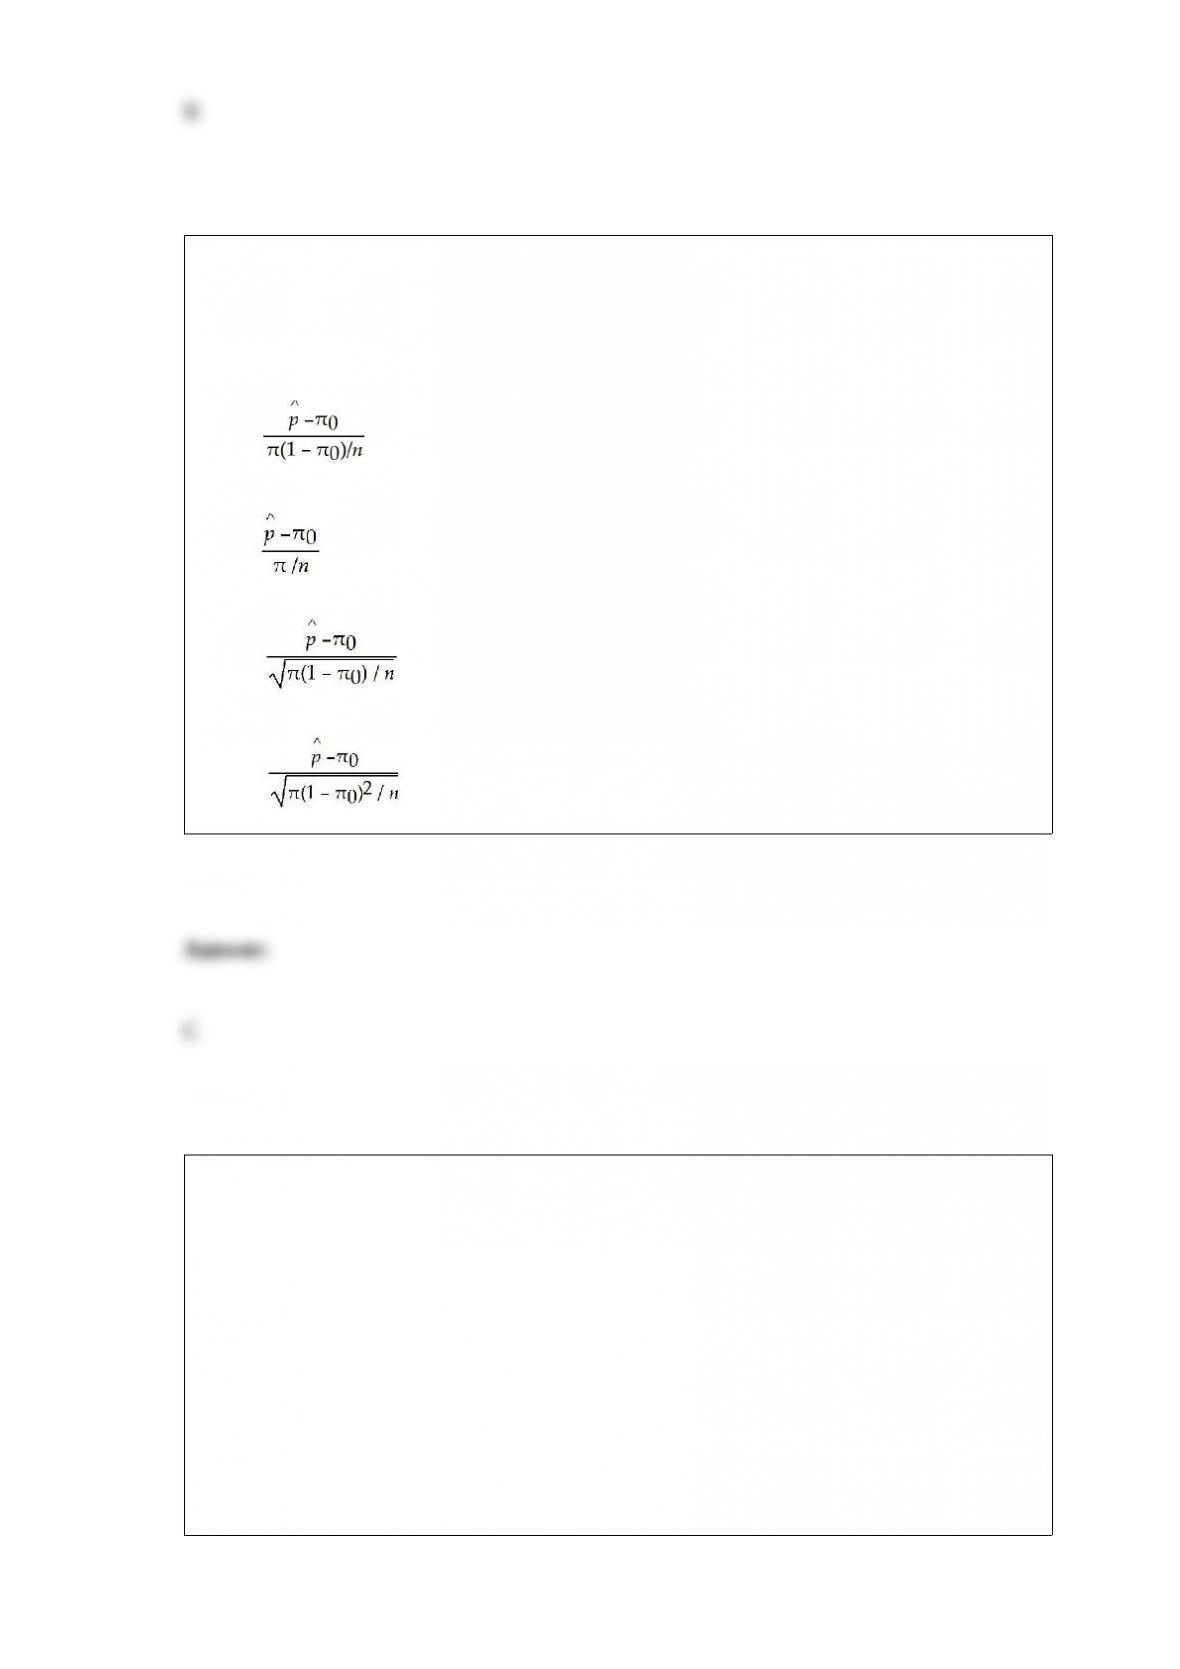
Which of the following computes the test statistic for a one-sample test for proportions?
A) z =
B) z =
C) z =
D) z =
Remington Textiles has a mill that produces three types of fabrics on a make-to-order
basis. The mill operates on a 24/7 basis. The key decision facing the plant manager is
about the type of loom needed to process each fabric during the coming 12 weeks to
meet demands for the three fabrics and not exceed the capacity of the looms in the mill.
Two types of looms are used: Jaquard and Northrop. Jaquard looms can be used to
make all fabrics and are the only looms that can weave certain fabrics, such as plaids.
Demands, variable costs for each fabric, and production rates on the looms are given in
the table below. The mill has 10 Northrop looms and 2 Jaquard looms. Any fabrics that
cannot be woven in the mill because of limited capacity will be purchased from an
external supplier, finished at the mill, and sold at the selling price. In addition to
determining which looms to use to process the fabrics, the manager also needs to
determine which fabrics to buy externally.
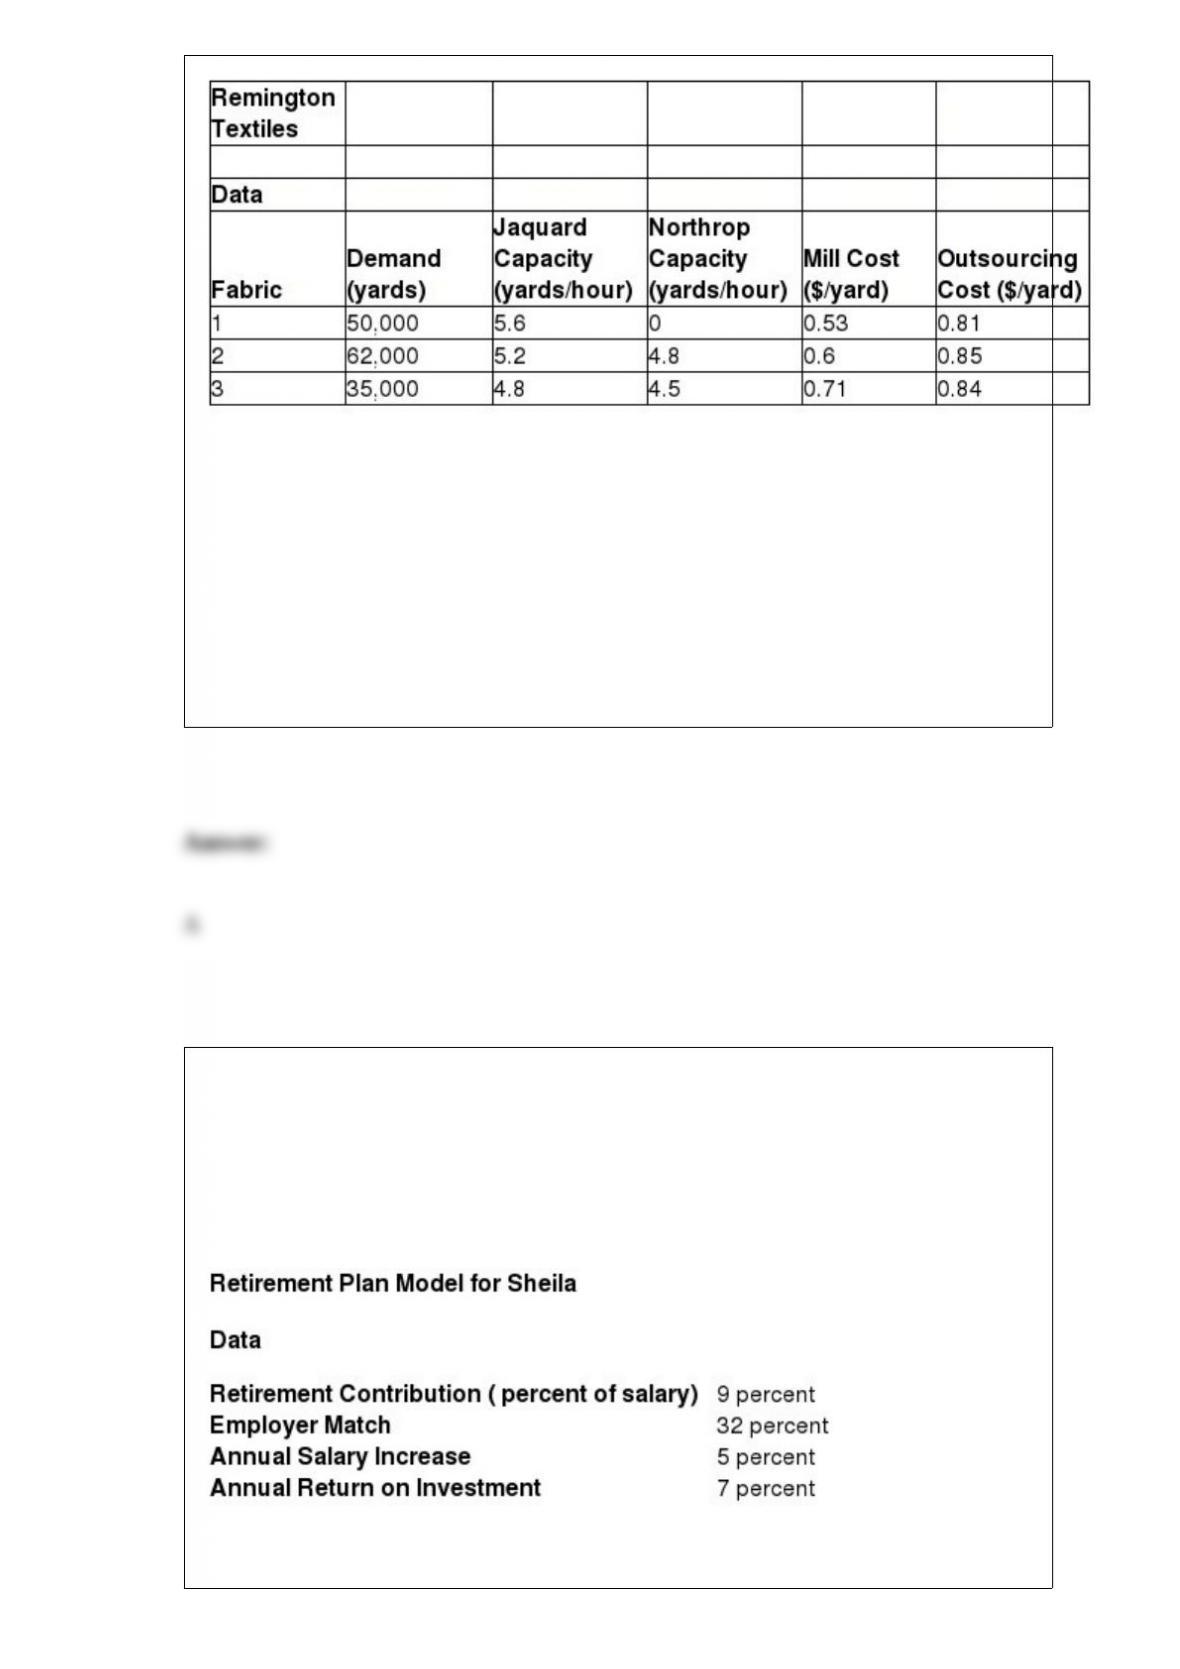
According to the model, what is the total amount of Fabric 3 to be purchased?
A) 2,405
B) 0
C) 32,595
D) 35,000
Sheila joined Simsin Tradings at the age of 36 with a starting salary of $ 75,000. She
expects a salary increase of 5 percent every year. Her retirement plan requires her to
pay 9 percent of her salary, while the company matches it at 32 percent. She expects an
annual return of 7 percent on her retirement portfolio. Using a predictive model for
Sheila’s first five years, calculate the following, assuming that the salary increases at the
same rate every year, and the return of interest does not change.
What will be the amount of employee contribution to retirement plan when Sheila has
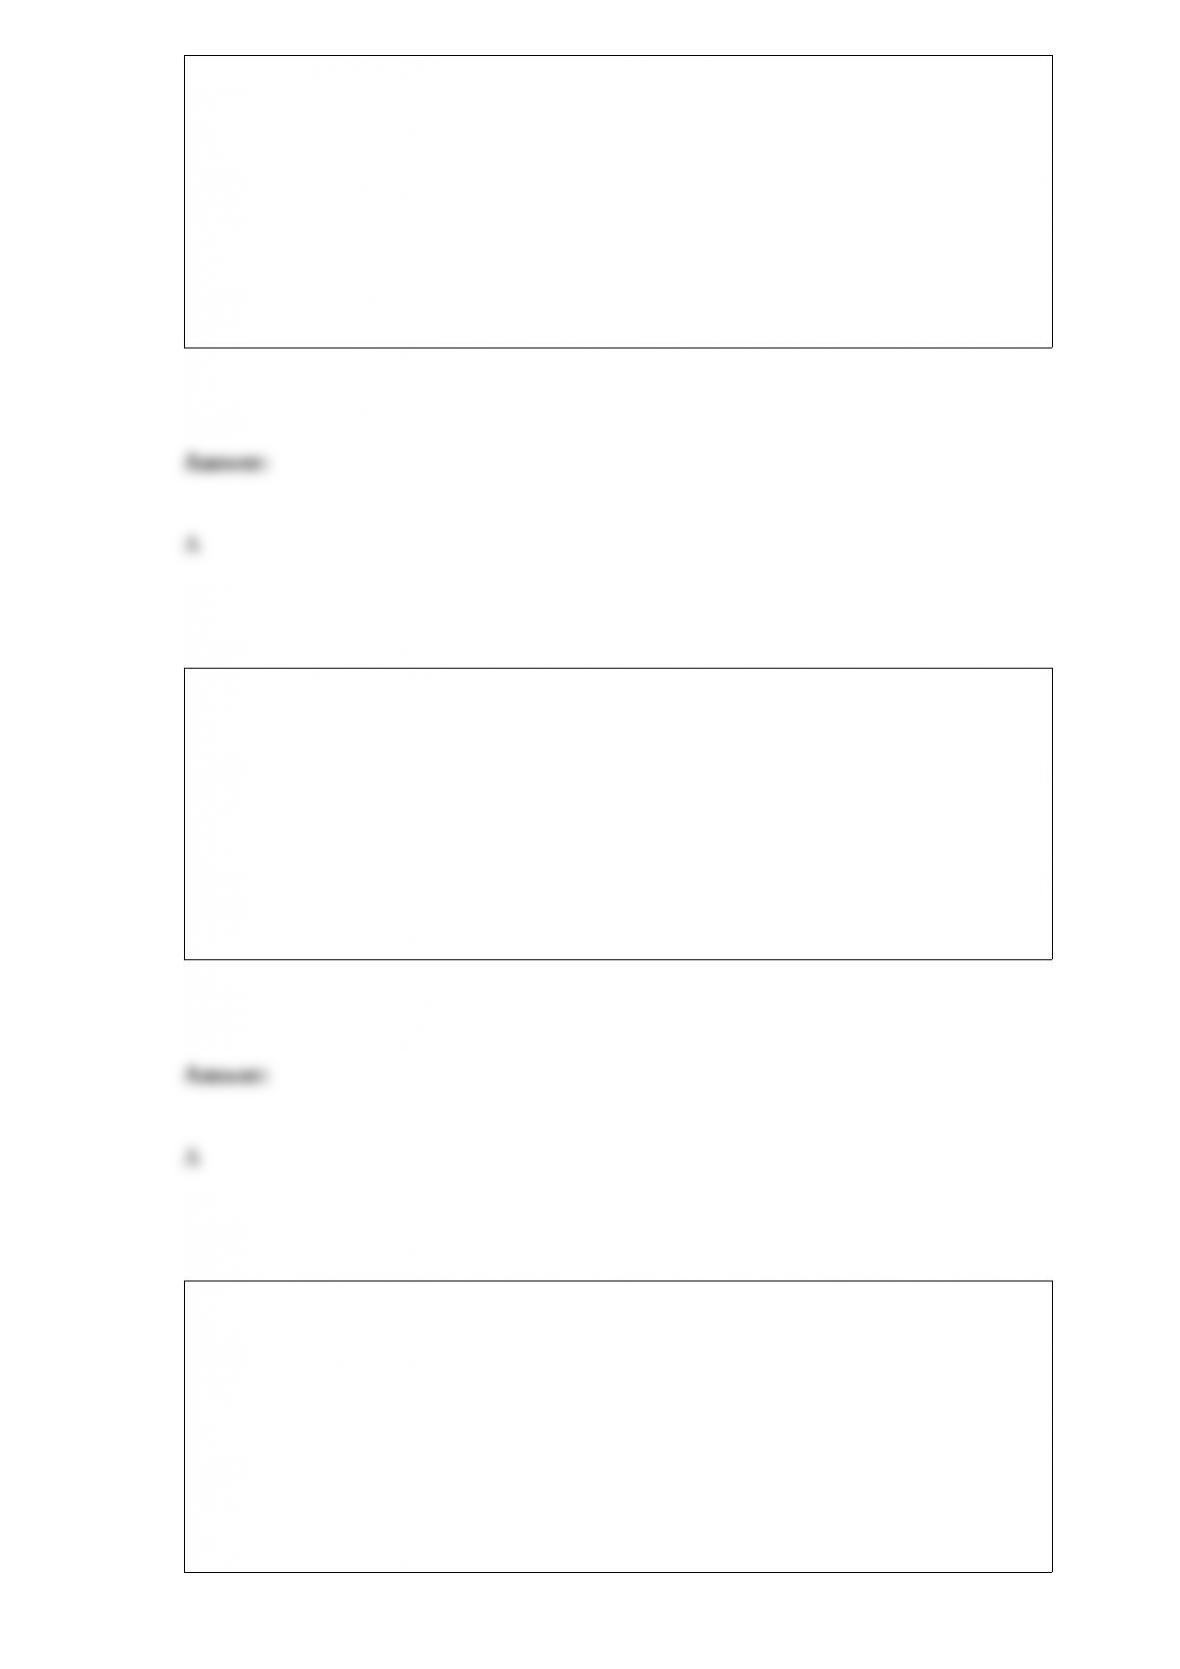
reached the age of 38?
A) $7,441.88
B) $7,813.97
C) $24,450
D) $2381.40
Which of the following describes dispersion in statistics?
A) the degree of variation in the data
B) the central value in the data
C) the frequency of values in the data
D) the measure of outliers in the data
Which of the following is a valid one-sample hypothesis test?
A) H0: population parameter ≠constant vs. H1: population parameter = constant
B) H0: population parameter > constant vs. H1: population parameter ≤ constant
C) H0: population parameter < constant vs. H1: population parameter ≥ constant
D) H0: population parameter = constant vs. H1: population parameter ≠constant
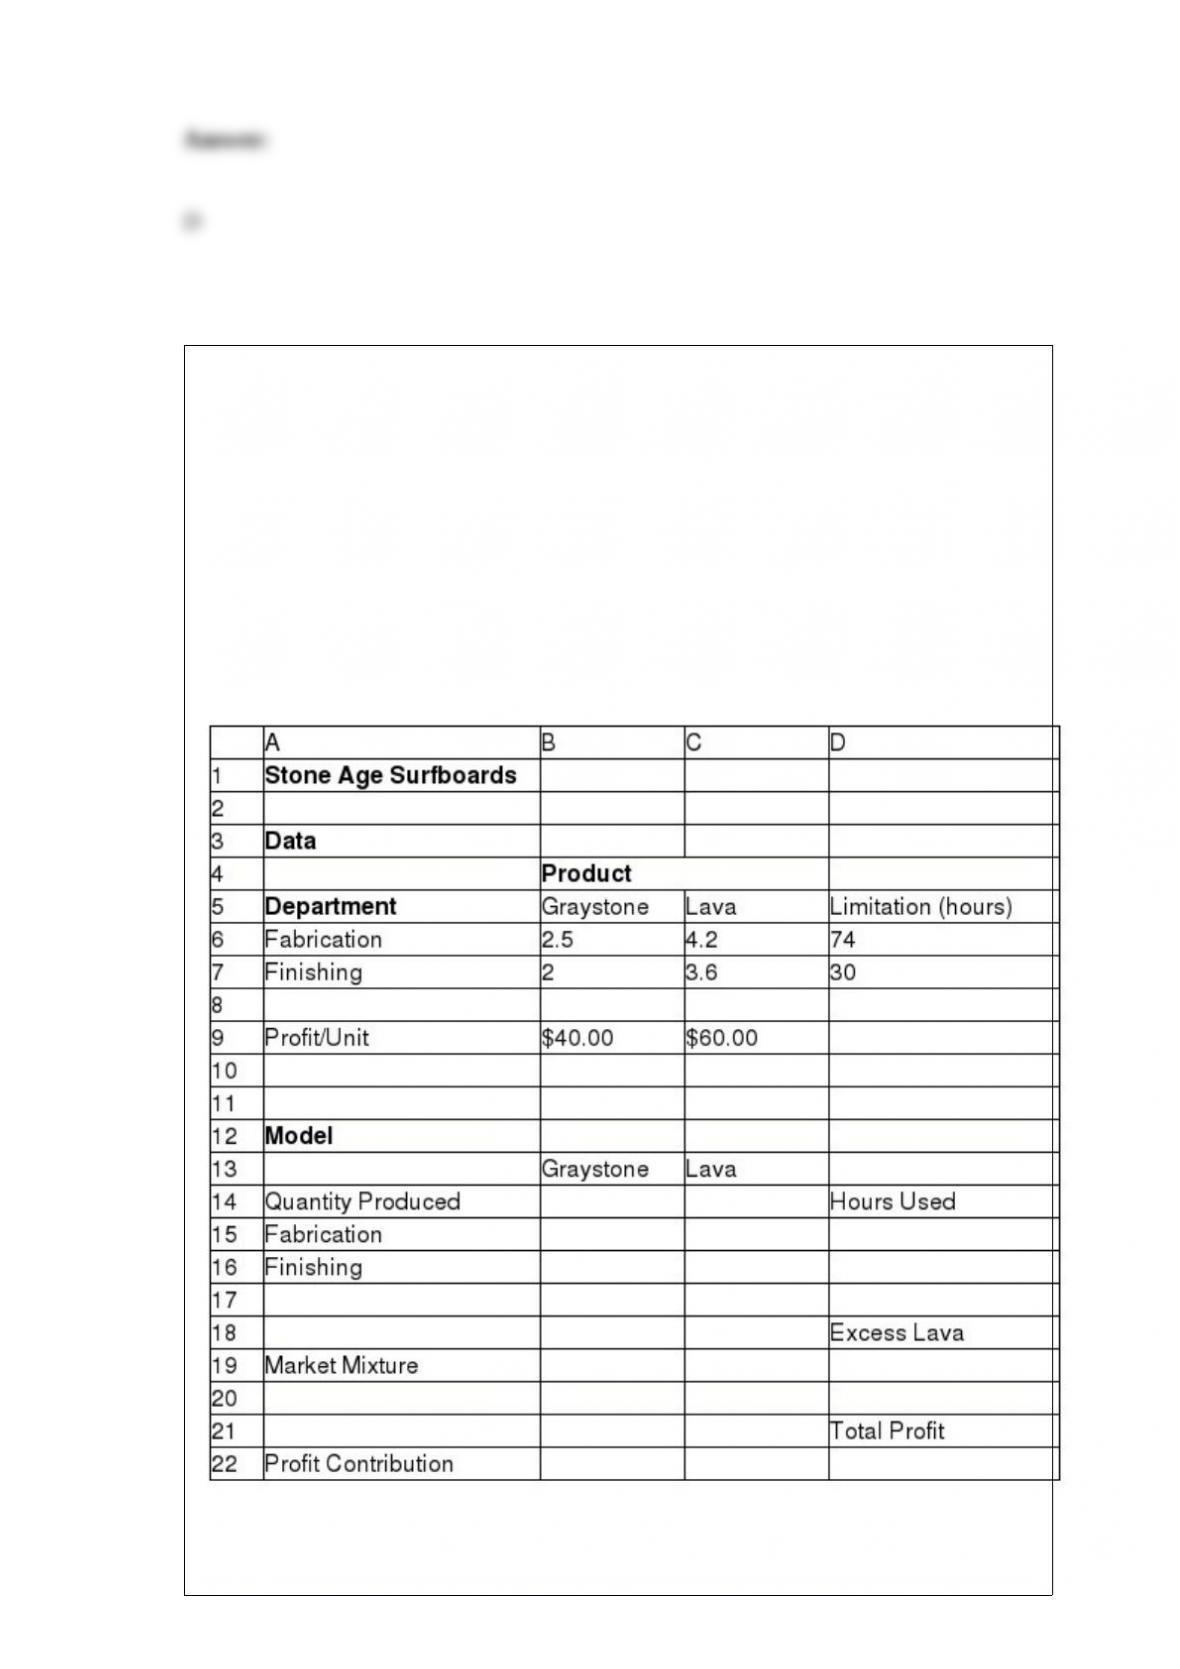
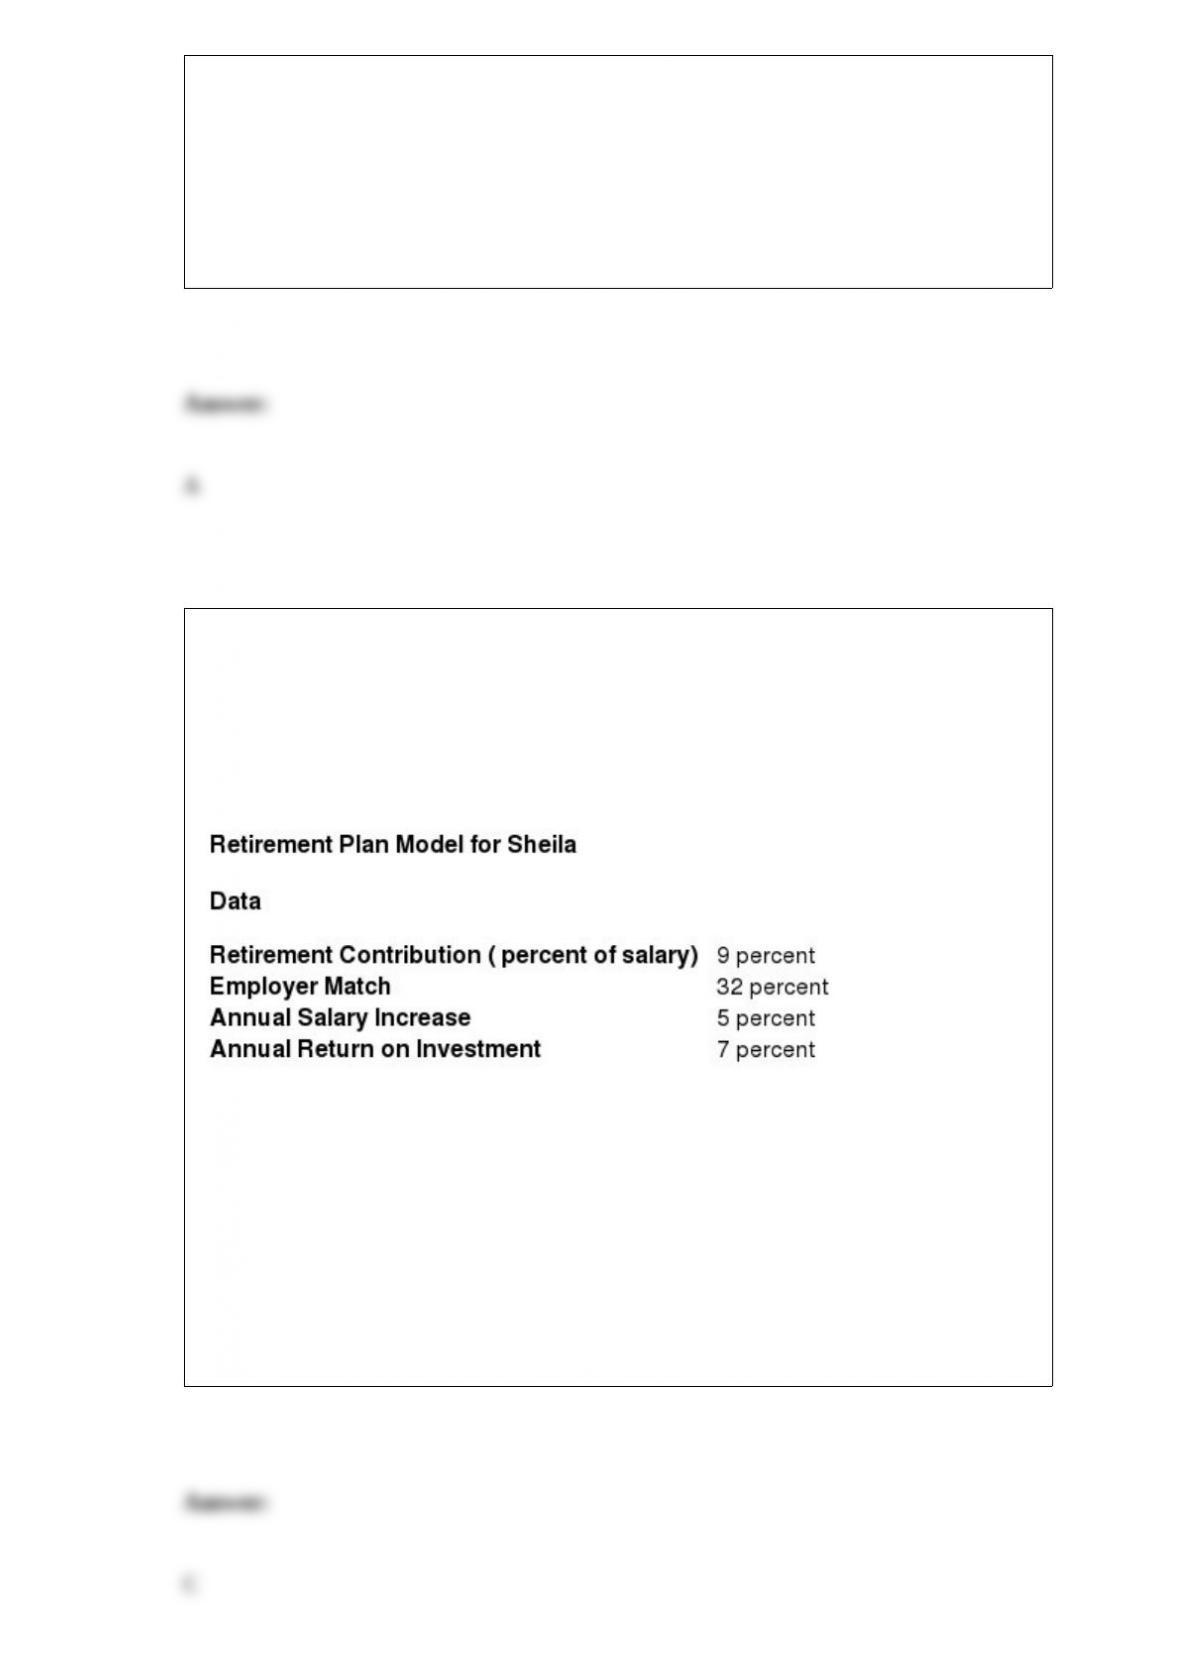
Stone Age Surfboards is a small manufacturer of two types of popular low-tide
surfboards, the Graystone and the Lava models. The manufacturing process consists of
two departments: fabrication and finishing. The fabrication department has 8 skilled
workers, each of whom works 9.25 hours per day. The finishing department has 5
workers, each of whom works a 6 -hour shift per day. Each pair of Graystone
surfboards requires 2.5 labor hours in the fabrication department and 2 labor hours in
finishing. The Lava model requires 4.2 labor-hours in fabrication and 3.6 labor-hours in
finishing. The company operates 6 days a week. It makes a per unit profit of $40 on the
Graystone model and $60 on the Lava model. The company anticipates selling at least
twice as many Lava models as Graystone models.
What is the Allowable Increase in the finishing hours used?
A) 32.46
B) 8.33
C) 26.84
D) 16.67
Sheila joined Simsin Tradings at the age of 36 with a starting salary of $ 75,000. She
expects a salary increase of 5 percent every year. Her retirement plan requires her to
pay 9 percent of her salary, while the company matches it at 32 percent. She expects an
annual return of 7 percent on her retirement portfolio. Using a predictive model for
Sheila’s first five years, calculate the following, assuming that the salary increases at the
same rate every year, and the return of interest does not change.
What will be Sheila’s salary in her second year of work at Simsin?
A) $81,750
B) $82,688
C) $78,750
D) $ 75,000
A(n) ________ is also called a minimax regret strategy.
A) opportunity-loss strategy
B) aggressive strategy
C) conservative strategy
D) average payoff strategy
Belowisaspreadsheetofpurchaseordersfor acomputerhardwareretailer.
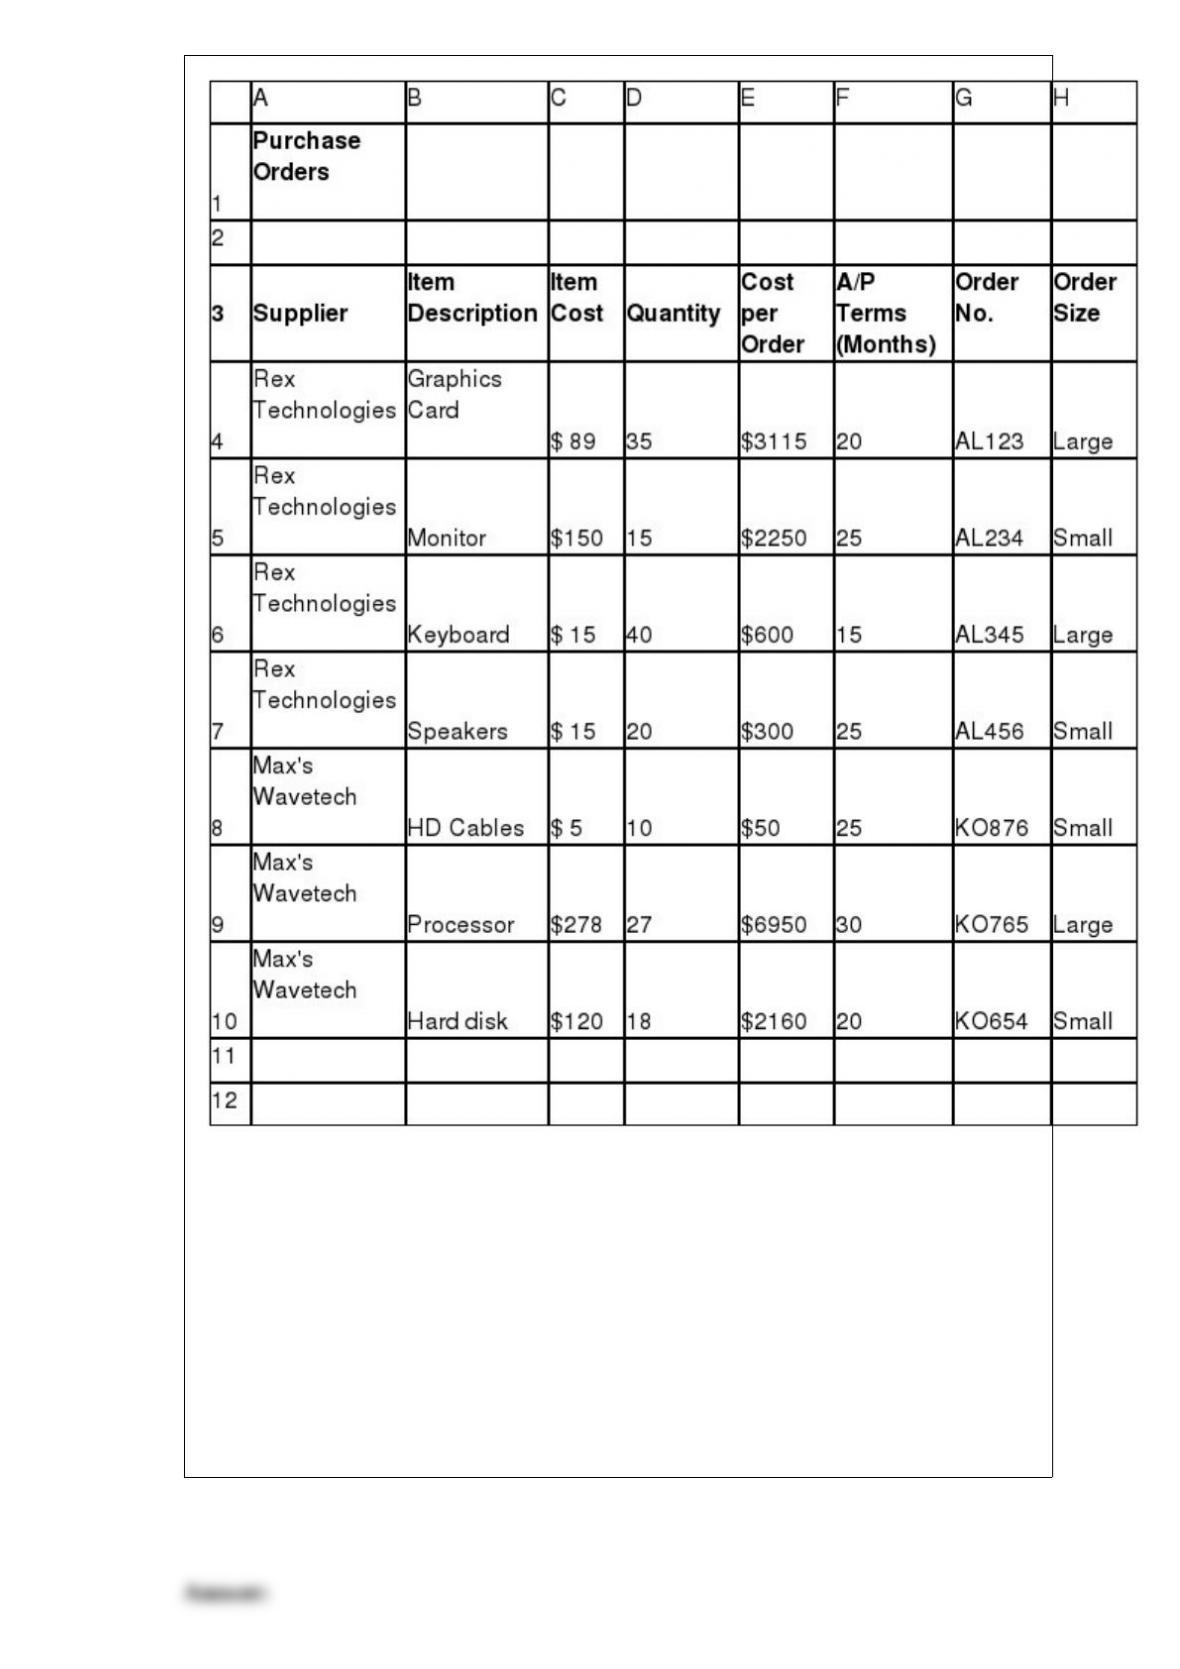
To find the largest quantity of items ordered from Rex Technologies, what Excel
formula should be used in A12?
A) =COUNTIF(D4:D10)
B) =SUM(D4:D7)
C) =MAX(D4:D7)
D) =COUNT(D4:D7)