6-1
Chapter 6
Answers to Review Problems
Finance For Executives – 4th Edition
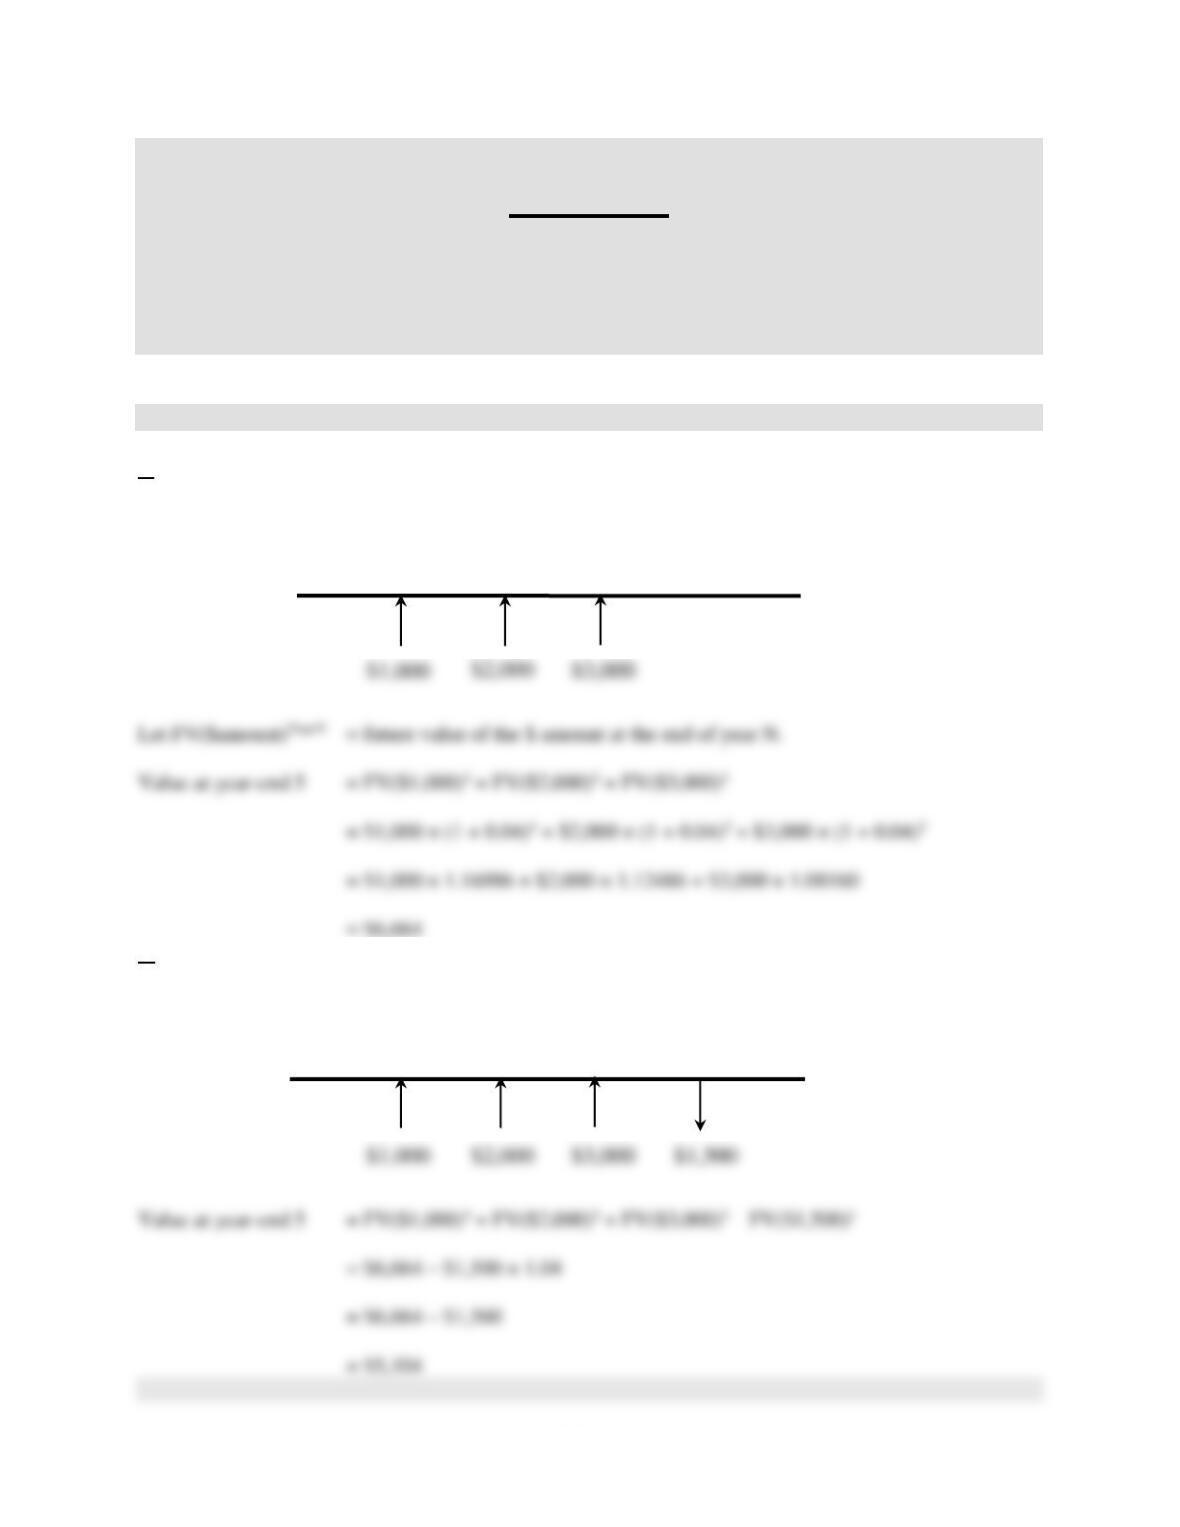
1. Future values.
a.
Time line:
b.
Time line:
1
4
3
2
5
0
1
4
3
2
5
0
6-2
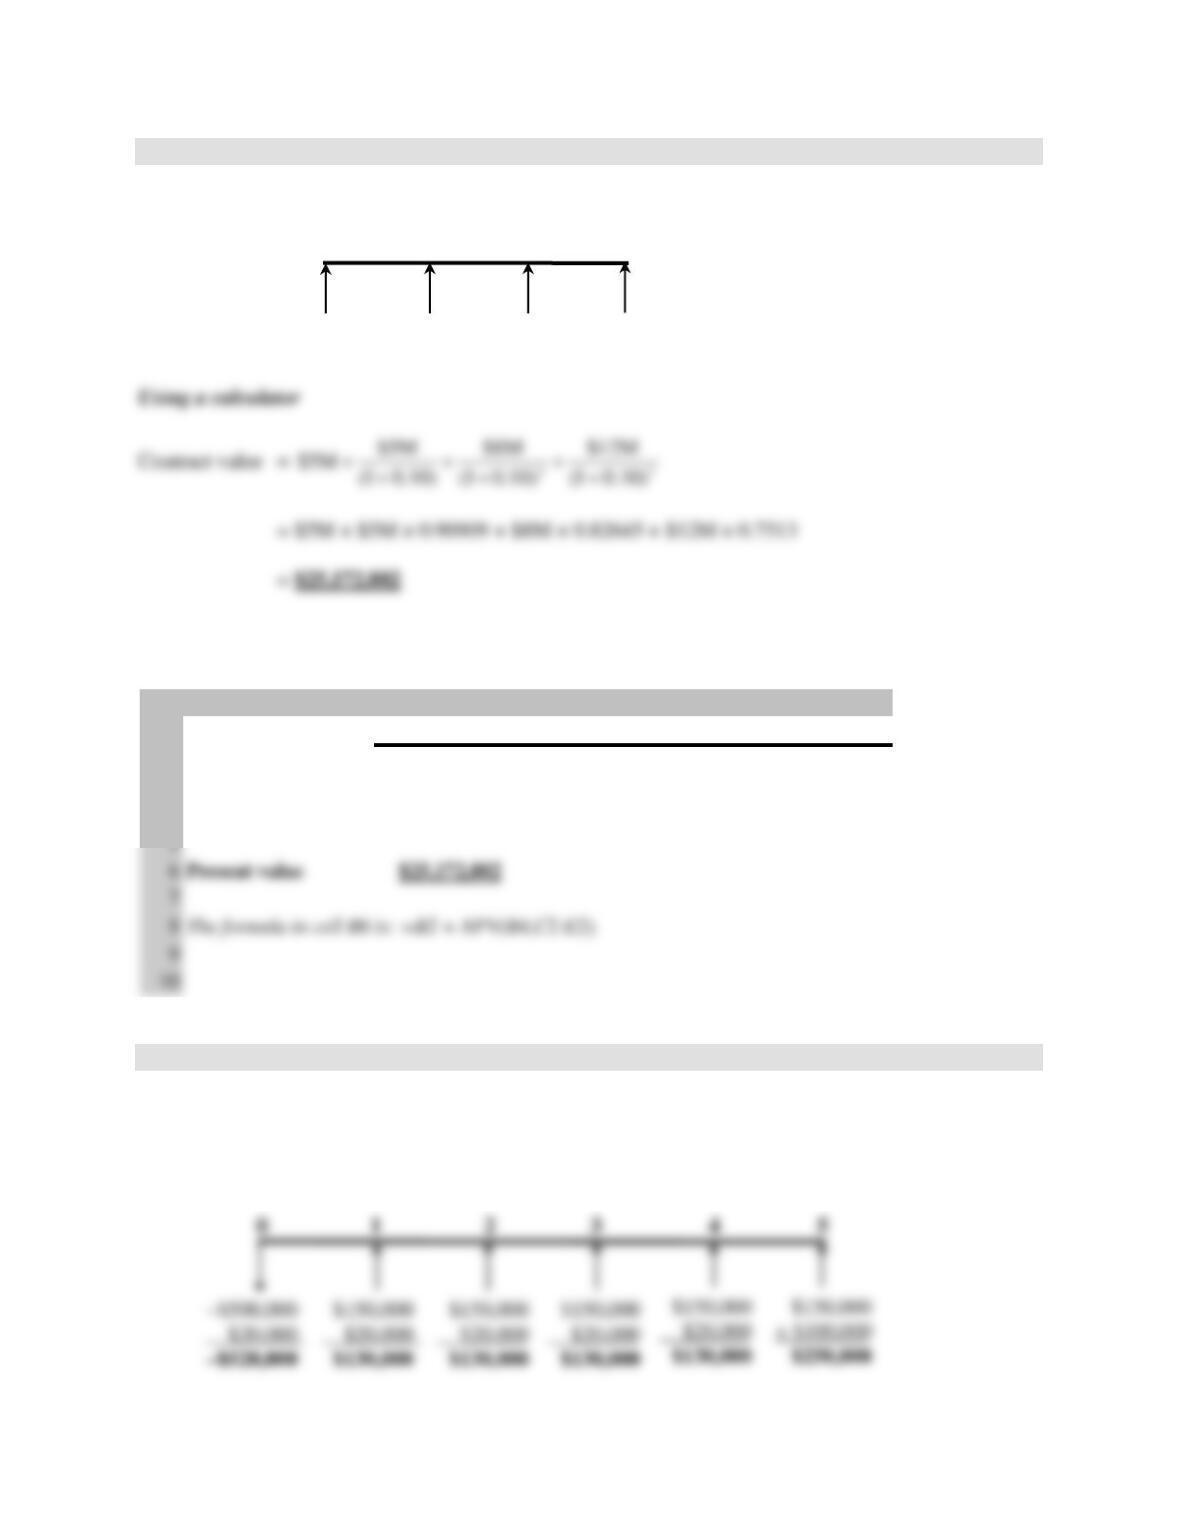
2. Present values.
Time line:
Using a spreadsheet
A B C D E
10 1 2 3
2 Cash flows $5,000,000 $5,000,000 $8,000,000 $12,000,000
3
4 Cost of capital 10.00%
1
4
3
2
5
0
3. Present values.
The investment is worth undertaking if its net present value is positive.
Time line:
1
3
2
0
$5M
$5M
$8M
$12M
6-3
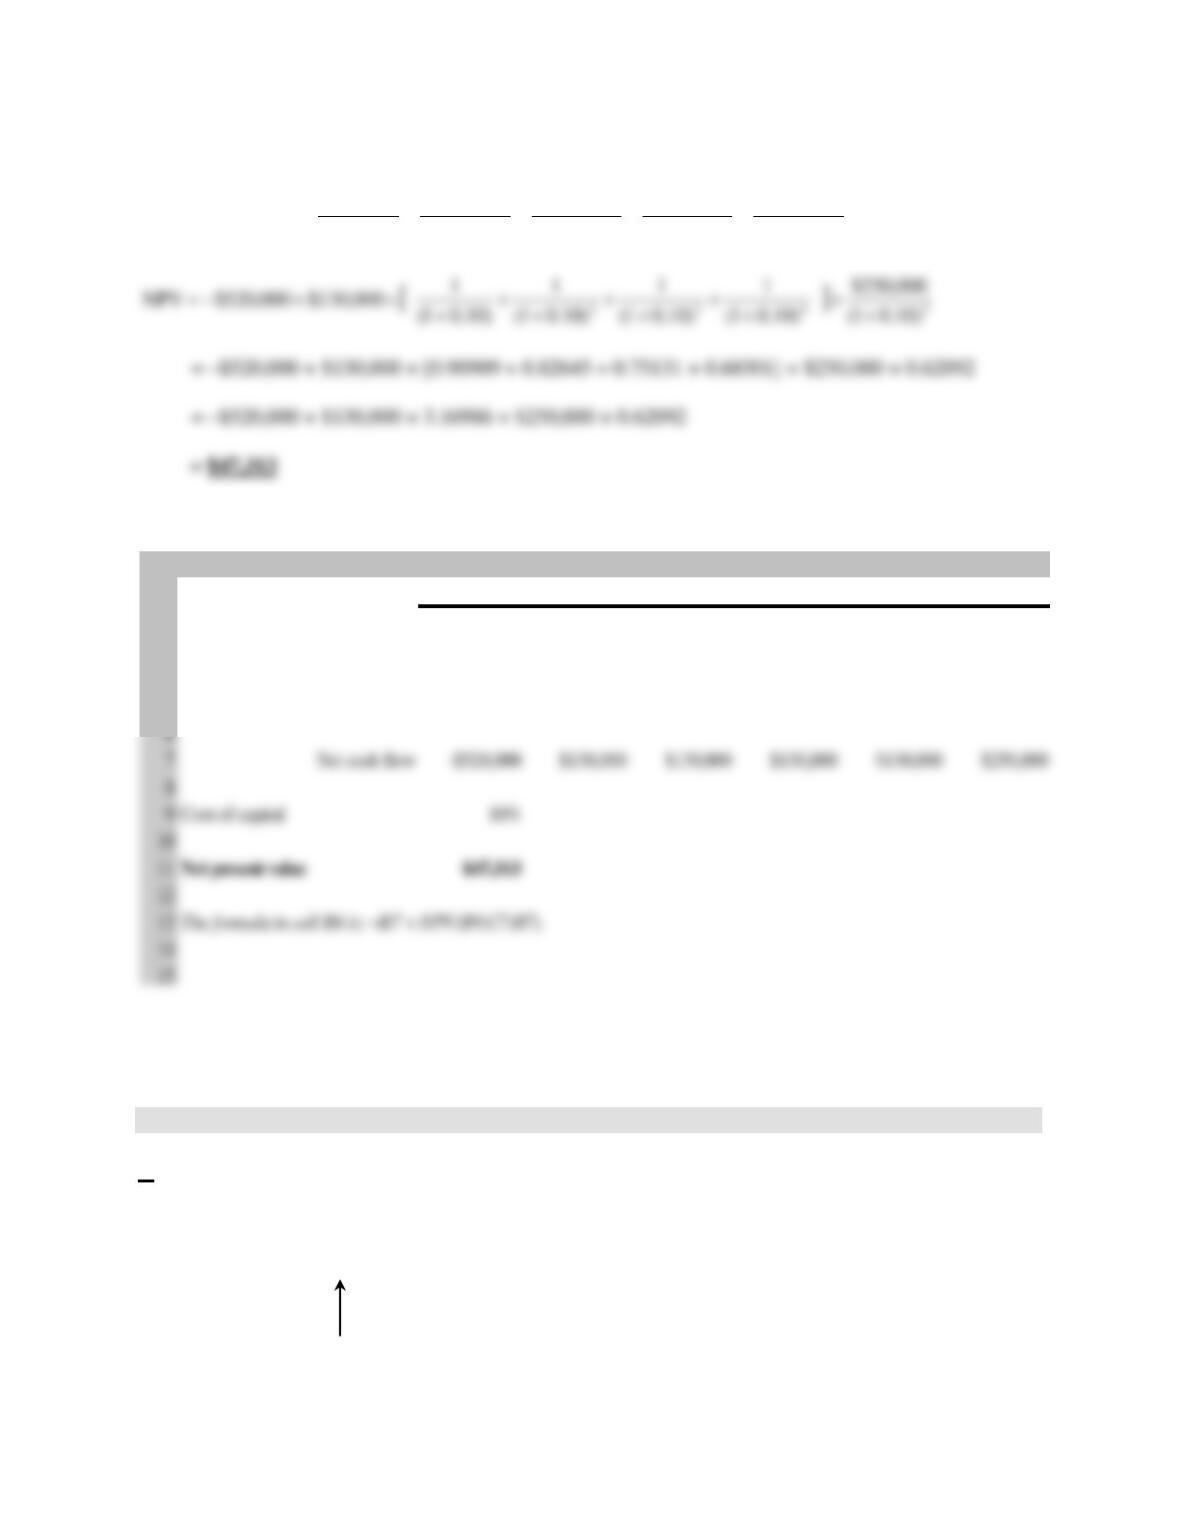
Using a calculator
5432 )10.01(
000,250$
)10.01(
000,130$
)10.01(
000,130$
)10.01(
000,130$
)10.01(
000,130$
000,520$NPV +
+
+
+
+
+
+
+
+
+−=
Using a spreadsheet
A B C D E F G
10 1 2 3 4 5
2 Purchase cost of the machine -$500,000
3 Net revenues $150,000 $150,000 $150,000 $150,000 $150,000
4 Resale value of machine $100,000
5 Maintenance costs -$20,000 -$20,000 -$20,000 -$20,000 -$20,000
NPV is positive, so the machine should be purchased.
4. Buying a car.
a.
Time line of No Better Deals offer:
0
$9,500
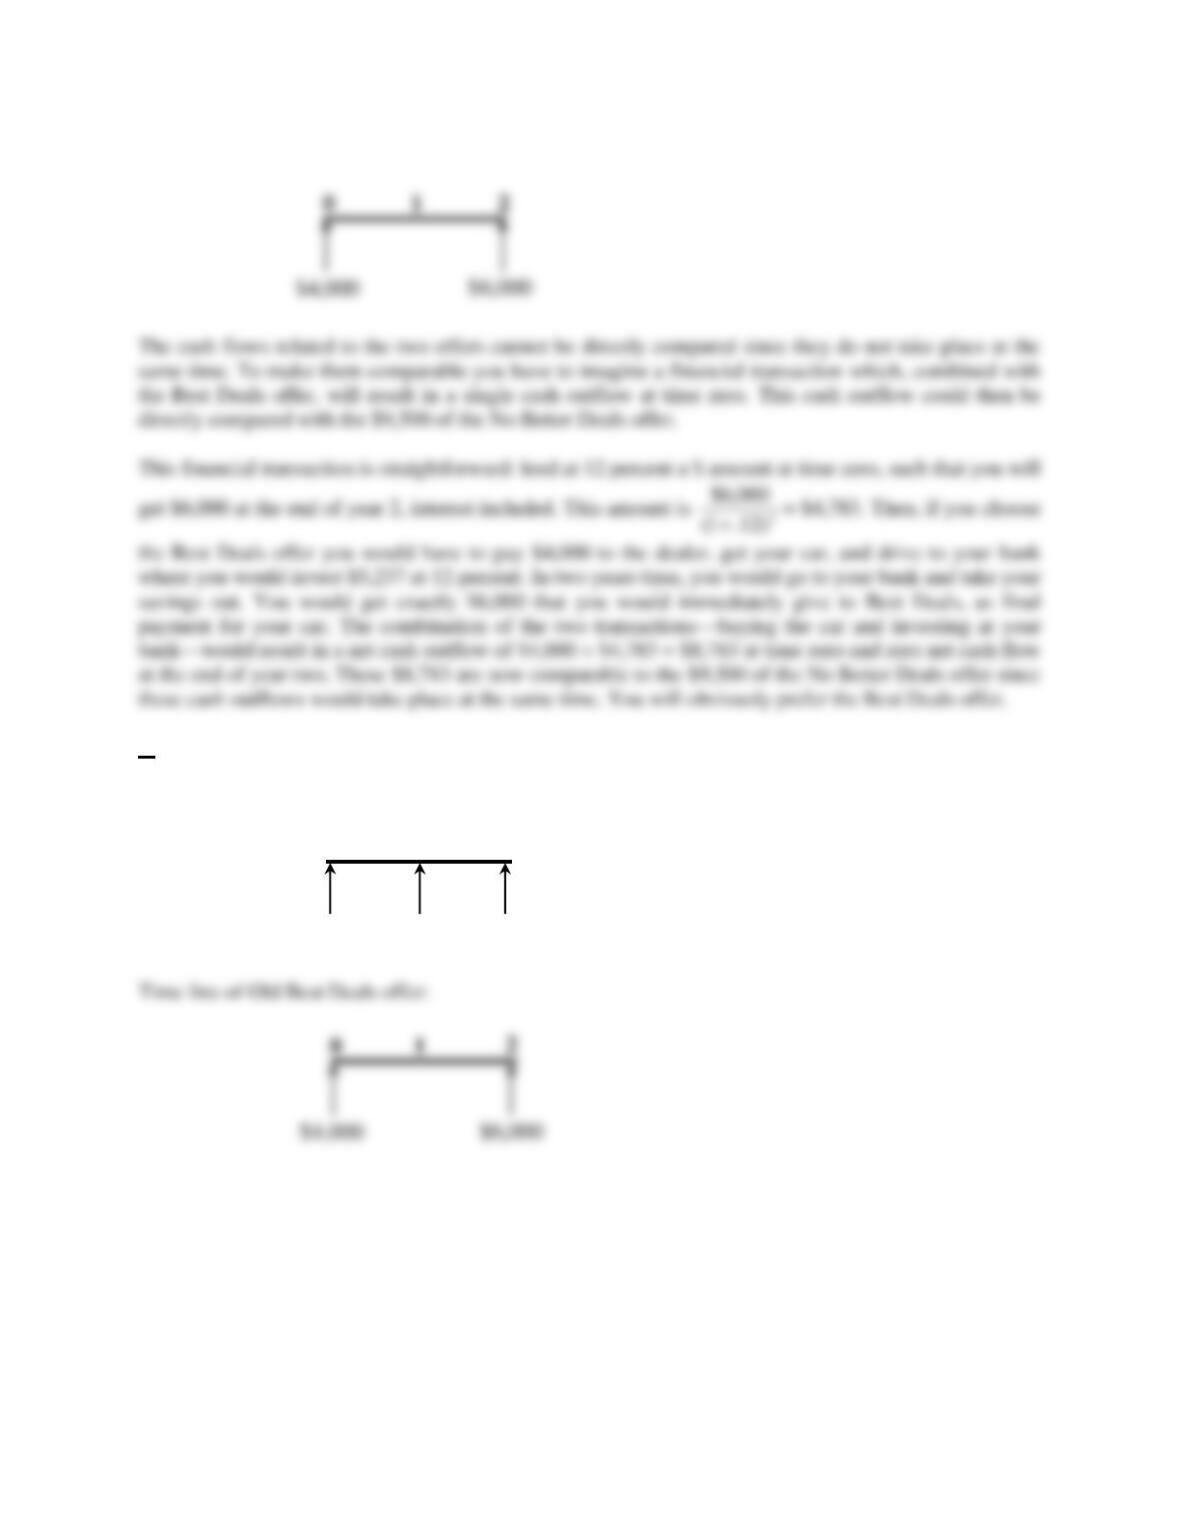
6-4
Time line of Best Deals offer:
0
1
2
b.
Time line of New Best Deals offer:
0
1
2
$5,000
$2,000
$3,000
0
1
2
6-5
c.
1. For No Better Deals, the present value of the 36 monthly payments must be equal to $10,000 at 0.5
percent per month. Since the present value of an annuity of $1 at 0.5 percent per period over 36 periods is
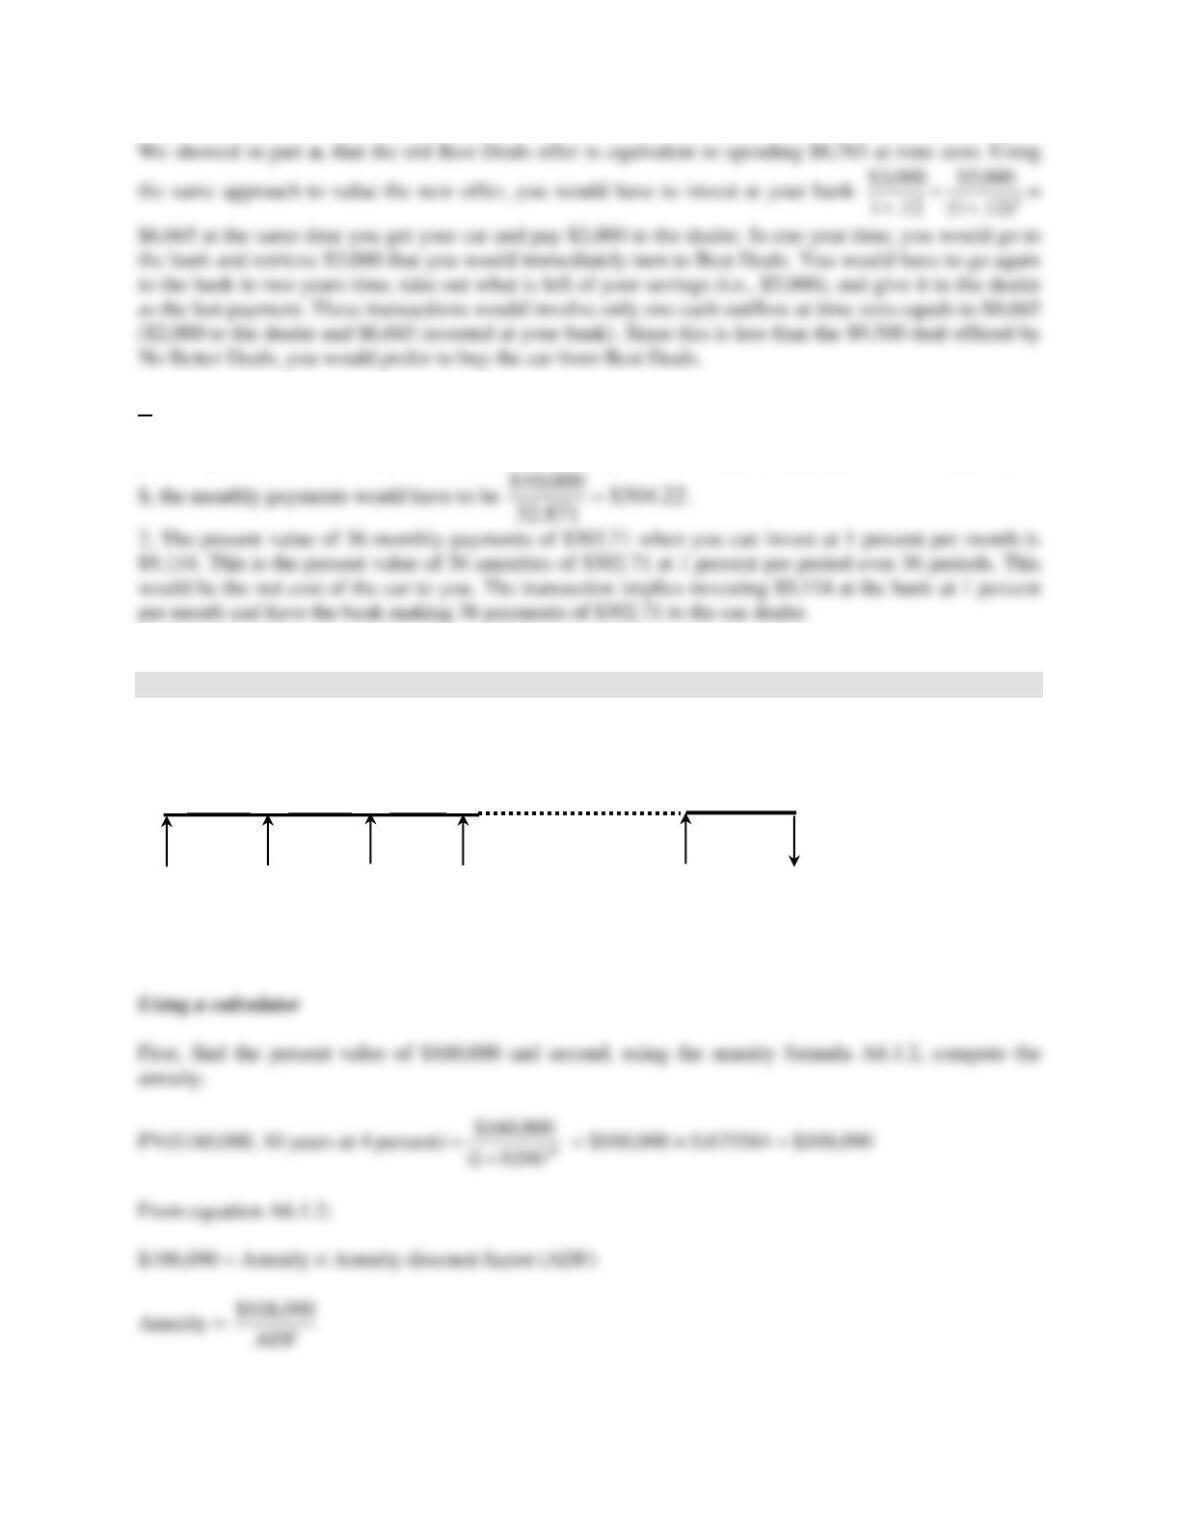
5. Saving for college.
Time line:
where X is the annual payment to the saving account.
1
9
3
2
10
0
$X
$X
$X
$X
$X
$160,000
6-6
Using a spreadsheet
A B
1
2
3 Future value $160,000
4 Numper of payments 10
$In
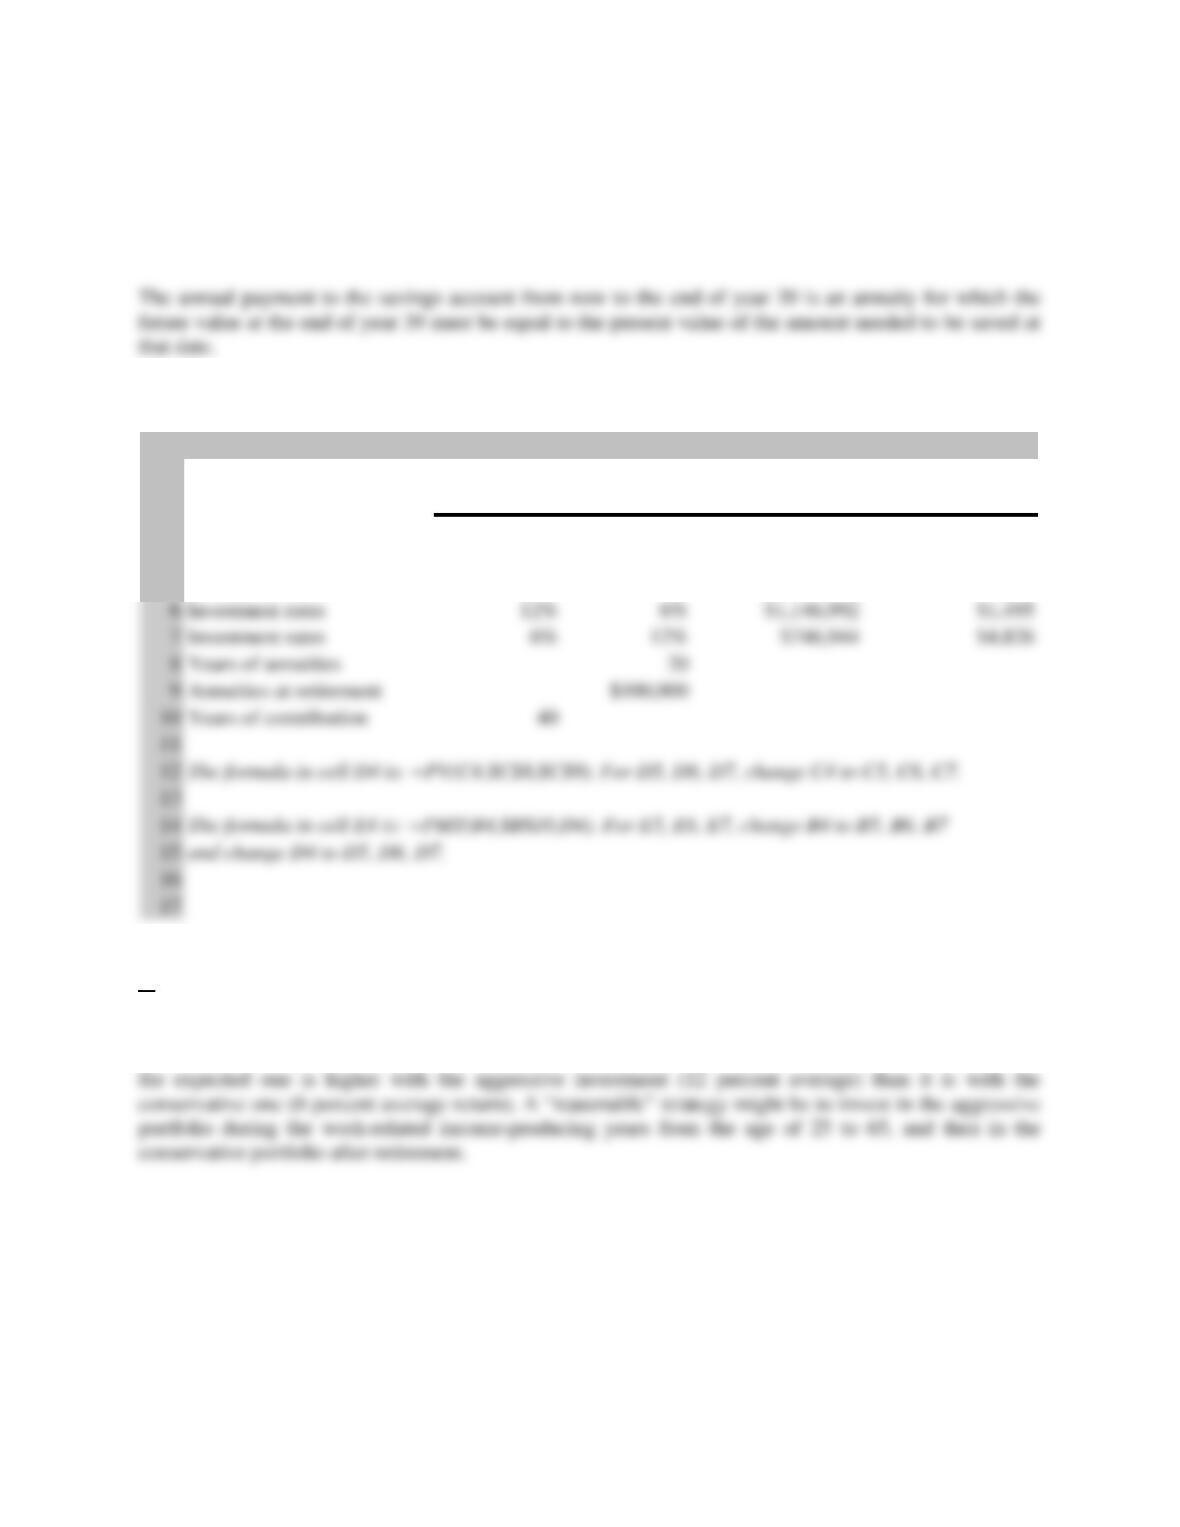
6. Saving for retirement.
a.
Time line ($ thousands):
0
1
2
3
39
40
$100
41
$100
42
$100
58
$100
59
$100
6-7
Using a calculator
To get $100,000 at the end of each year from the end of year 40 to the end of year 59, the amount that
needs to be saved by the end of year 39 is the present value of the $100,000 annuity discounted for 20
years, at either 12 or 6 percent depending upon the investment strategy chosen.
Using a spreadsheet
A B C D E
1Now to Year-end 39 Savings Needed Annual payments
2year-end 39 to year 64 year-end 39 to year 39
3
4 Investment rates 6% 6% $1,146,992 $7,411
5 Investment rates 12% 12% $746,944 $974
b.
The strategy to adopt depends upon your attitude towards risk. The 12 and 6 percent returns used in the
computations are based on historical average returns. These are returns that can be expected over a long
period of time. However, the probability that the investor will experience an actual return different from
6-8
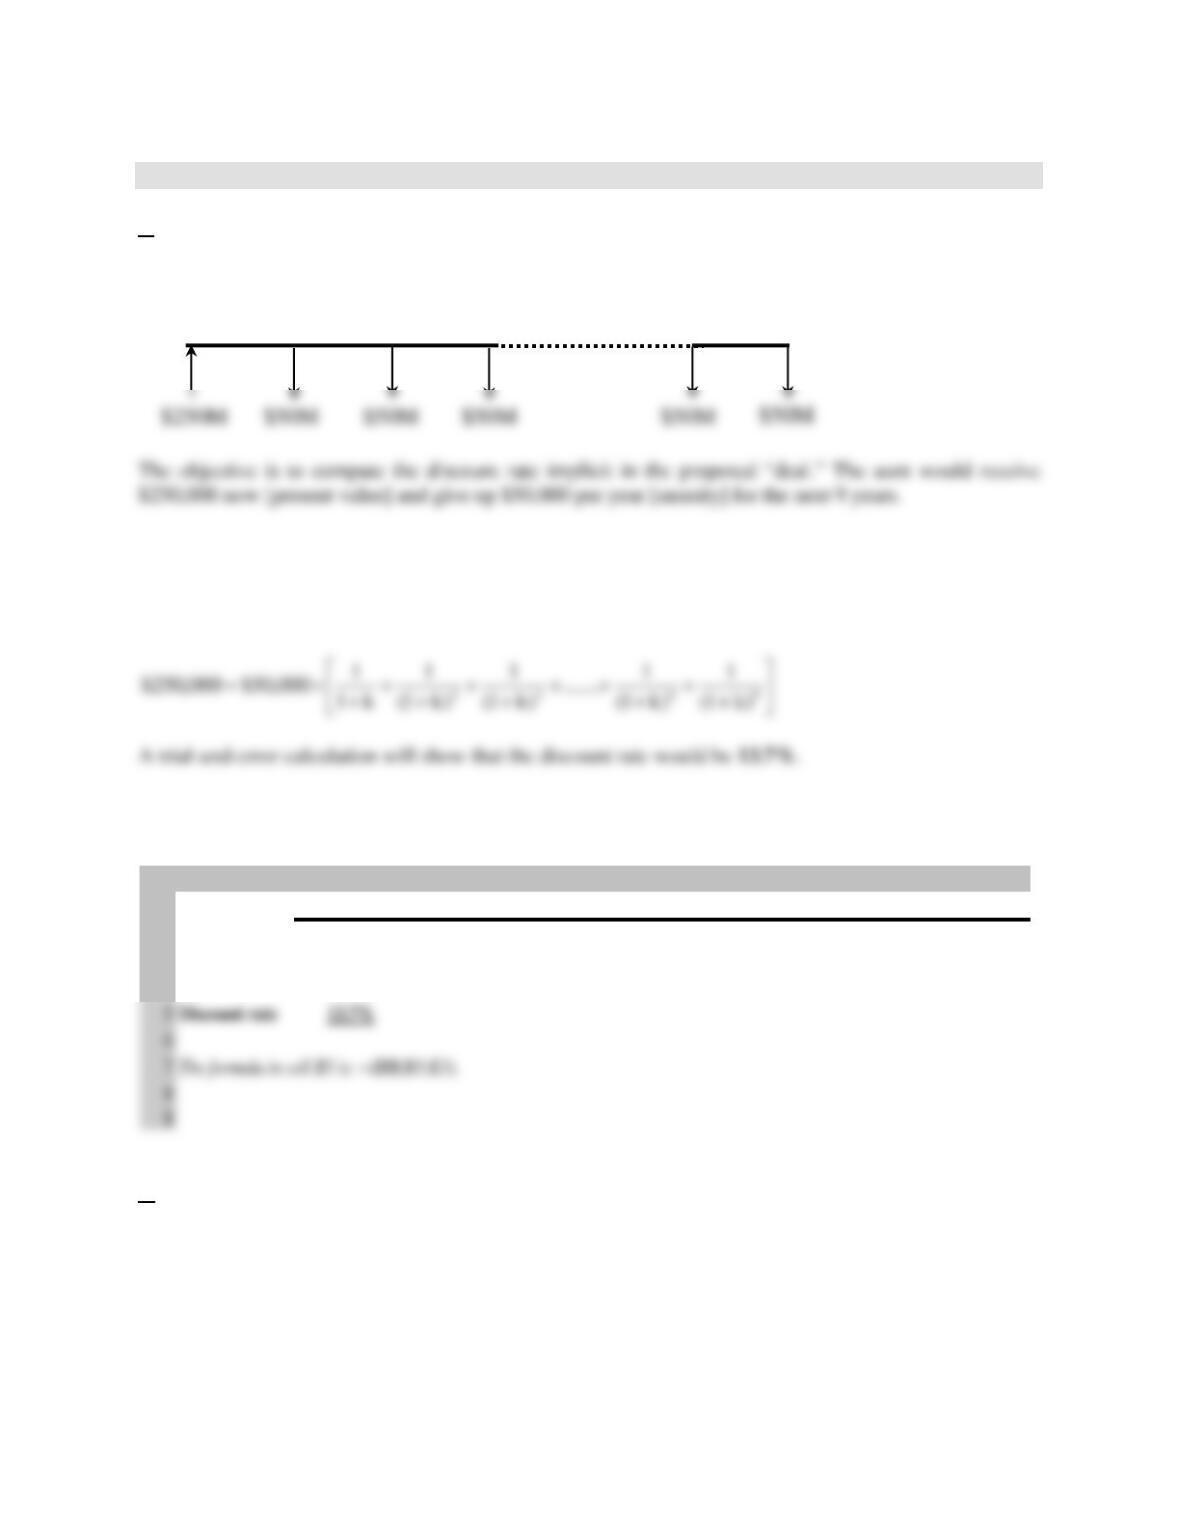
7. Financial deals.
a.
Time line:
Using a calculator
The implicit discount rate k is the solution of:
Using a spreadsheet
A B C D E F G H I J K
10 1 2 3 4 5 6 7 8 9
2
3 Cash flows -$250,000 $50,000 $50,000 $50,000 $50,000 $50,000 $50,000 $50,000 $50,000 $50,000
4
b.
The question is whether this would be satisfactory for the aunt. If she would not be able to obtain the
$250,000 from any other source, then she has little choice. If she were able to borrow the $250,000 from a
bank or other lender at a lower interest rate, then she should tell the finance company to get lost.
1
9
3
2
0
8
6-9
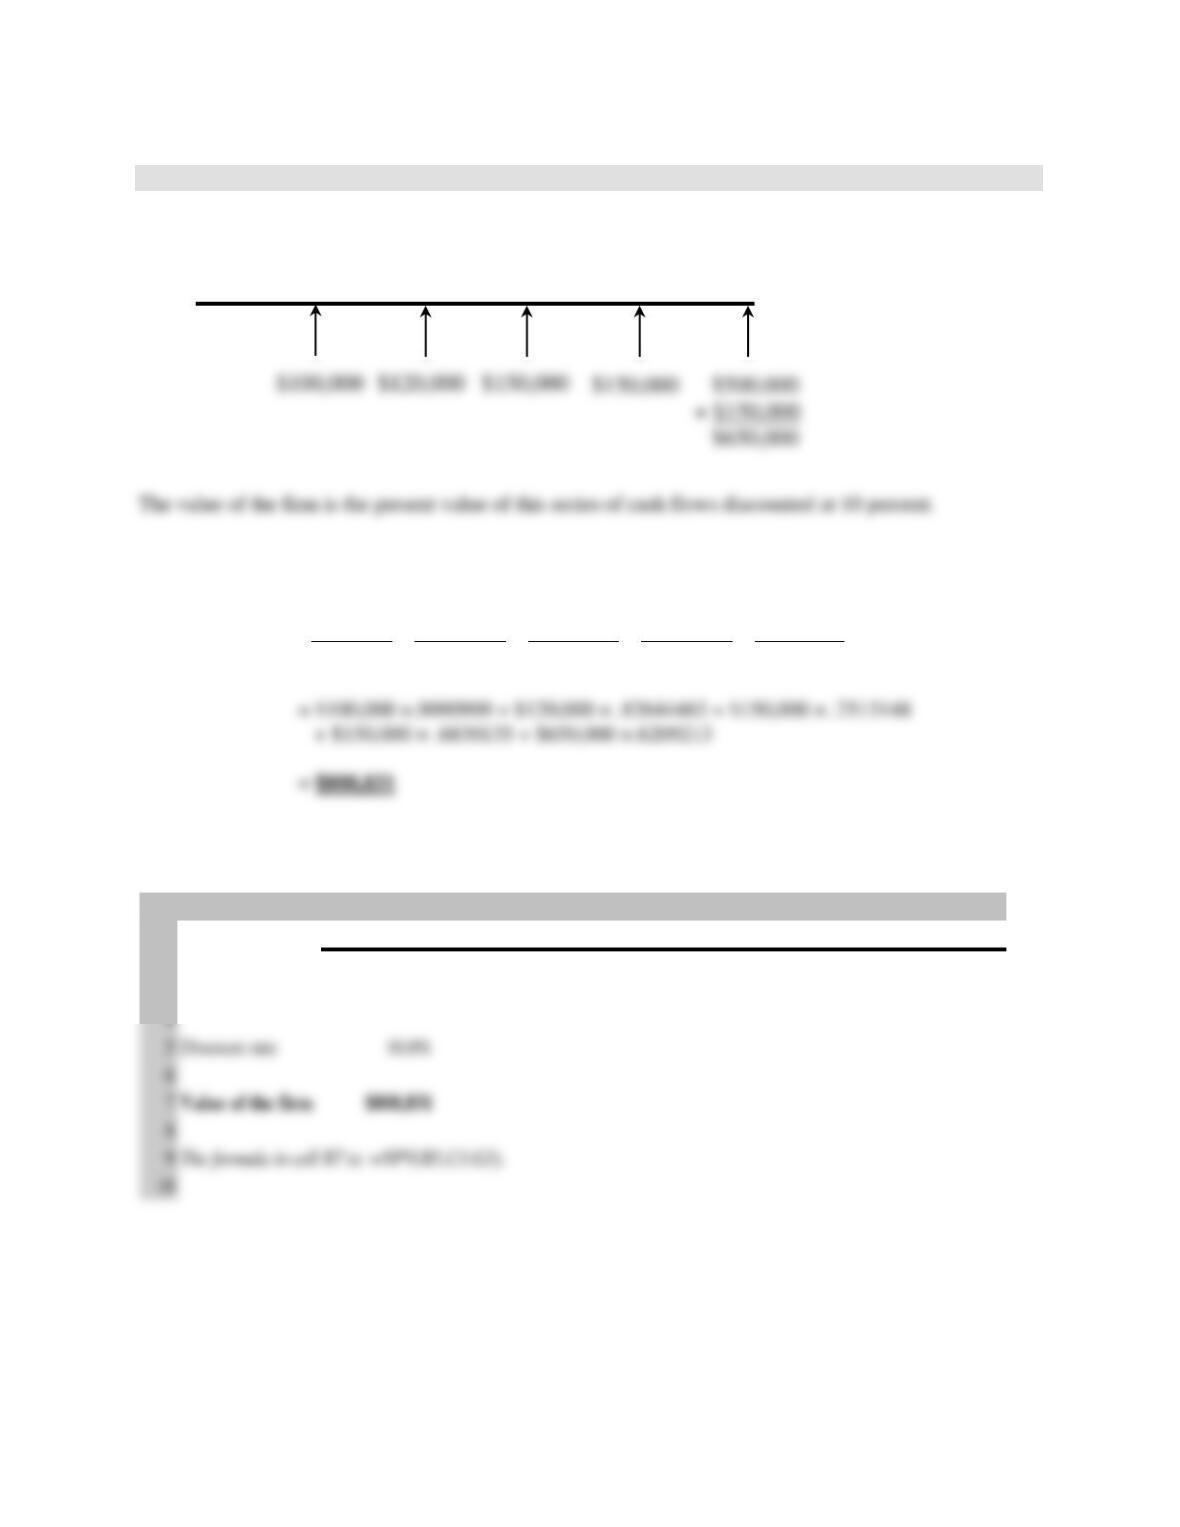
8. Value of a firm.
Time line:
Using a calculator
Value of the firm =
5432 )010.1(
000,650$
)10.01(
000,150$
)10.01(
000,150$
)10.01(
000,120$
10.01
000,100$
+
+
+
+
+
+
+
+
+
Using a spreadsheet
A B C D E F G
10 1 2 3 4 5
2
3 Cash flows $100,000 $120,000 $150,000 $150,000 $650,000
1
4
3
2
5
0
6-10
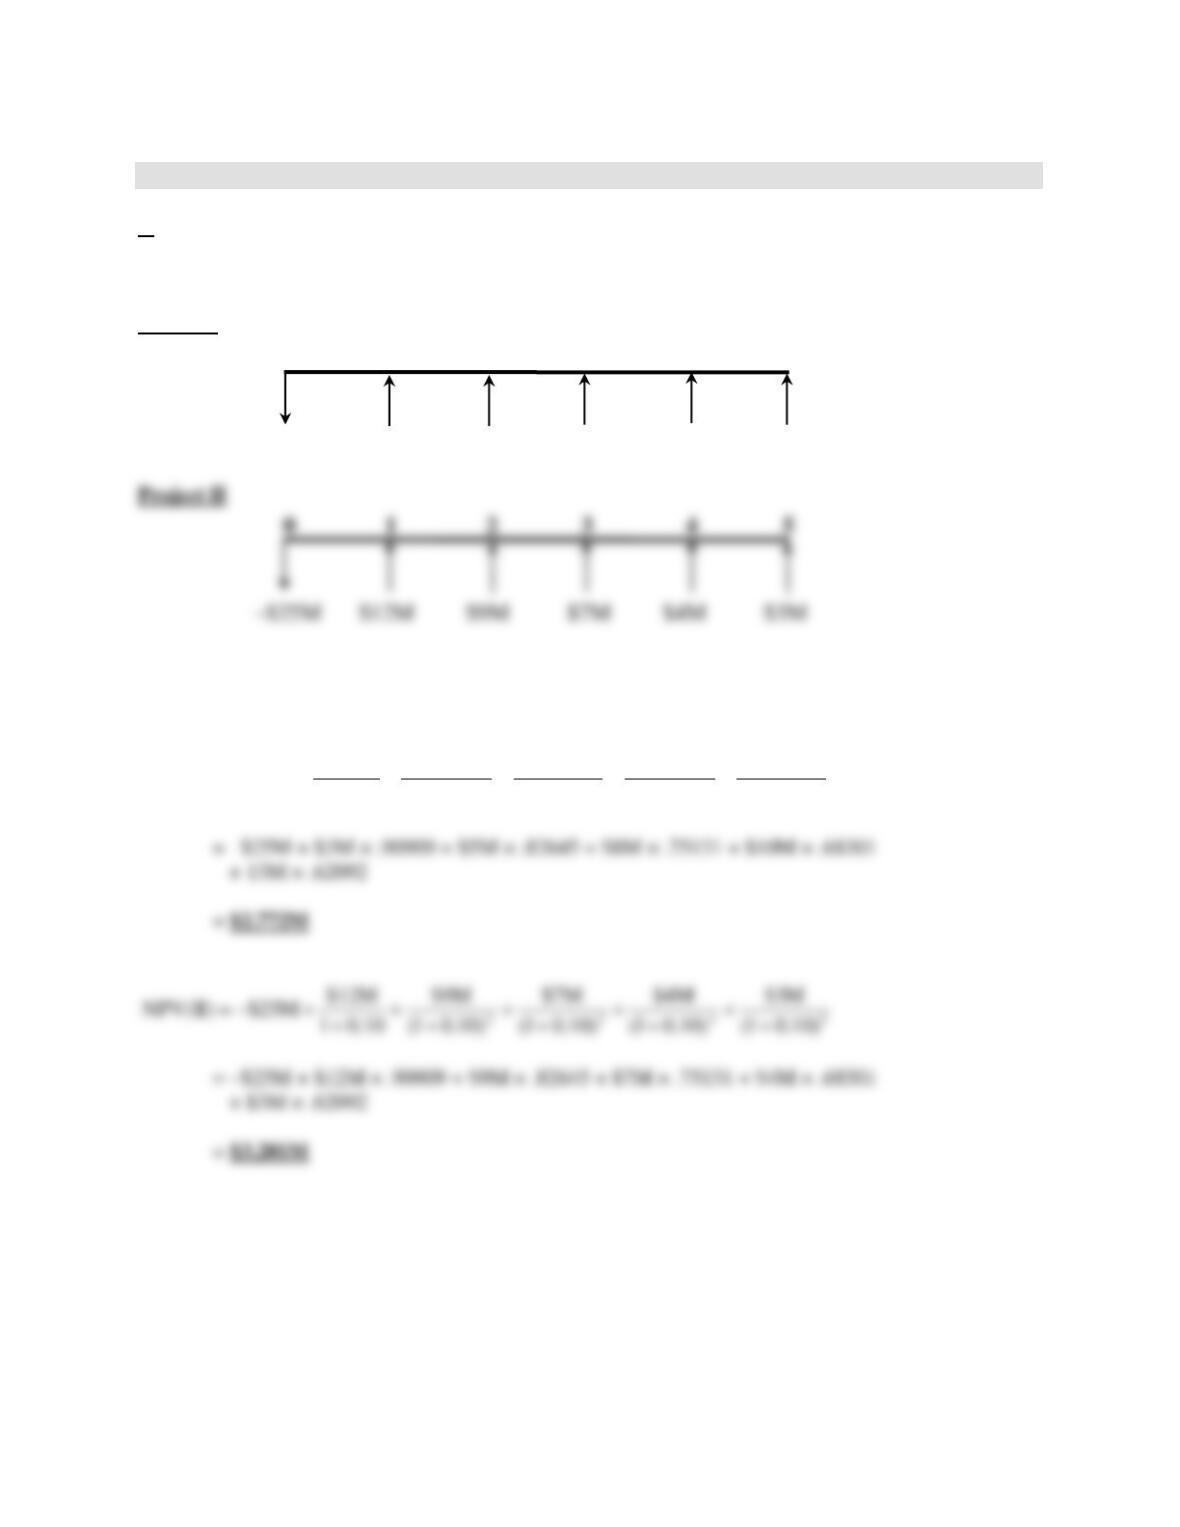
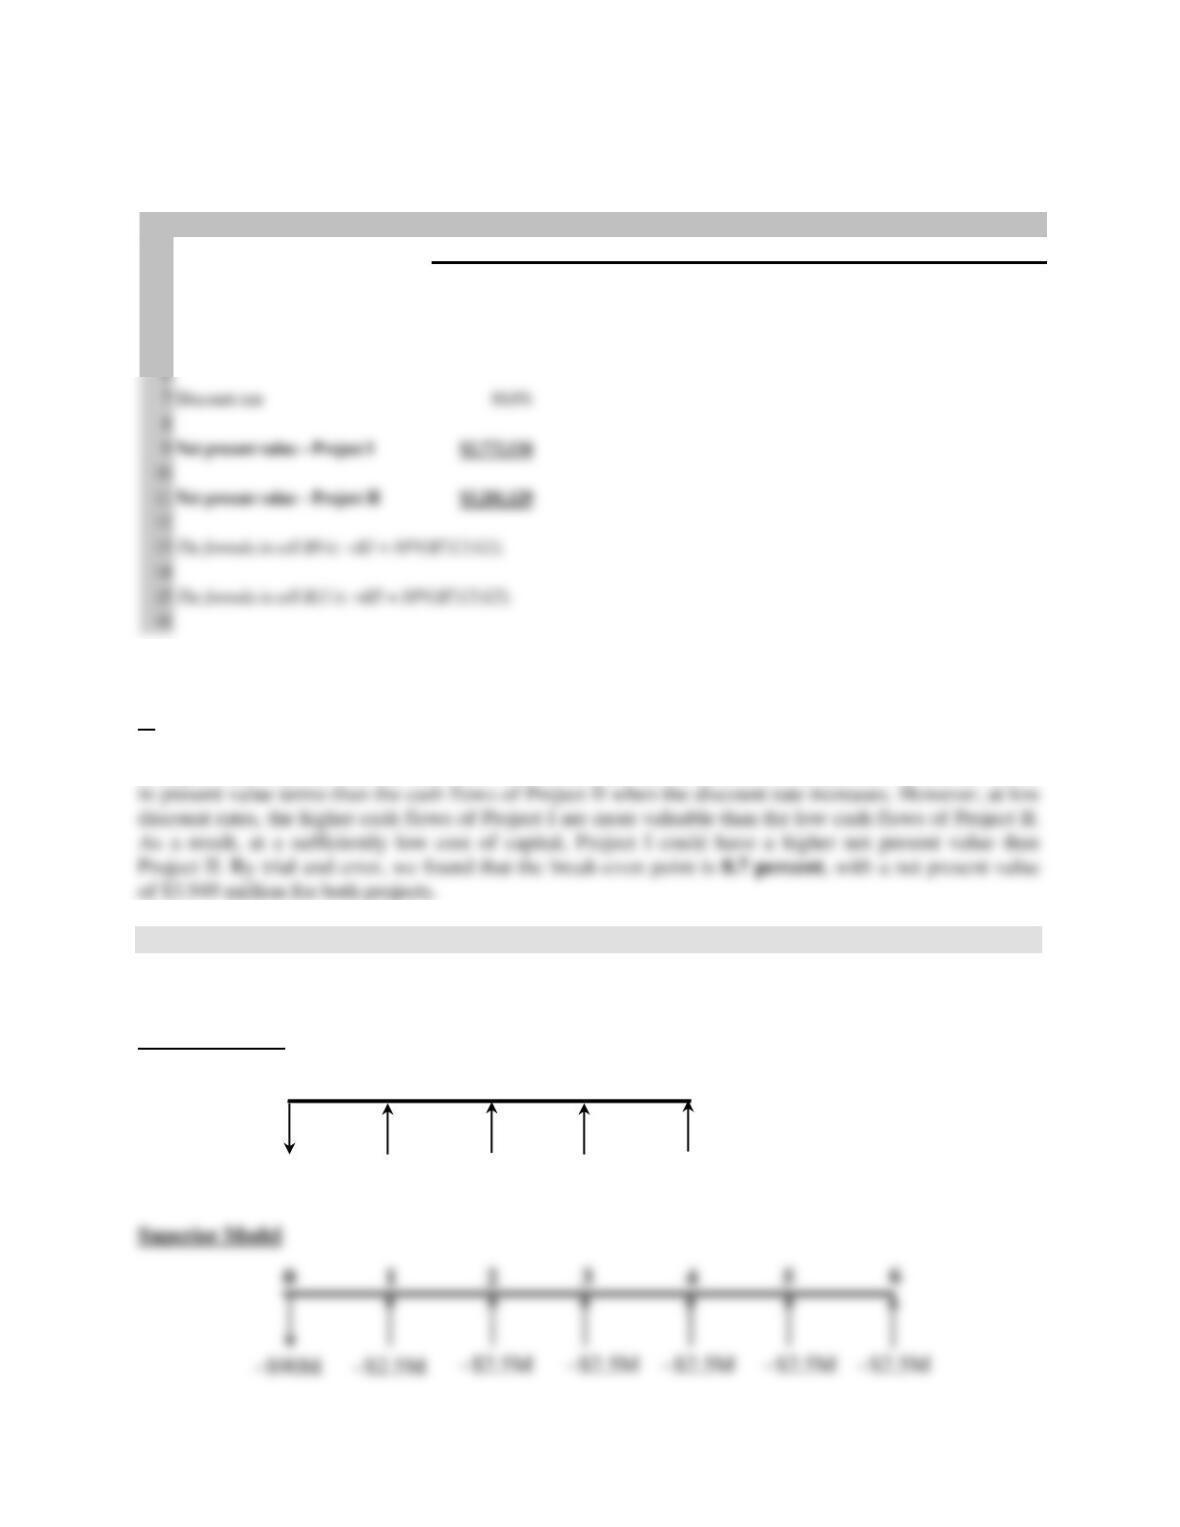
9. Competing investment projects.
a.
Time lines:
Project I
Using a calculator
5432 )10.01(
M13$
)10.01(
M10$
)10.01(
M8$
)10.01(
M5$
10.01
M3$
M25$)I(NPV +
+
+
+
+
+
+
+
+
+−=
1
4
3
2
5
0
–$25M
$3M
$5M
$8M
$10M
$13M
1
4
3
2
5
0
–$25M
$12M
$9M
$7M
$4M
$3M
6-11
Using a spreadsheet
A B C D E F G
10 1 2 3 4 5
2
3Cash flows – Project I -$25,000,000 $3,000,000 $5,000,000 $8,000,000 $10,000,000 $13,000,000
4
5Cash flows – Project II -$25,000,000 $12,000,000 $9,000,000 $7,000,000 $4,000,000 $3,000,000
–$90M
–$2.5M
6
Project II must be preferred to Project I since its net present value is higher.
b.
It is not necessarily the case that Project II would be always better than Project I when the cost of capital
changes from 10 percent. Since the cash flows increase in size over time for Project I, they are worth less
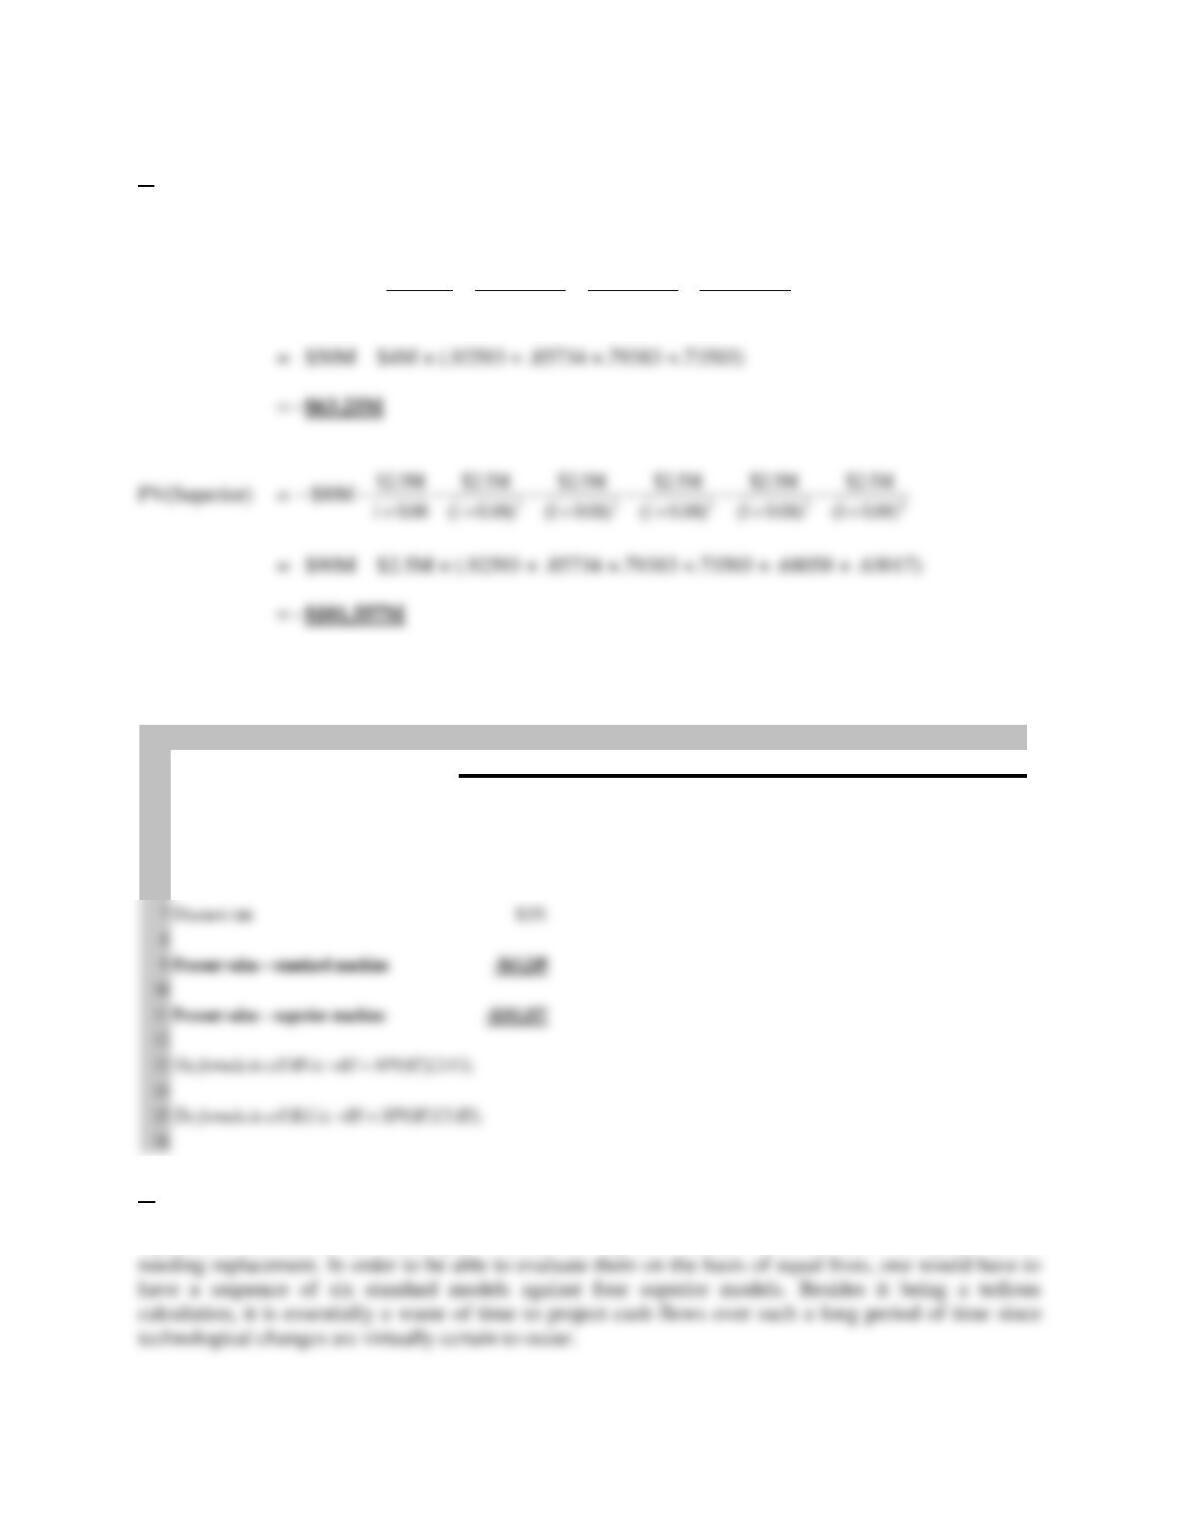
10. Comparing projects with unequal economic life.
Time lines:
Standard Model
–$50M
–$4M
–$4M
–$4M
–$4M
1
4
3
2
0
6-12
a.
Using a calculator
PV(Standard) =
432 )08.01(
M4$
)08.01(
M4$
)08.01(
M4$
08.01
M4$
M50$+
−
+
−
+
−
+
−−
= –$50M – $4M × (.92593 + .85734 +.79383 +.73503)
Using a spreadsheet
A B C D E F G H
10 1 2 3 4 5 6
2
3Cash flows – standard model -$50,000 –$4,000 -$4,000 –$4,000 –$4,000
4
5Cash flows – superior model -$90,000 –$2,500 -$2,500 –$2,500 –$2,500 -$2,500 –$2,500
6
b.
The cash flows obviously cannot be directly compared because the standard model would have to be
replaced at the end of the fourth year whereas the superior model would still have two years before
c.
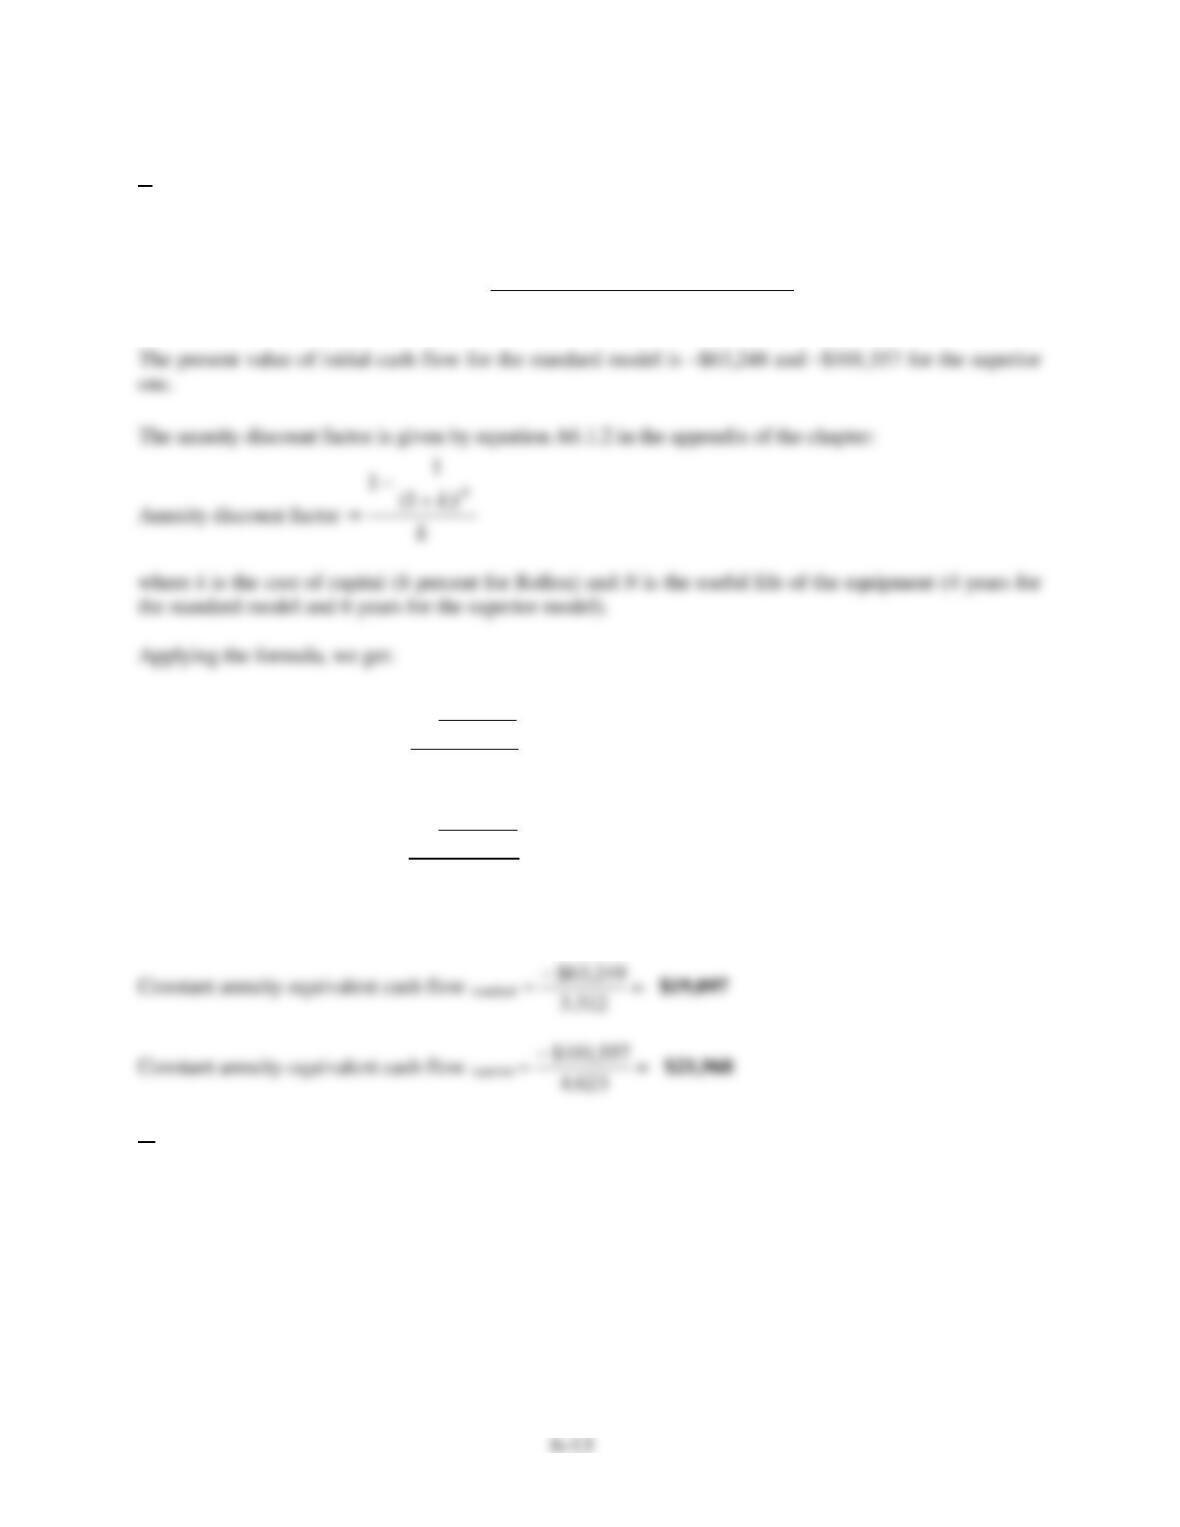
The constant annuity-equivalent cash flow cost of each model [at an 8 percent discount rate], using the
following equation from the appendix of the chapter:
Constant annuity-equivalent cash flow
factordiscountAnnuity
flowcashoriginalofvalueesentPr
=
Annuity discount factor standard
312.3
08.
)08.1(
1
14=
+
−
=
Annuity discount factor superior
623.4
08.
)08.1(
1
16=
+
−
=
and
d.
On the basis of expected costs, the company should purchase the standard model. This may also be
desirable because in four years time, the changes in technology or in the markets may render the superior
model obsolete or useless.