Chapter 5
Answers to Review Problems
Finance For Executives – 4th Edition
1. Transactions.
Operating
margin
Invested
capital
turnover
Debt
ratio
1. Shares are issued for cash.
0
–
–
2. Goods from inventory are sold for cash at a profit.
+
+
–
3. A fixed asset is sold for cash at its book value.
0
0
0
4. A fixed asset is sold for more than its book value.
0
–
–
5. A dividend is declared and paid.
0
+
+
6. Cash is obtained through a bank loan.
0
–
+
7. Accounts receivable are collected.
0
0
0
8. Minority interest in a firm is acquired for cash.
0
0
0
9. A fixed asset is depreciated.
–
+
+
10. Obsolete inventory is written off.
–
+
+
11. Merchandise is purchased on account.
0
0
0
12. Shares are repurchased.
0
+
+
5-2
2. ROICBT , ROCEBT, RONA, ROBA, and ROTA.
Measure
Definition
Value
ROICBT
EBIT/Invested capital
$24.0/$138.0 = 17.4%
ROCEBT
EBIT/Capital employed
$24.0/$138.0 = 17.4%
RONA
EBIT/Net assets
$24.0/$138.0 = 17.4%
ROBA
EBIT/Business assets
$24.0/($77.0 + $53.0) = 18.5%
ROTA
EBIT/Total assets
$24/$190.0 = 12.6%
3. Book versus market return on equity.
The two ratios are different because the book value is estimated using past data, up to the end of
the accounting period, while the market value is determined by the investors’ expectation
regarding future earnings/cash flows. Further, financial accounting data is very sensitive to the
accounting principles used to estimate it.
4. The structure of a firm profitability.
a. 7.5 percent (.075 × 2 = .15 or 15 percent)
b. The financial structure effect is 1.67 (.10 × .9 × 1.67 = .15 or 15 percent). Since the financial
5-3
5. Misuse of the structure of the return on equity.
a. If the firm decides not to replace existing fixed assets, its invested capital will decrease as the
book value of fixed assets will decrease due to increased accumulated depreciation. Its capital
6. 6. Financial leverage.
When the cost of debt is lower than the return on invested capital before tax: it pays to borrow
when the cost of borrowing is lower than the return expected from the investment made by the
firm. A formal proof is given by equation 5.16 where the difference between ROICBT and the
7. Industry effect on the structure of the return on equity.
a.
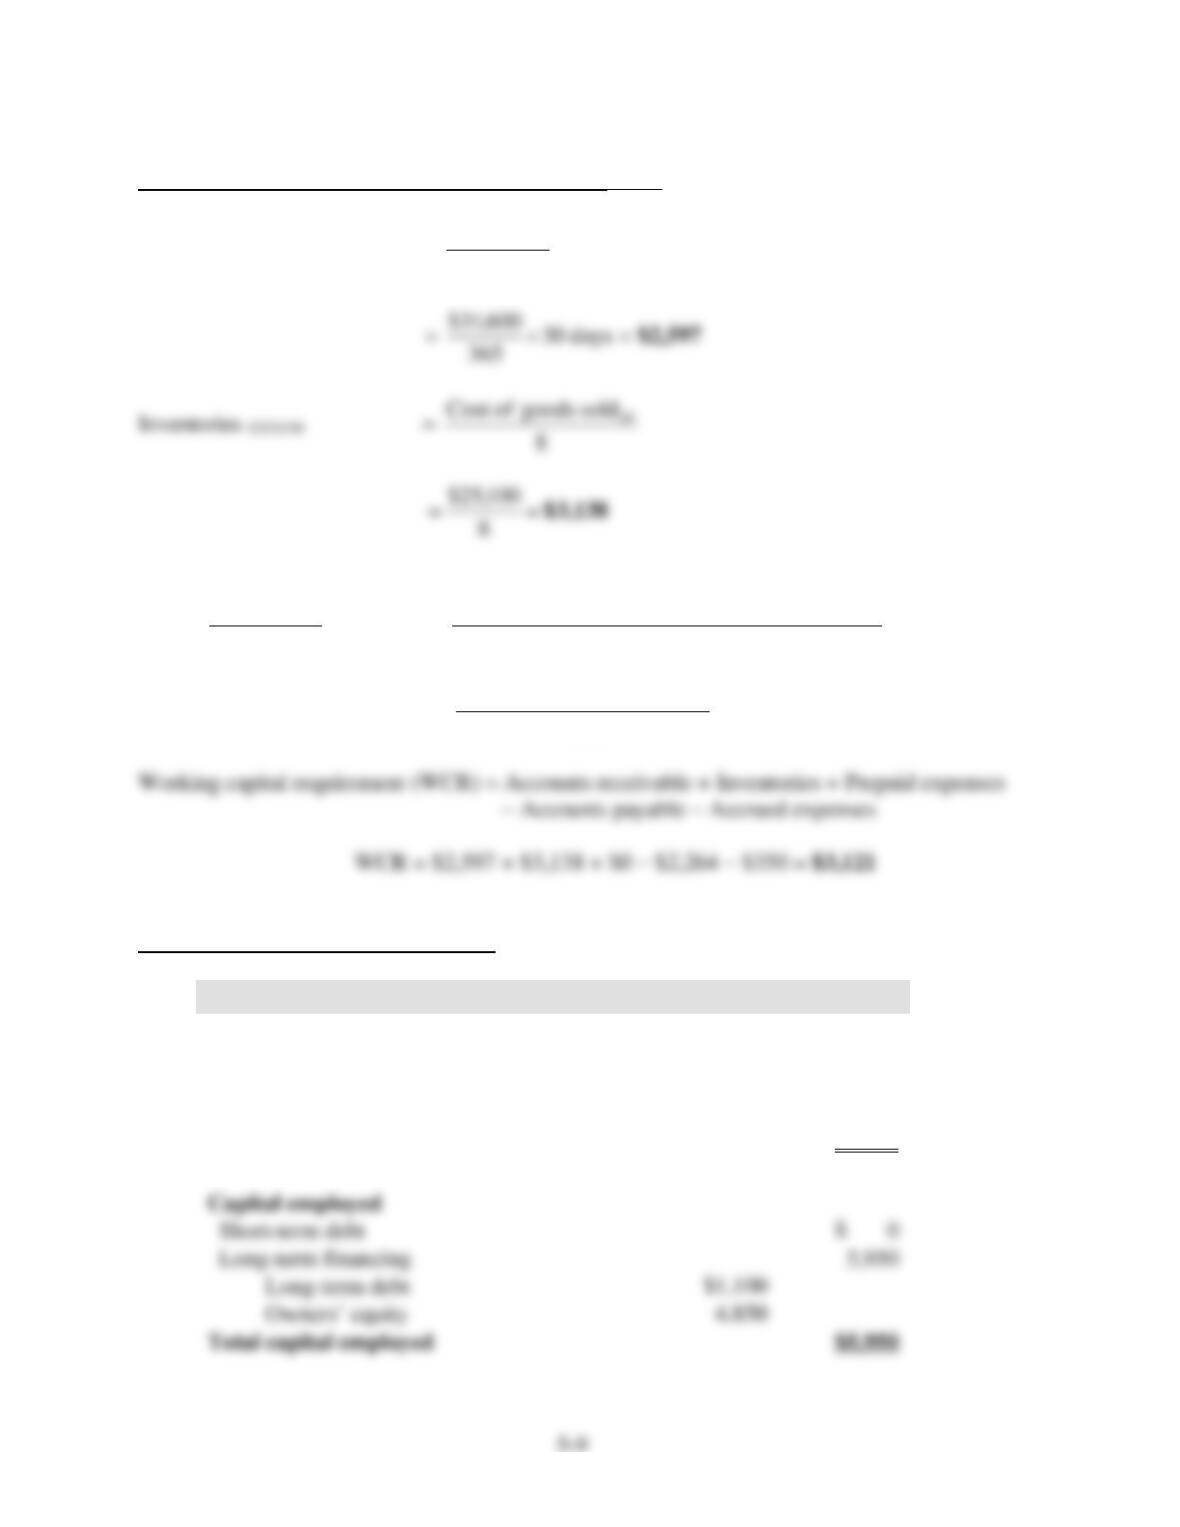
Working capital requirement (WCR) = Accounts receivable + Inventories + Prepaid expenses
– Accounts payable – Accrued expenses
Managerial balance sheets
in millions
Firm 1
Firm 2
Firm 3
Invested capital
Cash
$ 1,856
$ 485
$23,798
Working capital requirement (WCR)
2,105
456
(3,245)
Net fixed assets
45,993
13,816
21,842
Total invested capital
$49,954
$14,757
$42,395
5-4
b.
Operating margin = EBIT/Sales
Invested capital turnover = Sales/Invested capital
Firm 1
Operating margin = $10,105/$166,809 = 6.1% (rounded)
Invested capital turnover = $166,809/$49,954 = 3.34 (rounded)
Firm 2
Operating margin = $1,419/$7,132 = 19.9% (rounded)
Invested capital turnover = $7,132/$14,757 = .48
5-5
Firm 3
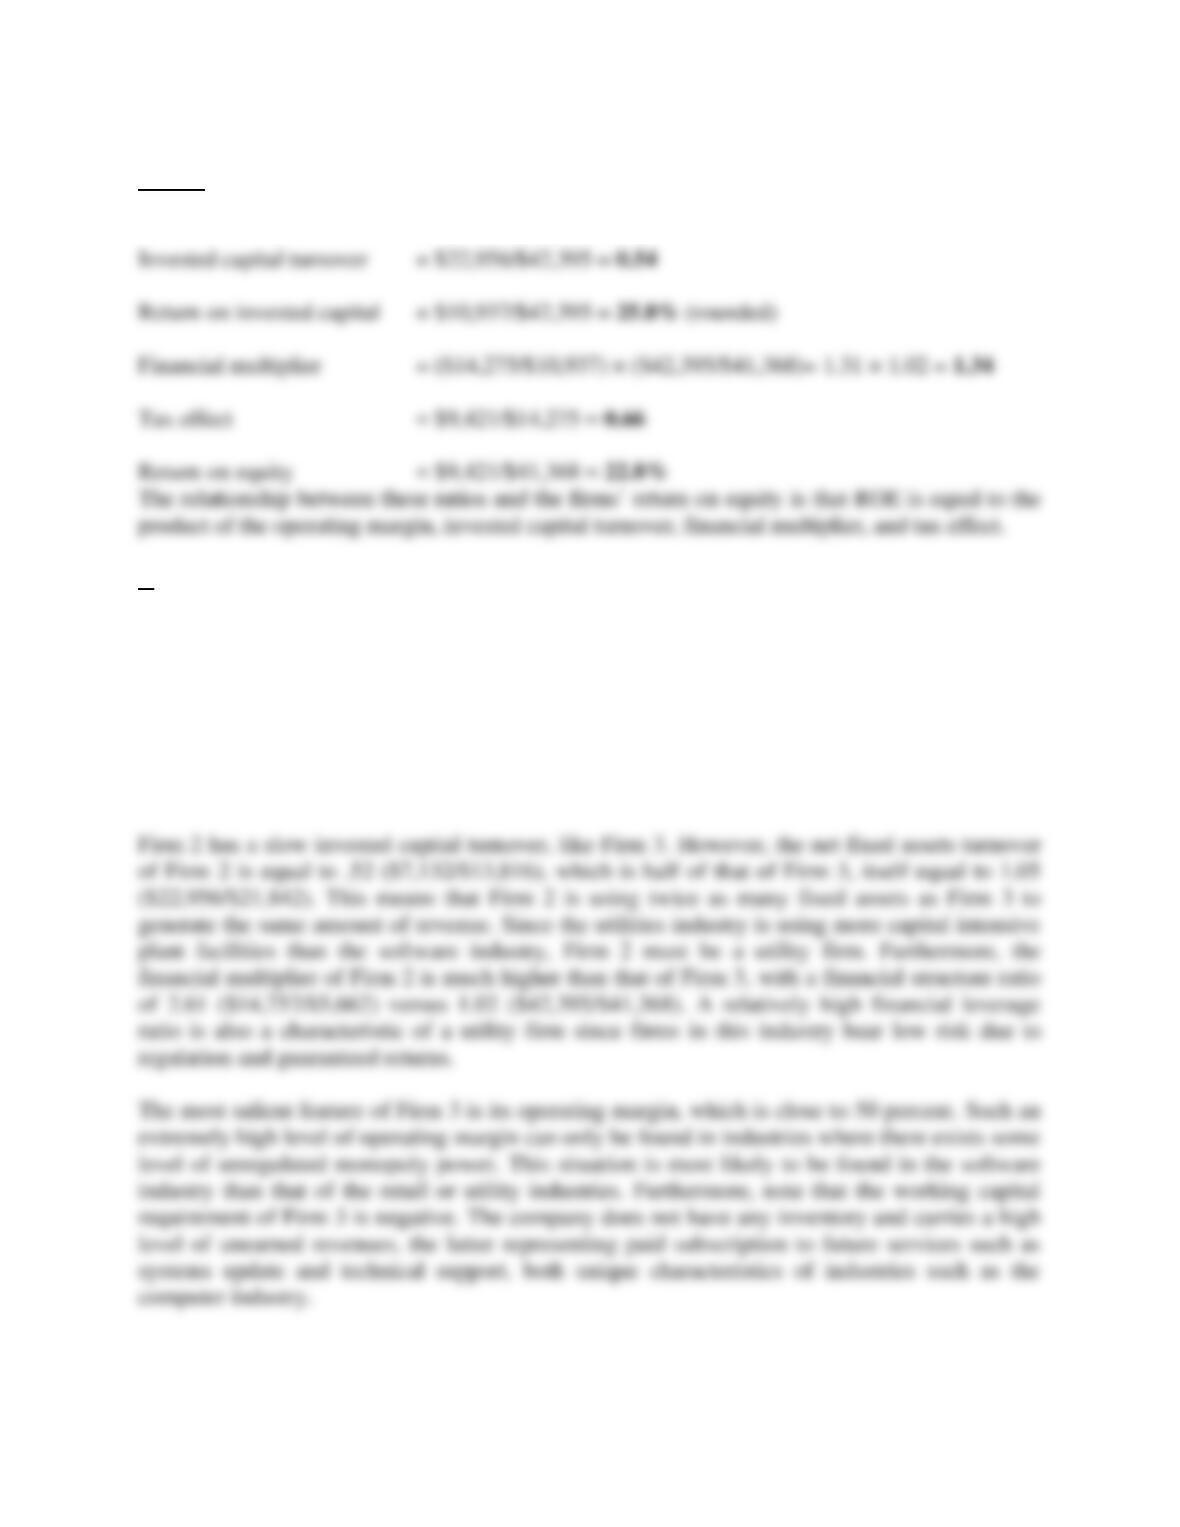
Operating margin = $10,937/$22,956 = 47.6%
c.
Firm 1 is in the retail (nongrocery) industry, Firm 2 is a utility firm, and Firm 3 is in the
computer (software industry).
The most striking feature of Firm 1 is its invested capital turnover of 3.34, which means that the
firm generates $3.34 of revenue per dollar of invested capital, while the other two firms generate
only around half a dollar of revenue. Among the three industries to which Firm 1 can belong,
only the retail industry can exhibit such a relatively high invested capital turnover.
5-6
8. The effect of the management of the operating cycle on the firm’s profitability.
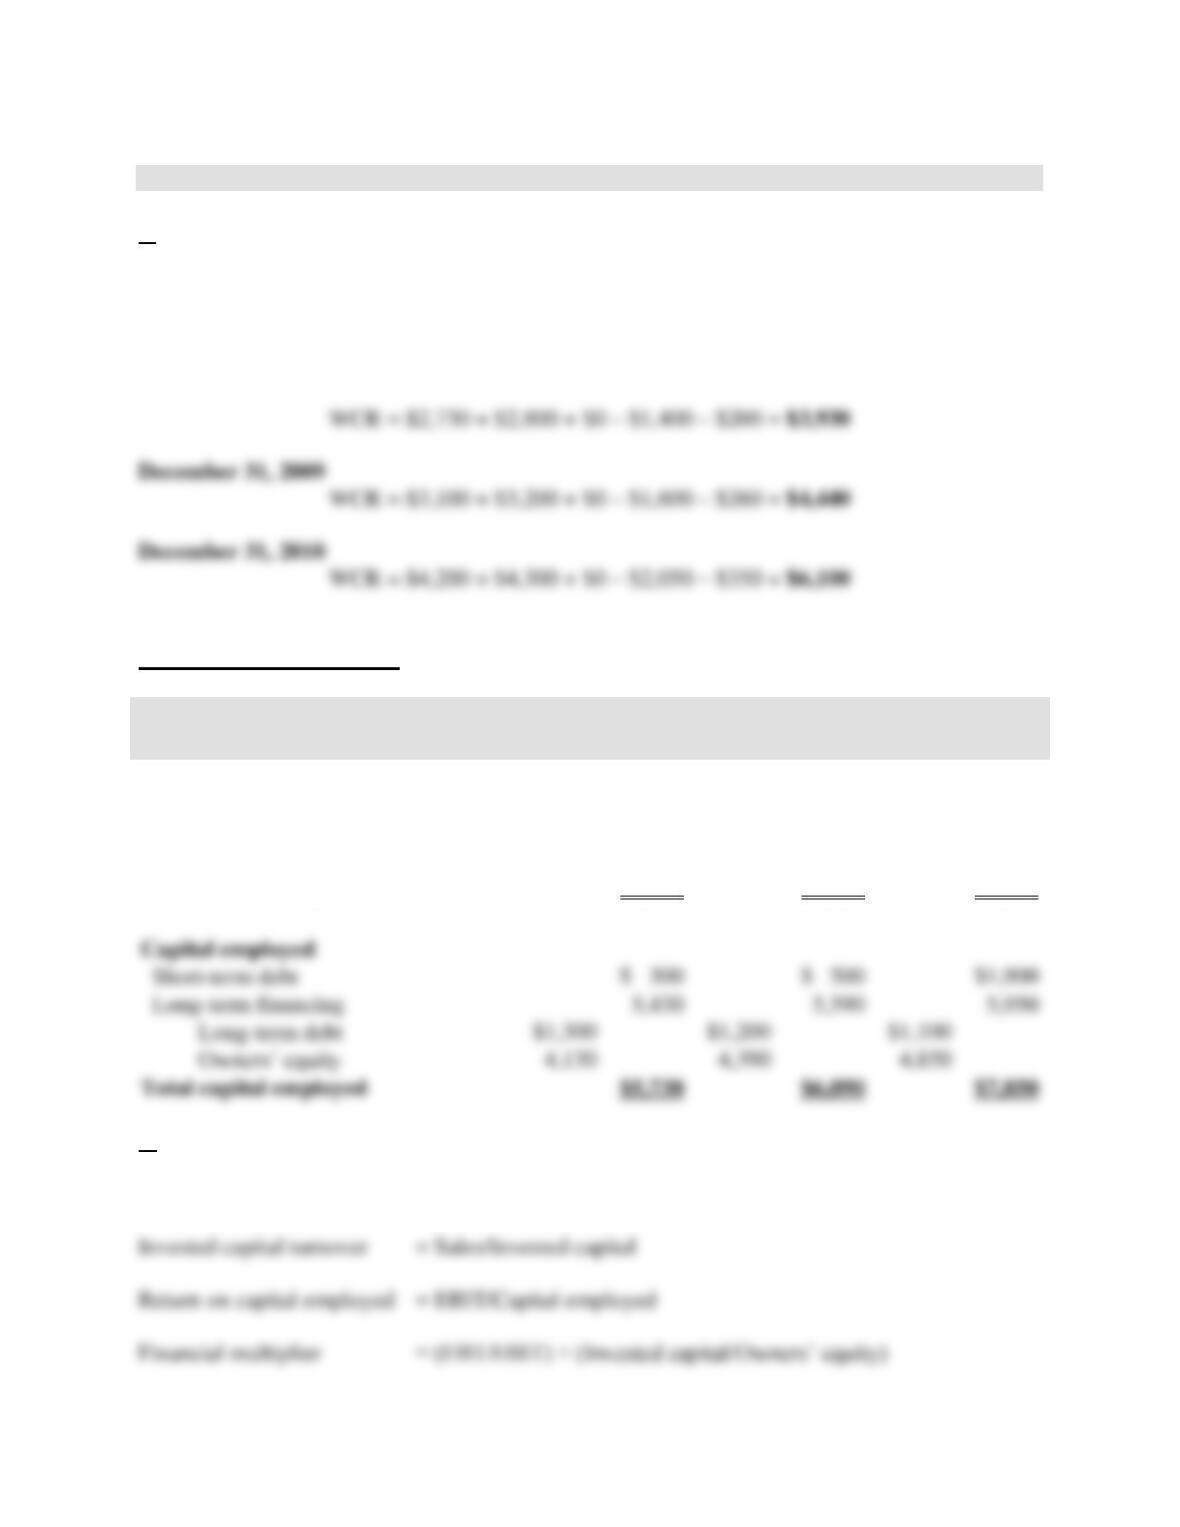
a.
Working capital requirement (WCR) = Accounts receivable + Inventories + Prepaid expenses
– Accounts payable – Accrued expenses
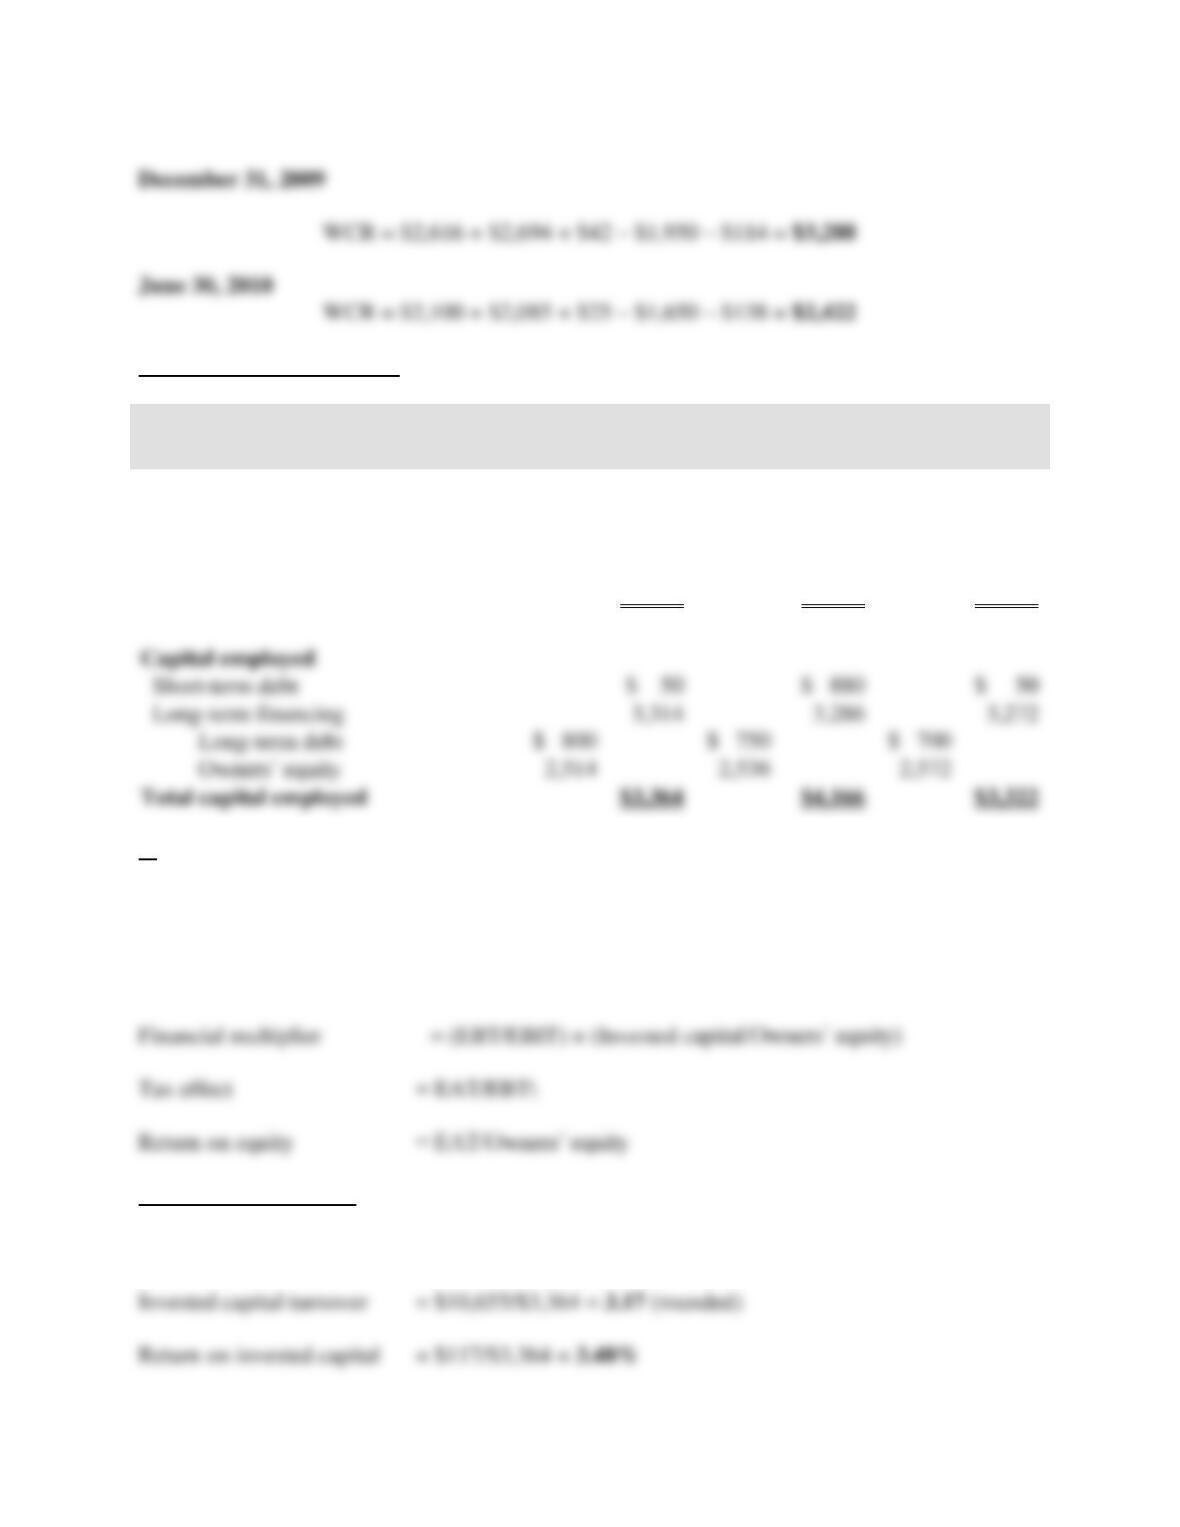
December 31, 2008
Managerial balance sheets
in thousands
December 31,
2008
December 31,
2009
December 31,
2010
Invested capital
Cash
$ 600
$ 350
$ 300
Working capital requirement (WCR)
3,930
4,440
6,100
Net fixed assets
1,200
1,300
1,450
Total invested capital
$5,730
$6,090
$7,850
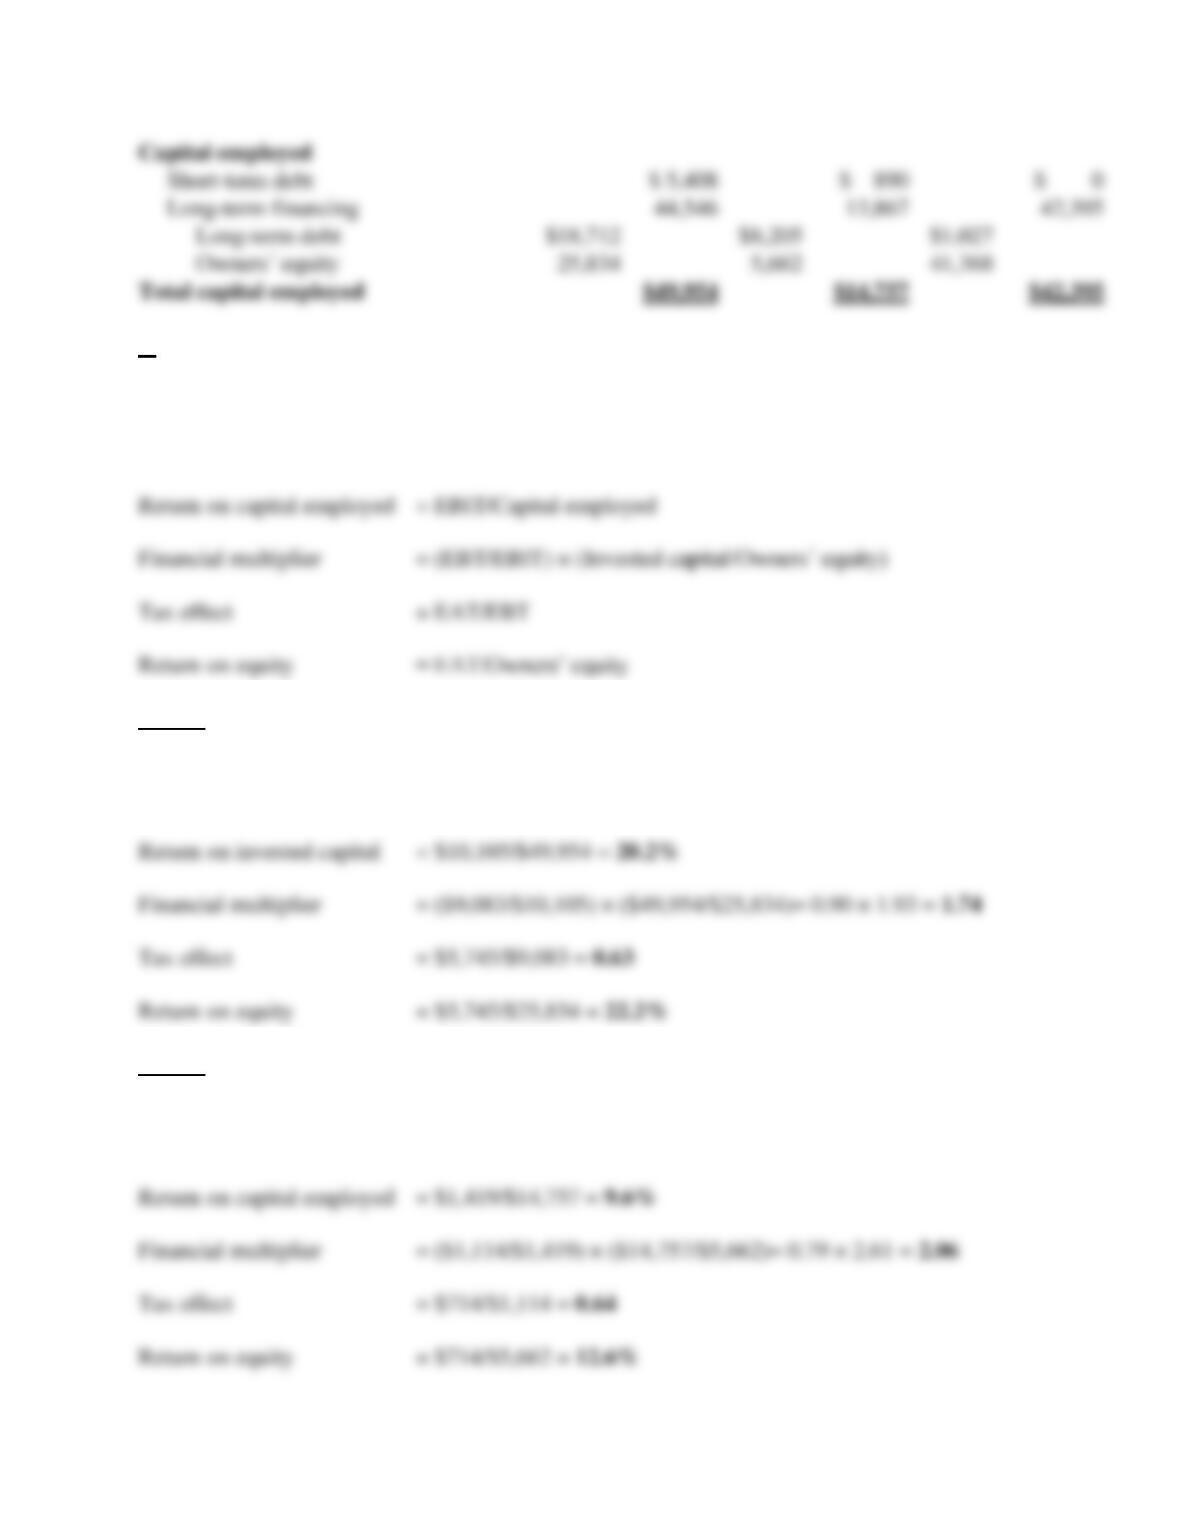
Capital employed
Short-term debt
$ 300
$ 500
$1,900
Long-term financing
Long-term debt
Owners’ equity
Total capital employed
$5,730
$7,850
b.
Operating margin = EBIT/Sales
5-7
2008
Operating margin = $650/$22,100 = 2.94%
Invested capital turnover = $22,100/$5,730 = 3.86
2009
Operating margin = $900/$24,300 = 3.70%
Invested capital turnover = $24,300/$6,090 = 3.99
2010
Operating margin = $1,350/$31,600 = 4.27%
Invested capital turnover = $31,600/$7,850 = 4.03
5-8
The relationship between these ratios and the firm’s return on equity is that ROE is simply equal
to the product of the operating margin, invested capital turnover, financial multiplier, and tax
effect.
c.
Note the drastic increase of the return on equity which nearly doubles between 2008 and 2010,
from 7.75 percent to 13.61 percent. This change in profitability can be attributed either to the tax
effect, a change in the financial policy or in the return on invested capital.
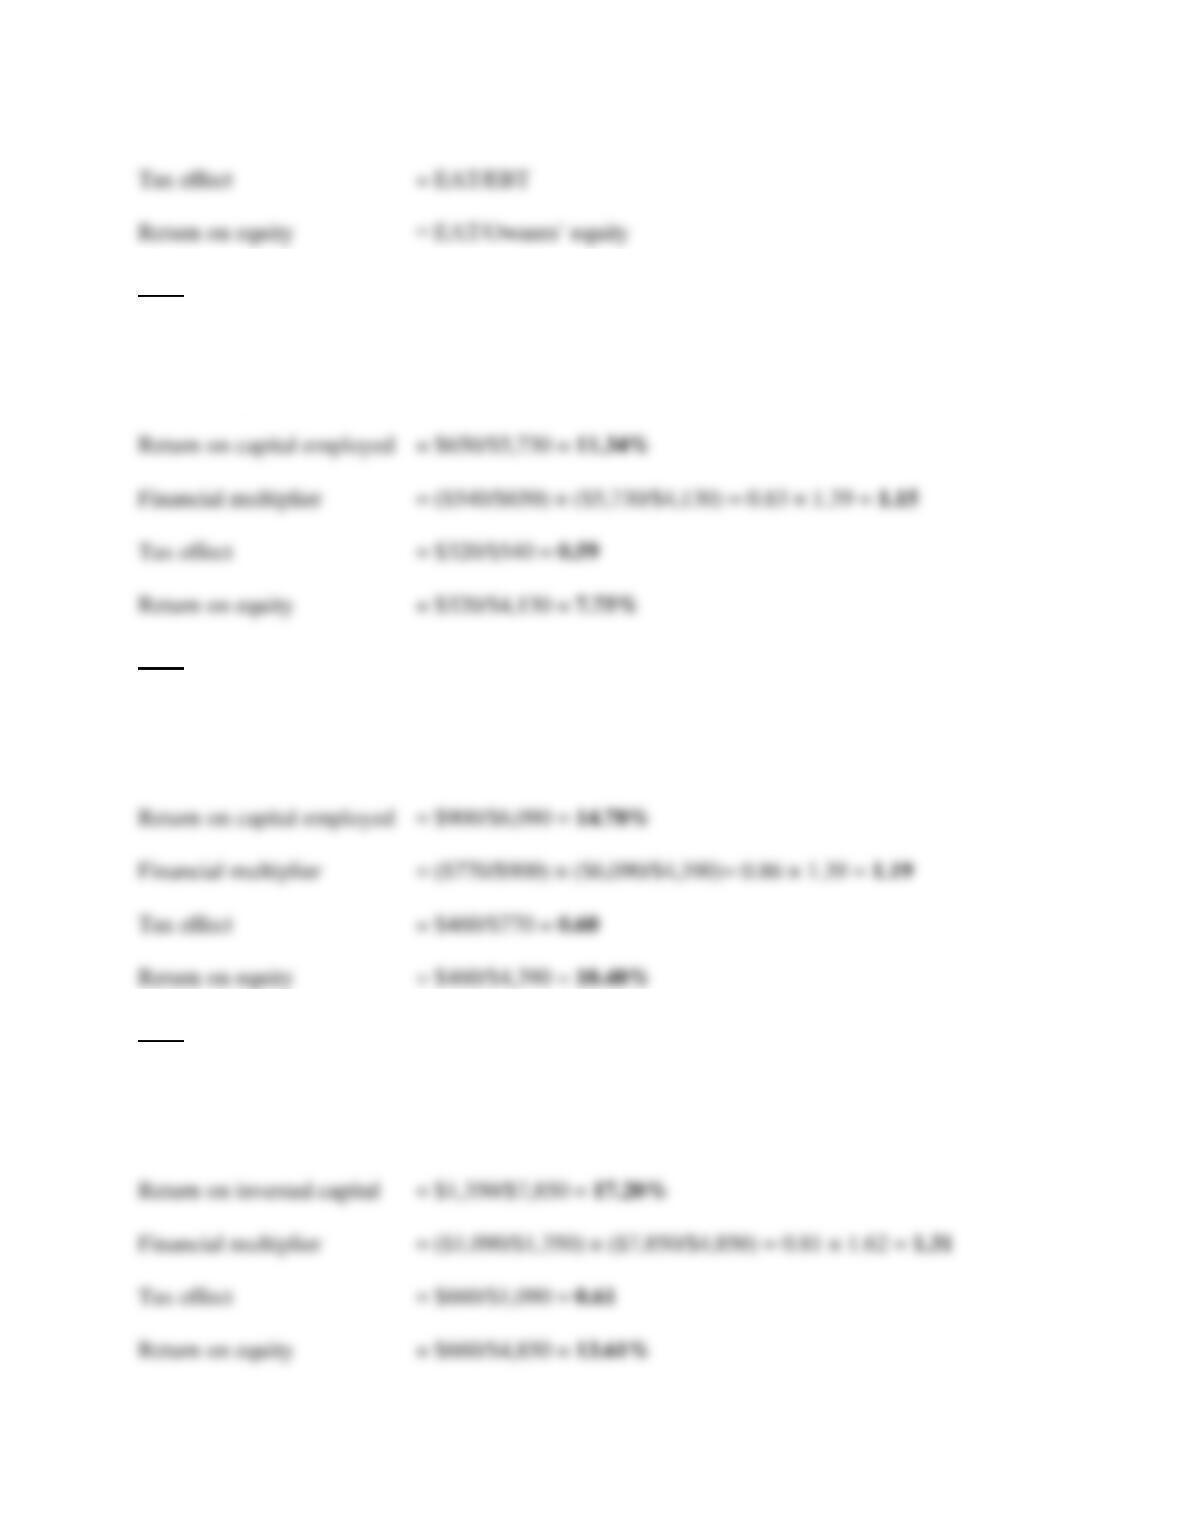
The return on invested capital (ROIC), which increased drastically from 11.34 percent in 2008 to
17.20 percent in 2010, was the main driver of the increase of the firm’s profitability during that
period. Furthermore, most of the ROIC increase comes from the operating margin which went up
from 2.94 percent in 2008 to 4.27 percent in 2010, while the invested capital turnover increased
only marginally from 3.86 to 4.03 during the same period.
d.
5-9
Pro forma working capital requirement (WCR)12/31/10
Accounts receivable12/31/10 =
365
salesNet 10
30 days
Accounts payable12/31/10 =
365
Purchases10
33 days =
+
365
sinventoriein Changesold goods ofCost 1010
33 days
=
−+
365
)200,3$138,3($100,25$
33 days = $2,264
Pro forma managerial balance sheet
in thousands
December 31, 2010
Invested capital
Cash
$ 1,379
Working capital requirement (WCR)
3,121
Net fixed assets
1,450
Total invested capital
$5,950
Capital employed
Short-term debt
Long-term financing
Long-term debt
Owners’ equity
Total capital employed
$5,950
5-10
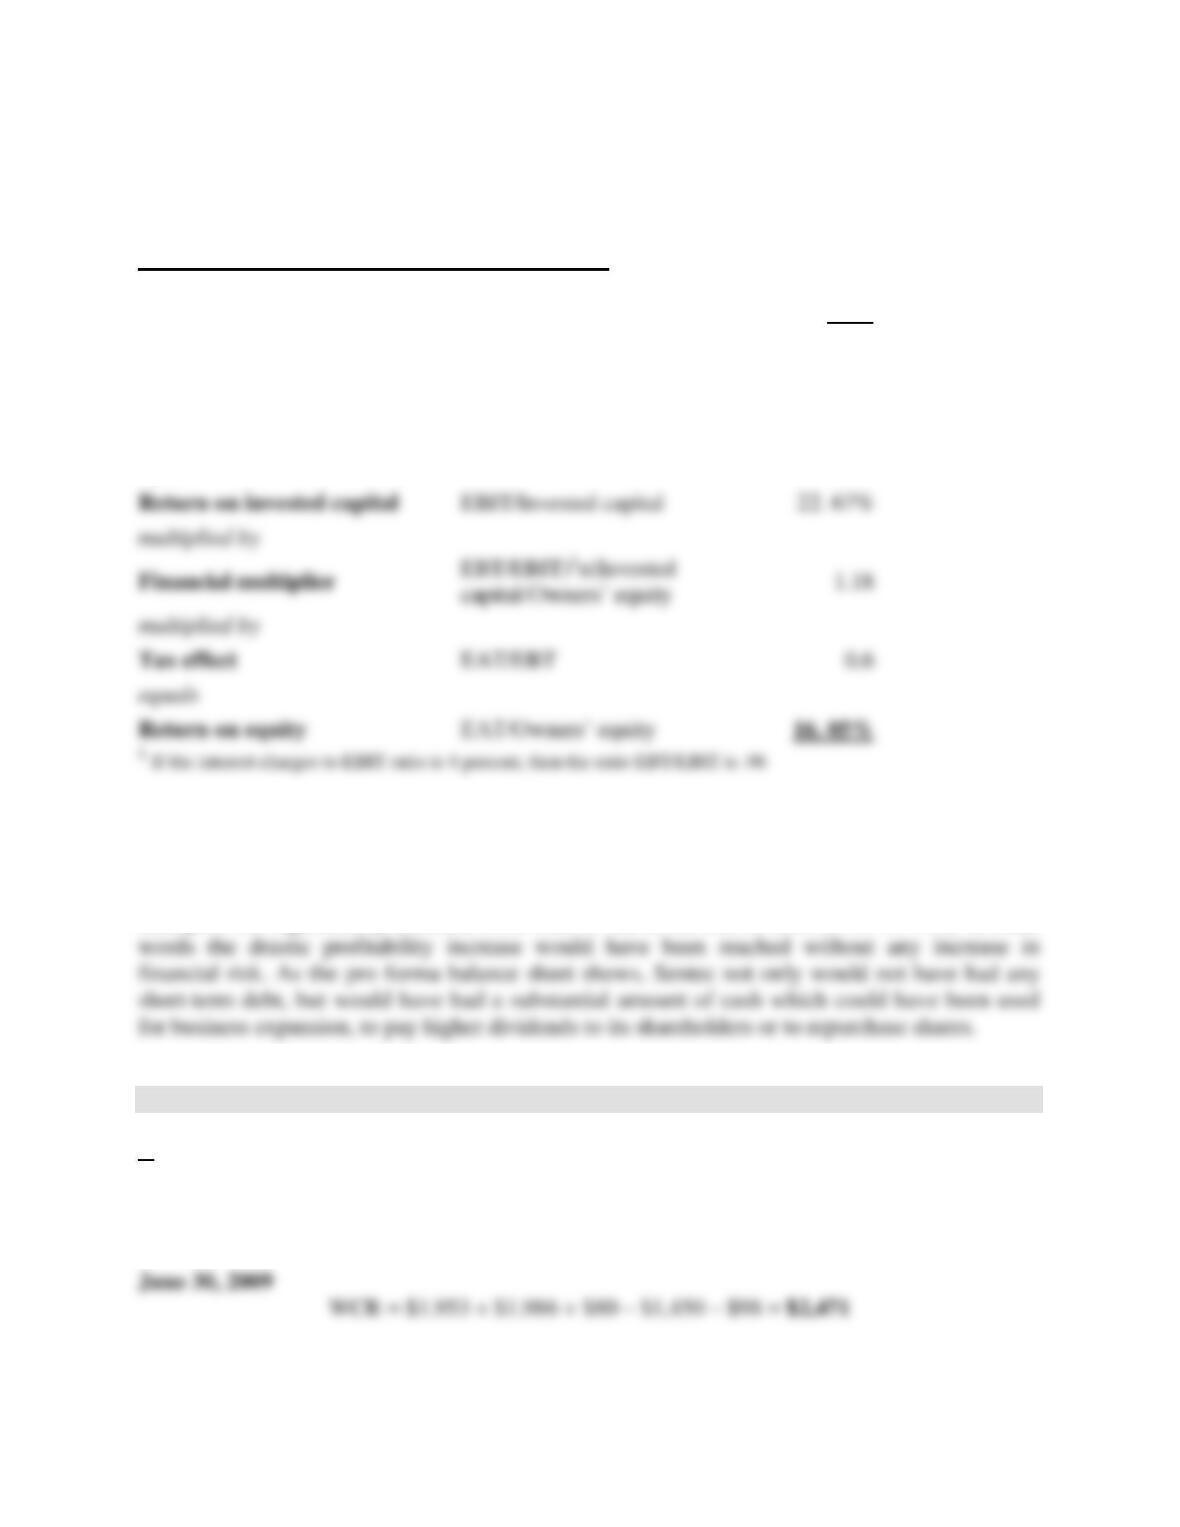
Note that the amount of long-term financing ($5,950) would have been higher than the
investment in fixed assets and in the operating cycle ($1,450 + $3,121 = $4,571). Sentec Inc.
would not have needed any short-term debt, and had $1,379 million (5,950 – $4,571) in cash.
The structure of the pro forma return on equity
2010
Operating margin
EBIT/Sales
4. 27%
multiplied by
Invested capital turnover
Sales/Invested Capital
5.31
equals
Note the drastic impact of a better management of the operating cycle on the return on invested
capital, which would have jumped from 4.03 to 5.31. As a result, the return on invested capital
would have reached 22.7 percent and the return on equity 16.05 percent, instead of 17.2 percent
and 13.61 percent, respectively. This improvement would have been realized with a financial
multiplier not significantly different from what it was at the end of 2008 (1.18 vs 1.15). In other
9. Seasonal business.
a.
Working capital requirement (WCR) = Accounts receivable + Inventories + Prepaid expenses
– Accounts payable – Accrued expenses
Return on invested capital
EBIT/Invested capital
multiplied by
multiplied by
Tax effect
EAT/EBT
equals
Return on equity
5-11
Managerial balance sheets
in thousands
June 30,
2009
December 31,
2009
June 30,
2010
Invested capital
Cash
$ 160
$ 60
$ 70
Working capital requirement (WCR)
2,471
3,288
2,422
Net fixed assets
733
818
830
Total invested capital
$3,364
$4,166
$3,322
Capital employed
Short-term debt
$ 880
$ 50
Long-term financing
Long-term debt
Owners’ equity
Total capital employed
$3,364
$3,322
b.
Operating margin = EBIT/Sales
Invested capital turnover = Sales/Invested capital
Return on invested capital = EBIT/Invested capital
6 Months to 6/30/2009
Operating margin = $117/$10,655 = 1.1% (rounded)
5-12
6 Months to 12/31/2009
Operating margin = $200/$13,851 = 1.4%
Invested capital turnover = $13,851/$4,166 = 3.32
6 Months to 6/30/2010
Operating margin = $133/$11,720 = 1.1%
Invested capital turnover = $11,720/$3,322 = 3.53 (rounded)
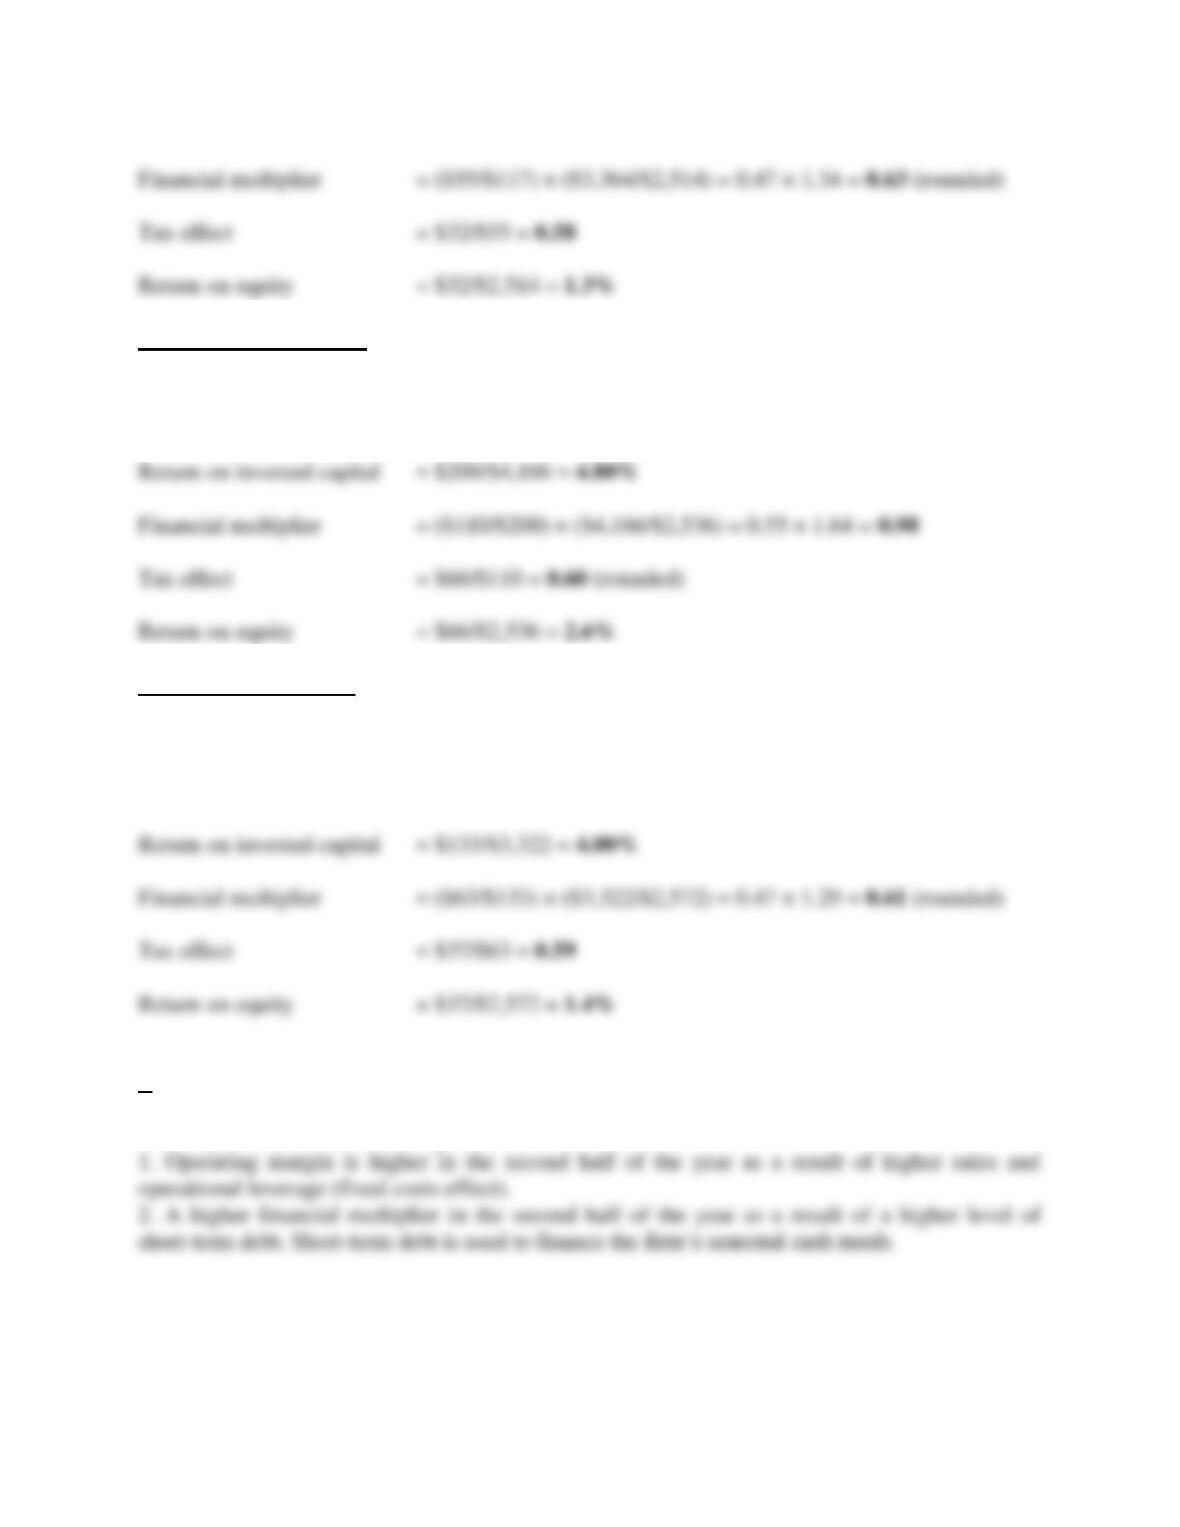
c.
Return on equity is higher in the second part of the year than in the first half (2.6 percent versus
1.3/1.4 percent) for the following reasons:
5-13
10. Self-sustainable growth rate.
a.
The five percent target growth rate would be attainable only if the firm’s self-sustainable growth
rate is at least equal to 5 percent. Ambersome’s self-sustainable rate can be computed as follows:
1. Assets turnover ratio
Sales/Total assets
.9
2. Profit margin
Earnings before interest and tax/Sales
8%
3. Return on equity
Earnings after tax/ Owners’ equity [(2) (1-.4) (1)]1
4.32%
4. Payout ratio
Dividends/ Earnings after tax
.4
5. Self-sustainable growth rate
[(3) [1 – (4)]
2.59%
c.
The firm’s return on equity, and as a result, its self-sustainable rate, would increase through debt
financing only if the rate at which the firm can borrow is lower than the return on assets. Since
the interest rate after tax that will be charged to Ambersome is 10 percent, and its return on
assets before tax is 7.2 percent, borrowing will not help in meeting the sales target of 5 percent.