4-1
Chapter 4
Answers to Review Problems
Finance For Executives – 4th Edition
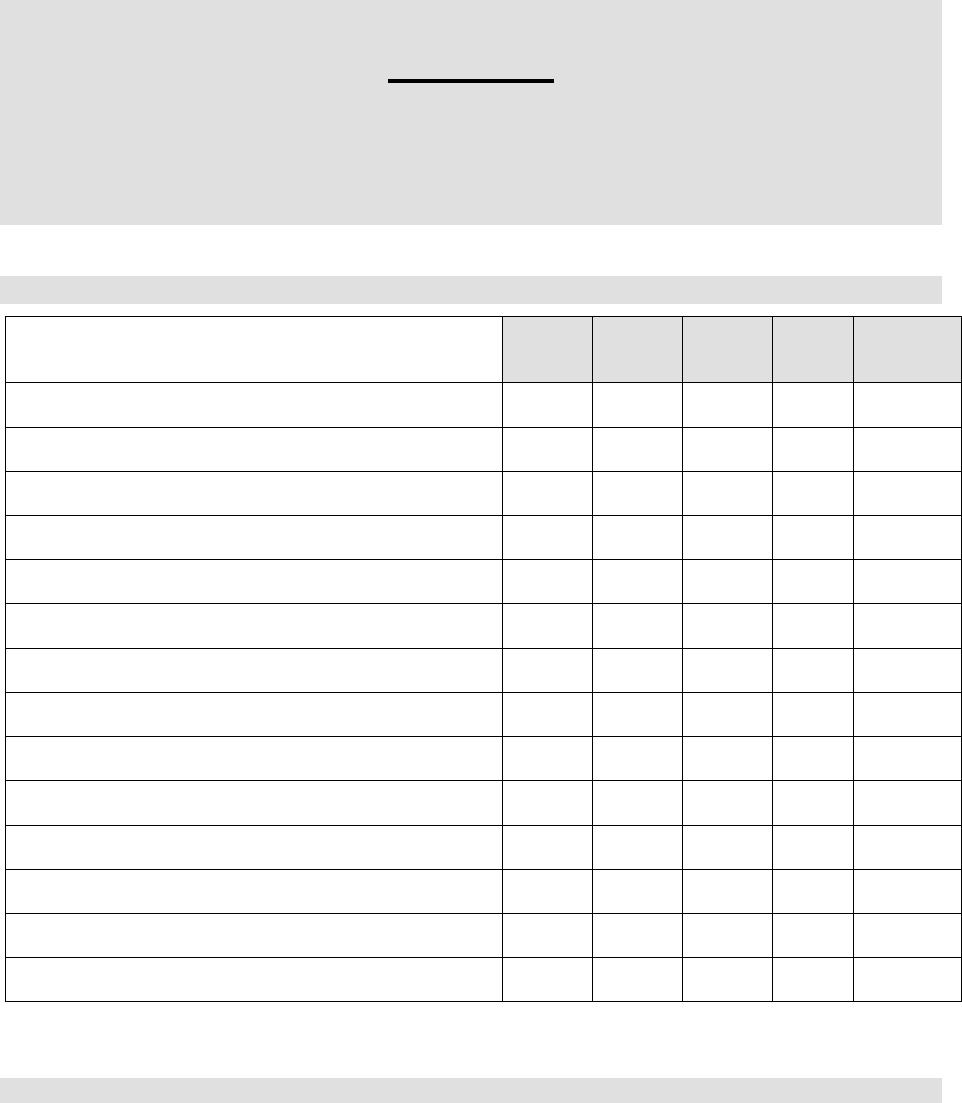
1. Transactions.
2. Profits, losses, and cash flows.
A company can show a profit, while, during the same period, the cash flows from operating activities are
negative because the investment component of the operating cycle (working capital requirement)
increased more than the margin component of the operating cycle.
At the opposite, a firm can show a loss when its cash flows from operating activities is positive in two
cases:
WCR
CFOPE
CFINV
CFFIN
Owners’
Equity
1. Shares are issued for cash.
0
0
0
+
+
2. Goods from inventory are sold for cash.
–
+
0
0
+
3. A fixed asset is sold for cash at a loss.
0
0
+
0
–
4. Corporate income tax is paid.
+
–
0
0
0
5. Cash is obtained through a bank loan.
0
0
0
+
0
6. A cash dividend is paid.
0
0
0
–
0
7. Accounts receivable are collected.
–
+
0
0
0
8. Minority interest in a firm is acquired for cash.
0
0
–
0
0
9. A fixed asset is depreciated.
0
0
0
0
–
10. Obsolete inventory is written off.
–
0
0
0
–
11. Insurance premium is paid.
+
–
0
0
0
12. Merchandise is purchased on account.
0
0
0
0
0
13. Interest on debt is paid.
0
0
0
–
–
14. Dividends from a subsidiary are received.
0
0
+
0
+
4-2
a. The margin component of the operating cycle is negative and the working capital requirement
decreased more than the absolute value of the margin component.
b. The margin component is positive and the working capital requirement increased less than the margin
component.
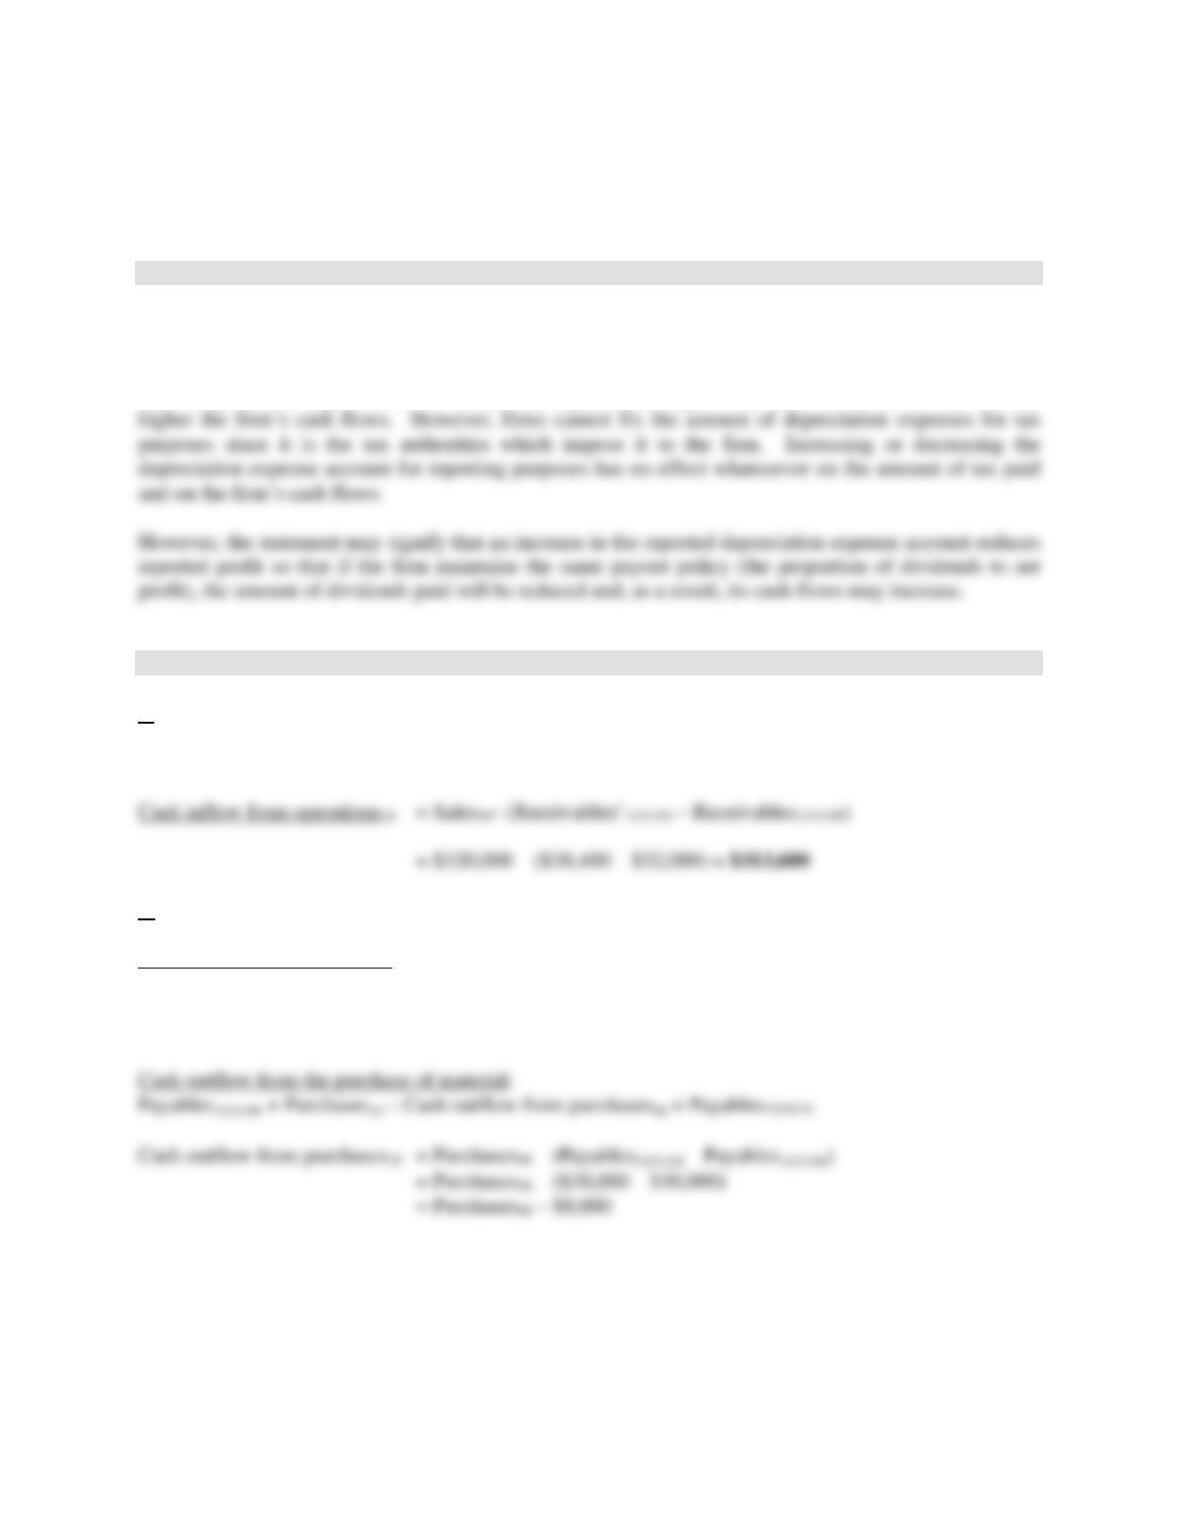
3. Depreciation and cash flows.
Depreciation expense is not a cash transaction. Thus, before tax, depreciation expense has no impact on
the firm’s cash flows. Depreciation expense appears in the indirect approach to the cash-flow statement
in order to cancel out with the same amount that negatively affects earnings after tax.
Since depreciation expense is a tax deductible expense, the higher it is , the lower the tax bill and the
4. Building a cash flow statement
a.
Receivables12/31/09 + Sales10 – Cash inflow from sales10 = Receivables12/31/10
b.
Cash outflow from operations = Cash outflow from the purchase of material
+ Cash outflow from labor expenses
+ Cash outflow from SG&A
+ Cash outflow from tax expenses
4-3
Cash outflow from labor expenses:
Accrued expenses12/31/09 + Labor expenses10 – Cash outflow from labor expenses10
= Accrued expenses12/31/10
Cash outflow from labor expenses10 = Labor expenses10
– (Accrued expenses12/31/10 – Accrued expenses12/31/09)
= $36,000 – ($2,000 – $4,000) = $38,000
Cash outflow from SG&A:
Prepaid expenses12/31/09 – SG&A expenses10 + Cash outflow from SG& expenses10
= Prepaid expenses12/31/10
Cash outflow from SG&A expenses10 = SG&A expenses10 + (Prepaid expenses 12/31/10 – Prepaid
expenses12/31/09)
= $18,000 + ($2,200 – $1,500) = $18,700
Cash outflow from tax expenses10:
= $10,800
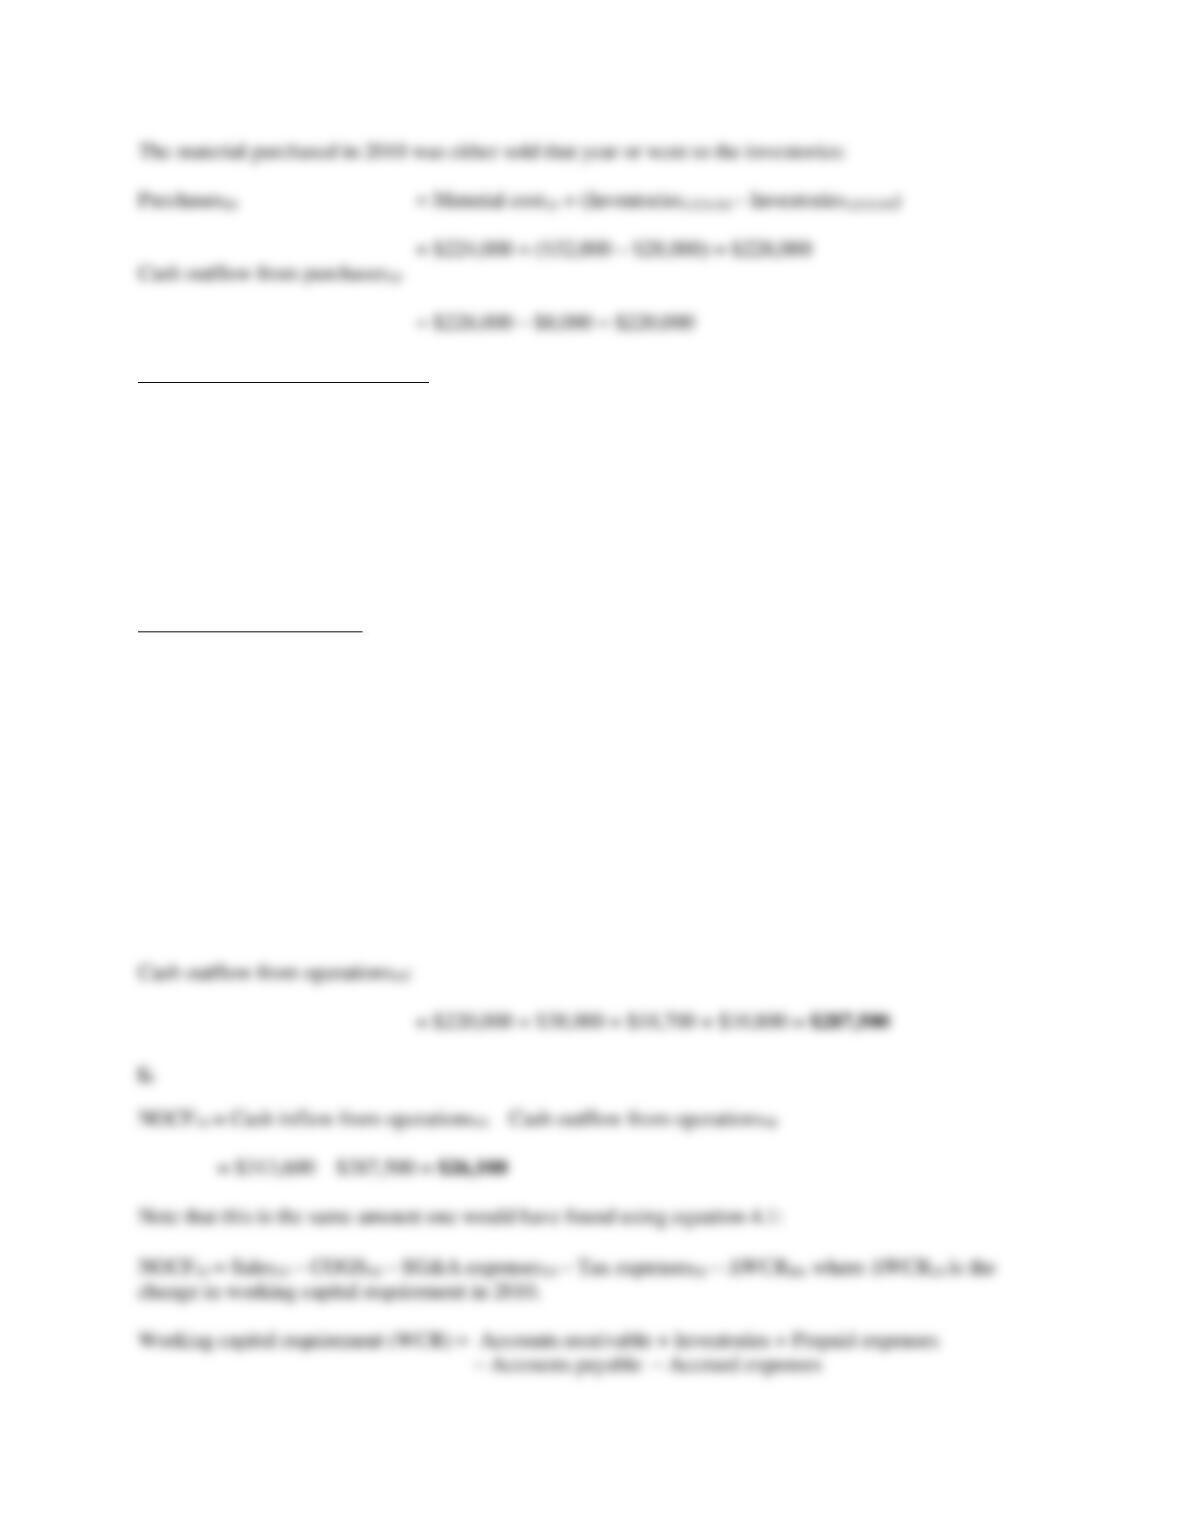
4-4
d.
Net fixed assets12/31/09 + Acquisitions10 – Disposals10 – Depreciation expenses10 = Net fixed assets12/31/10
Since there was no disposal of fixed assets in 2010, the net cash flow from investing activities was equal
to the amount of acquisitions during that year.
Acquisitions10 = Net fixed assets12/31/10 – Net fixed assets12/31/09 + Depreciation expenses10
Net cash flow from investing activities10 = $81,000 – $76,000 + $9,000 = ($14,000)
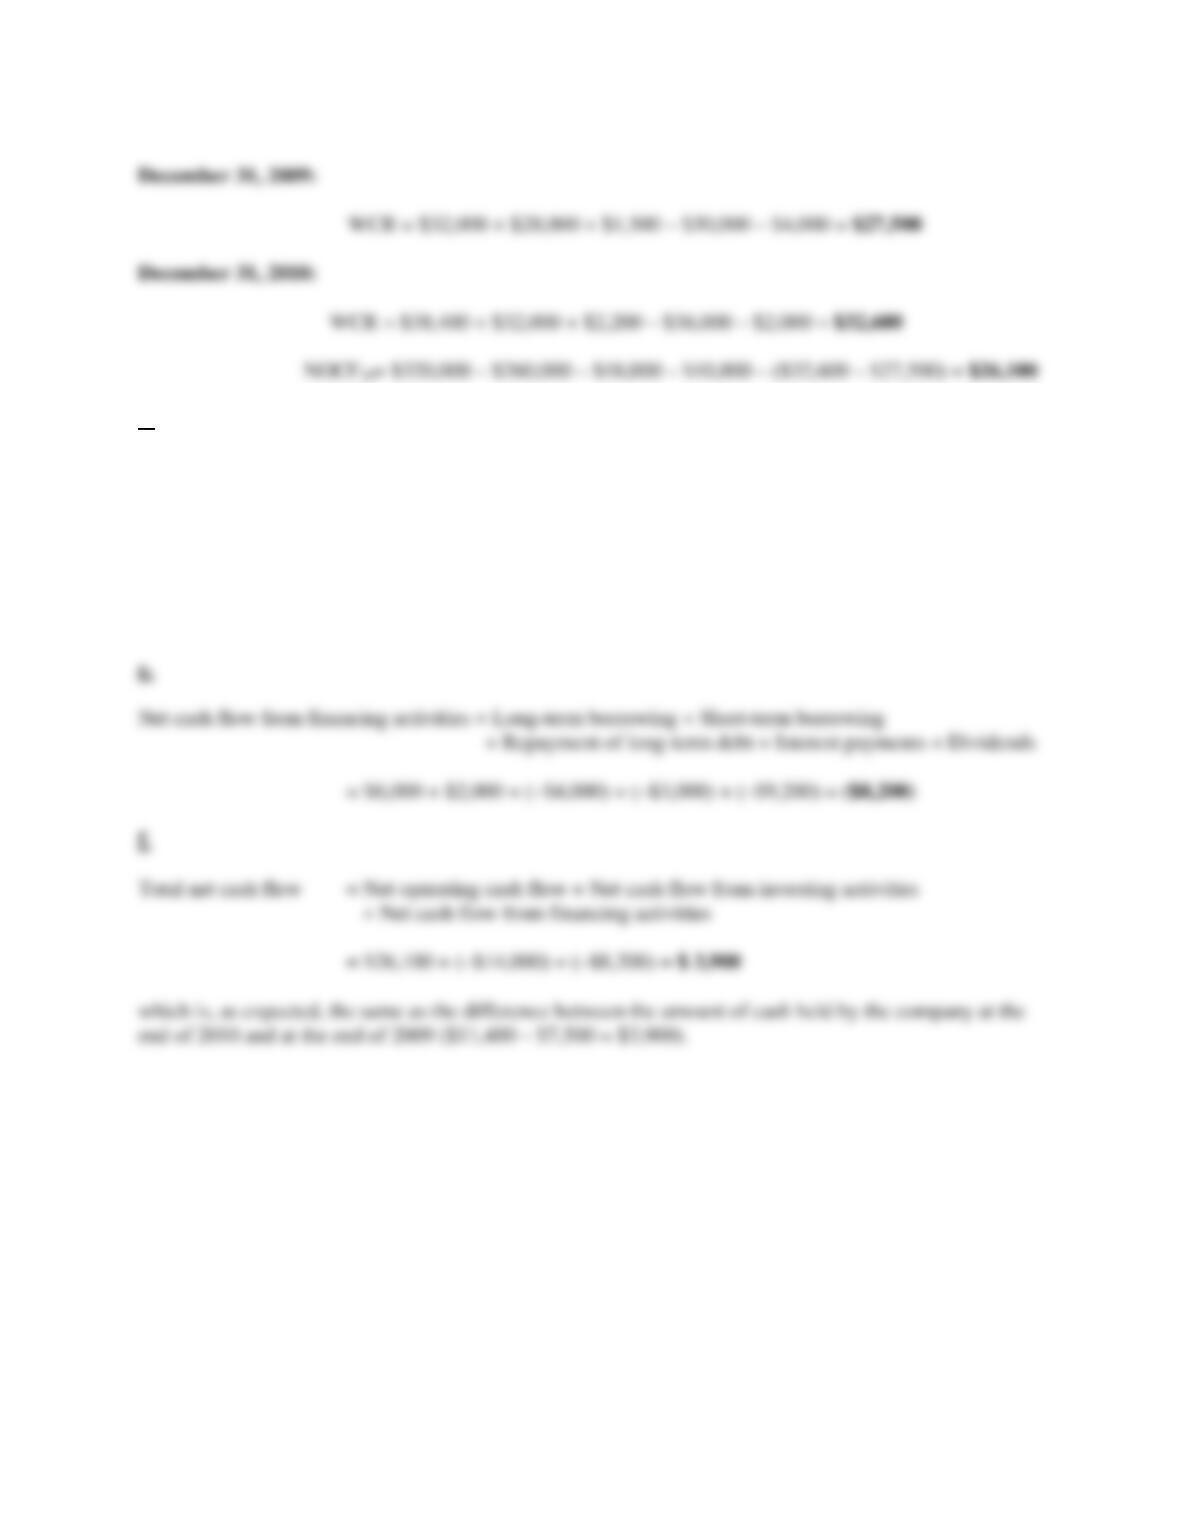
4-5
5. Two cash flow statements.
a.
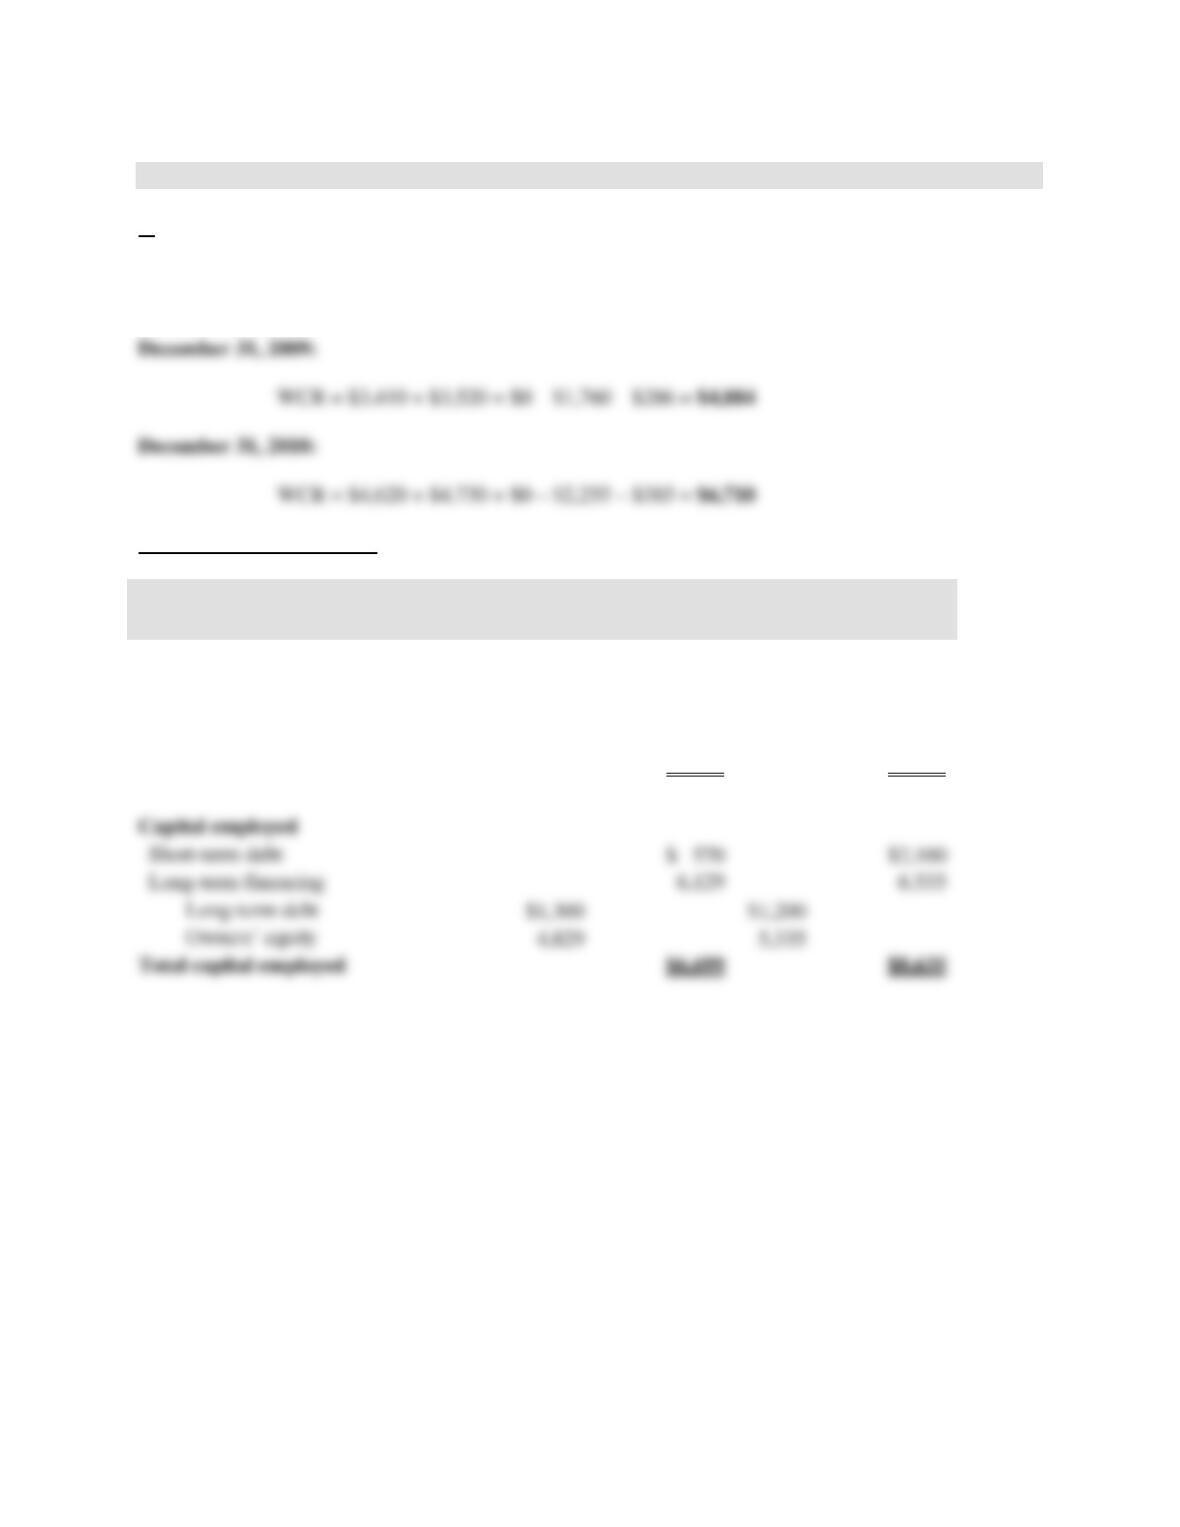
Working capital requirement (WCR) = Accounts receivable + Inventories + Prepaid expenses
– Accounts payable – Accrued expenses
Managerial balance sheets
in thousands
December 31,
2009
December 31,
2010
Invested capital
Cash
$ 385
$ 330
Working capital requirement (WCR)
4,884
6,710
Net fixed assets
1,430
1,595
Total invested capital
$6,699
$8,635
Capital employed
Short-term debt
$ 570
$2,100
Long-term financing
Long-term debt
Owners’ equity
Total capital employed
$6,699
$8,635
4-6
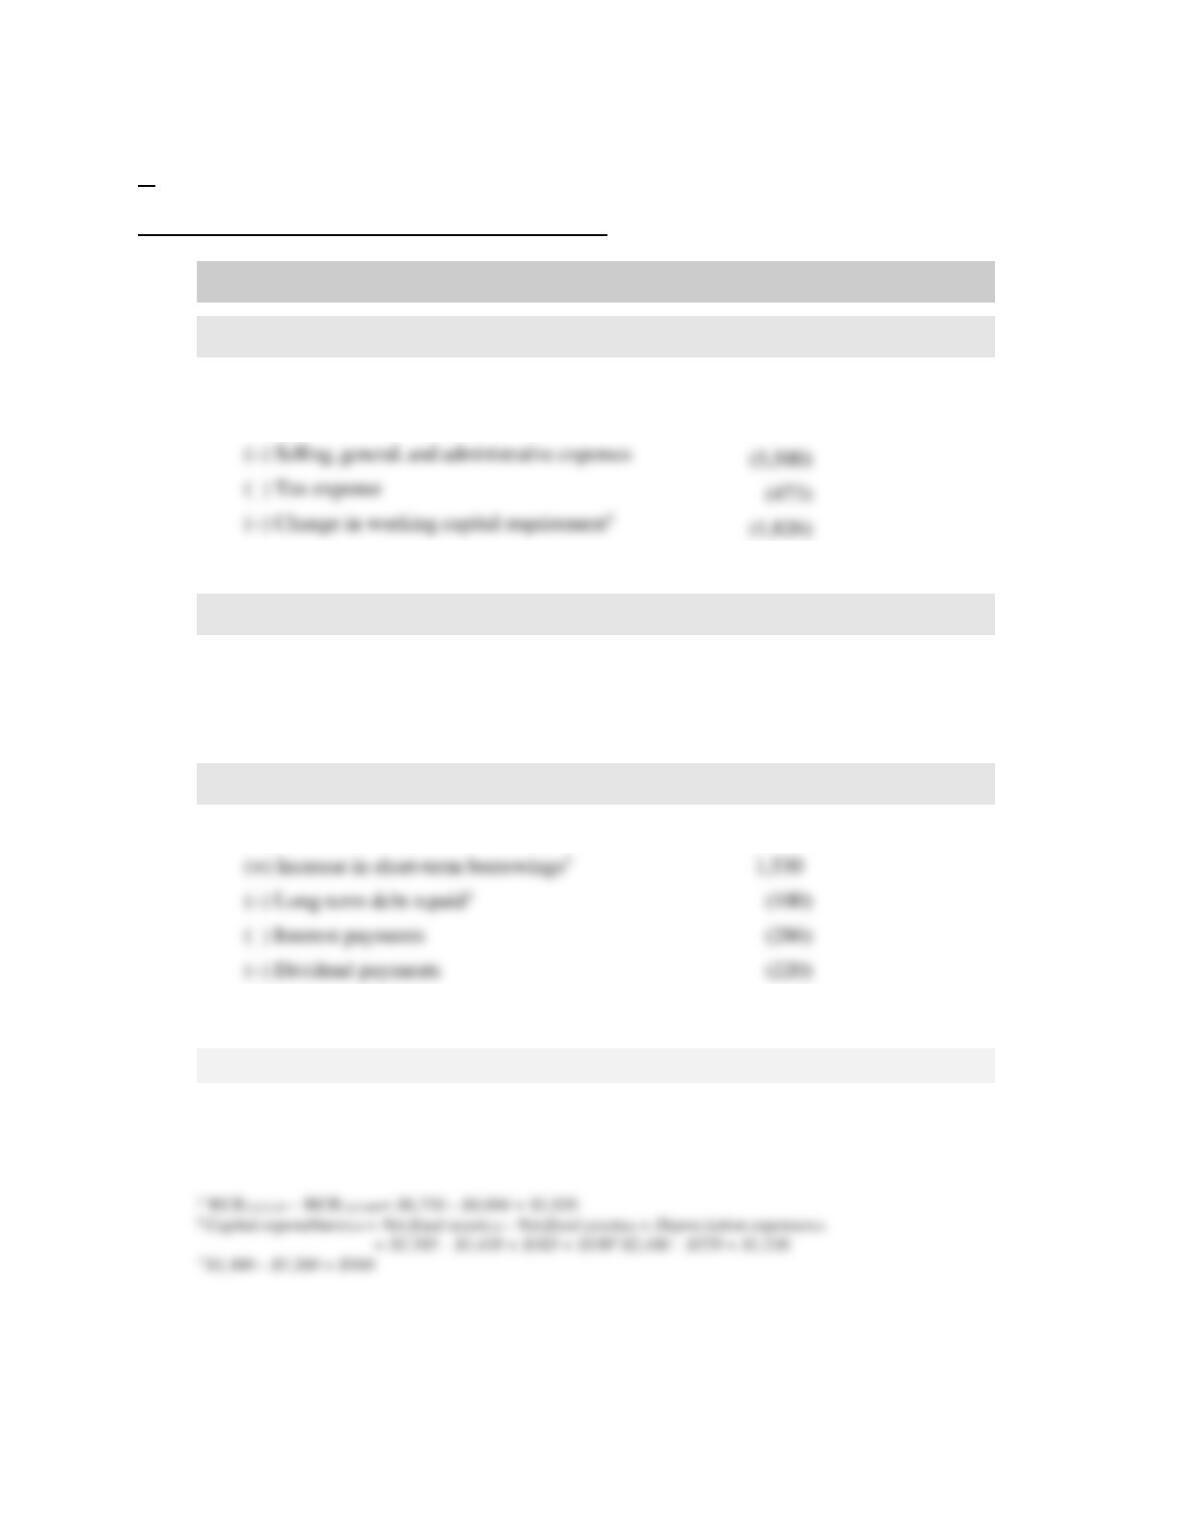
b.
Cash-flow statement according to the direct method
in thousands
2010
• Cash flows from operating activities
(+) Net sales
$ 34,760
(–) Cost of goods sold
(27,610)
A. Net operating cash flow (NOCF)
($649)
• Cash flows from investing activities
(+) Sale of fixed assets
0
(–) Capital expenditures2
(330)
B. Net cash flow from investing activities
($330)
• Cash flows from financing activities
(+) Increase in long-term borrowings
0
(+) Increase in short-term borrowings3
1,530
(100)
(–) Interest payments
(286)
(–) Dividend payments
(220)
C. Net cash flow from financing activities
$924
D. Total net cash flow (A + B + C)
($55)
E. Opening cash
$385
F. Closing cash (E + D)
$330
(–) Selling, general, and administrative expenses
(5,500)
(–) Tax expense
(473)
(–) Change in working capital requirement1
(1,826)
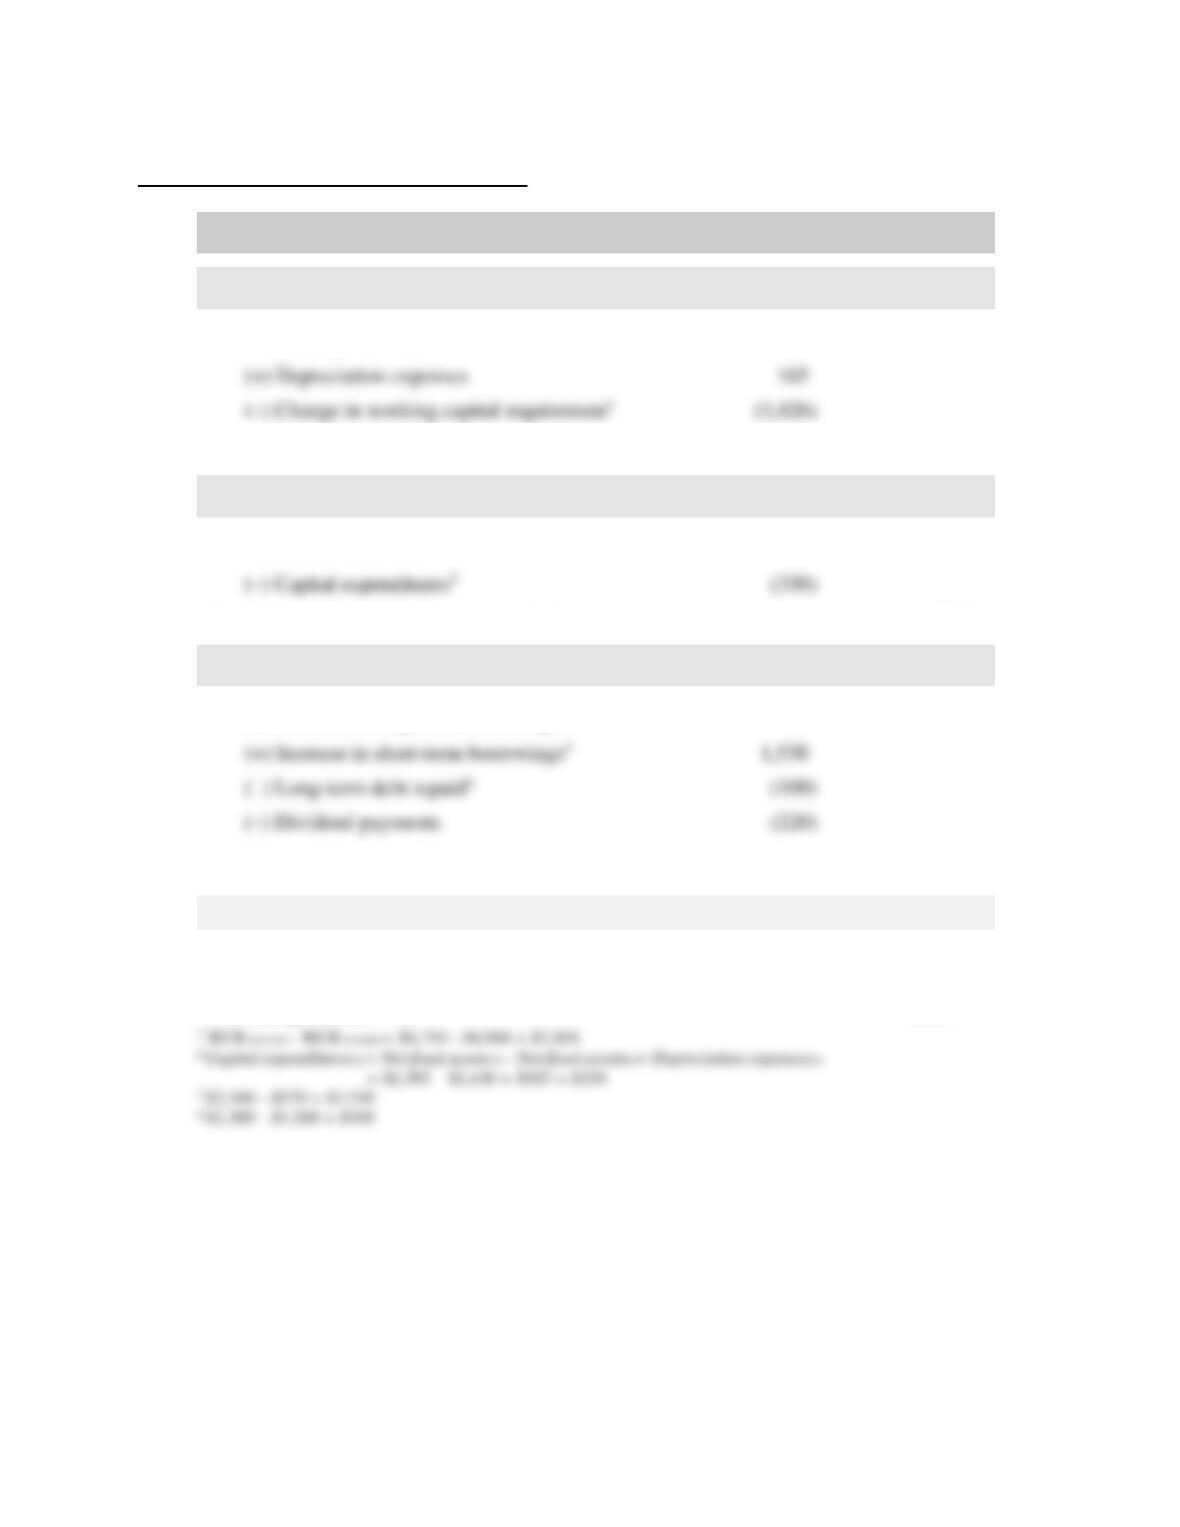
4-7
Cash-flow statement according to FASB 95
in thousands
2010
• Cash flows from operating activities
(+) Earnings after tax
$726
A. Net cash provided by operating activities
($935)
• Cash flows from investing activities
(+) Sale of fixed assets
0
(–) Capital expenditures2
(330)
B. Net cash flow from investing activities
($330)
• Cash flows from financing activities
(+) Increase in long-term borrowings
0
(+) Increase in short-term borrowings3
1,530
(100)
(–) Dividend payments
(220)
C. Net cash flow from financing activities
$1,210
D. Total net cash flow (A + B + C)
($55)
E. Opening cash
$385
F. Closing cash (E + D)
$330
(+) Depreciation expenses
165
(–) Change in working capital requirement1
(1,826)
4-8
6. From the statement of cash flows (FASB 95) to the cash-flow statement (direct
approach).
There are two adjustments to make on the FASB 95 statement to prepare the firm’s cash flow statement:
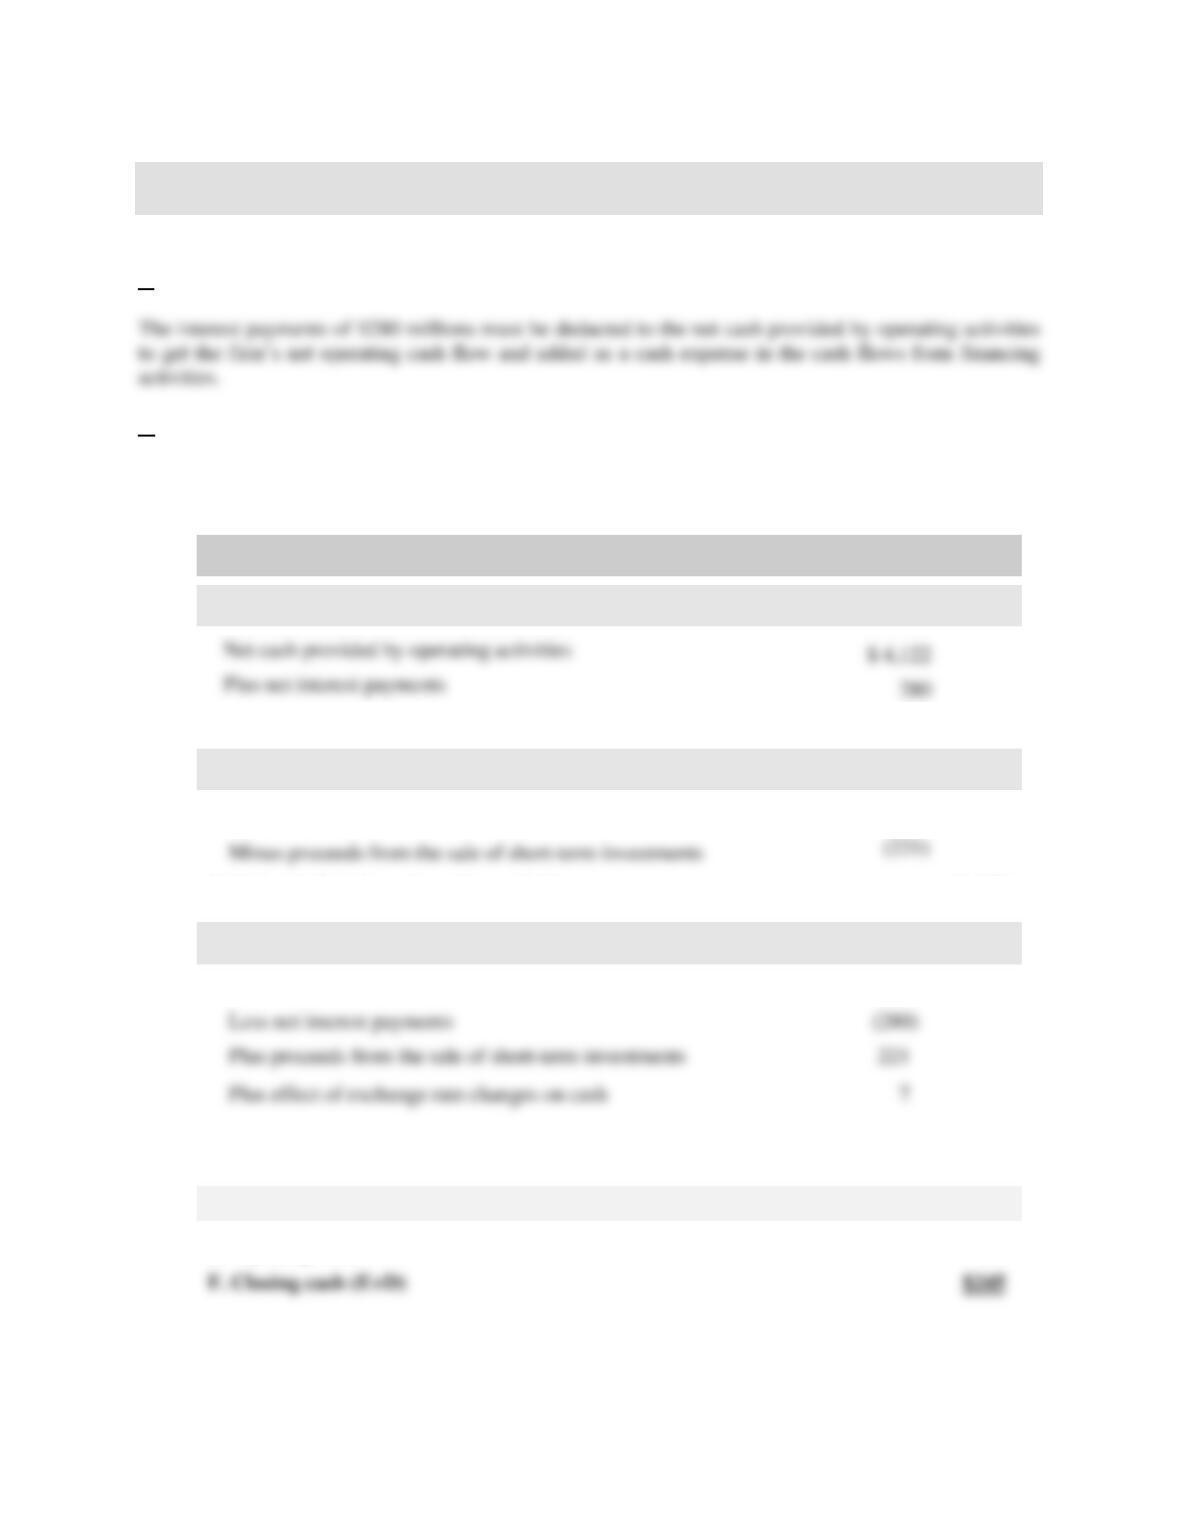
a.
b.
The proceeds from the sale of short-term investments of $221 million should be deducted from the cash
flows from investing activities and added to the cash flows from financing activities:
in millions
2008
• Cash flows from operating activities
Net cash provided by operating activities
Plus net interest payments
A. Net operating cash flow
$4,402
• Cash flows from investing activities
Net cash used in investing activities
(3,226)
Minus proceeds from the sale of short-term investments
(221)
B. Net cash flow from investing activities
(3,447)
• Cash flows from financing activities
Net cash used in financing activities
(939)
Less net interest payments
(280)
C. Net cash flow from financing activities
(991)
D. Total net cash flow (A+B+C)
(36)
E. Opening cash
281
4-9
7. Direct versus indirect approach to cash-flow estimation.
The FASB 95 method is a form of the indirect approach (see Exhibit 4.7). Note that interest expenses are
considered as a consequence of the operating activities of the firm since the net cash provided by
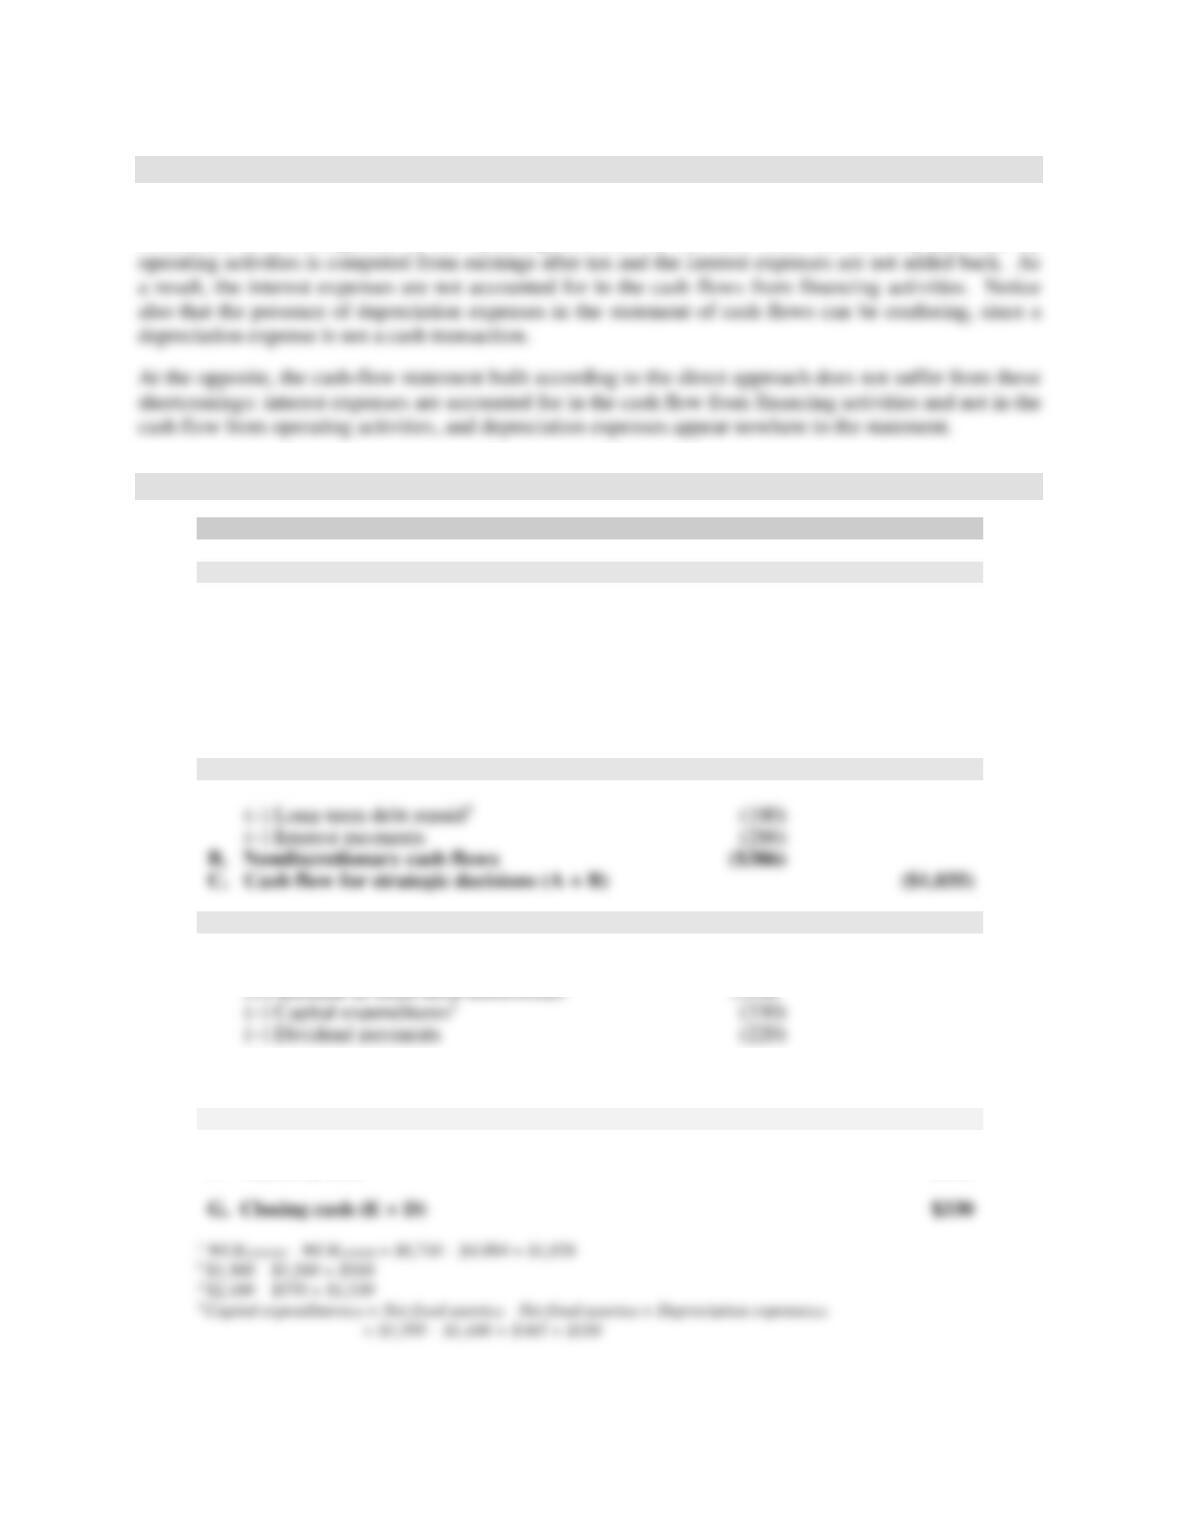
8. Another version of the cash-flow statement.
in thousands
2010
• Cash flows from operating activities
(+) Net sales
$34,760
(–) Cost of goods sold
(27,610)
(–) Selling, general, and administrative expenses
(5,500)
(–) Tax expense
(473)
(–) Change in working capital requirement1
(1,826)
A. Net operating cash flow (NOCF)
($649)
• Nondiscretionary cash flows
(–) Long-term debt repaid2
(100)
(–) Interest payments
(286)
B. Nondiscretionary cash flows
($386)
C. Cash flow for strategic decisions (A + B)
• Discretionary cash flows
(+) Increase in long-term borrowings
0
(+) Increase in short-term borrowings3
1,530
(–) Capital expenditures4
(330)
(–) Dividend payments
(220)
D. Discretionary cash flows
$980
E. Total net cash flow (C + D)
($55)
F. Opening cash
$385
G. Closing cash (E + D)
$330
4-10
This cash-flow statement emphasizes the difference between the cash flows that are related to contractual
obligations, such as debt repayment and interest payments, and the cash flows that are related to decisions
that are at the discretion of management, such as capital expenditures, new financing decisions and
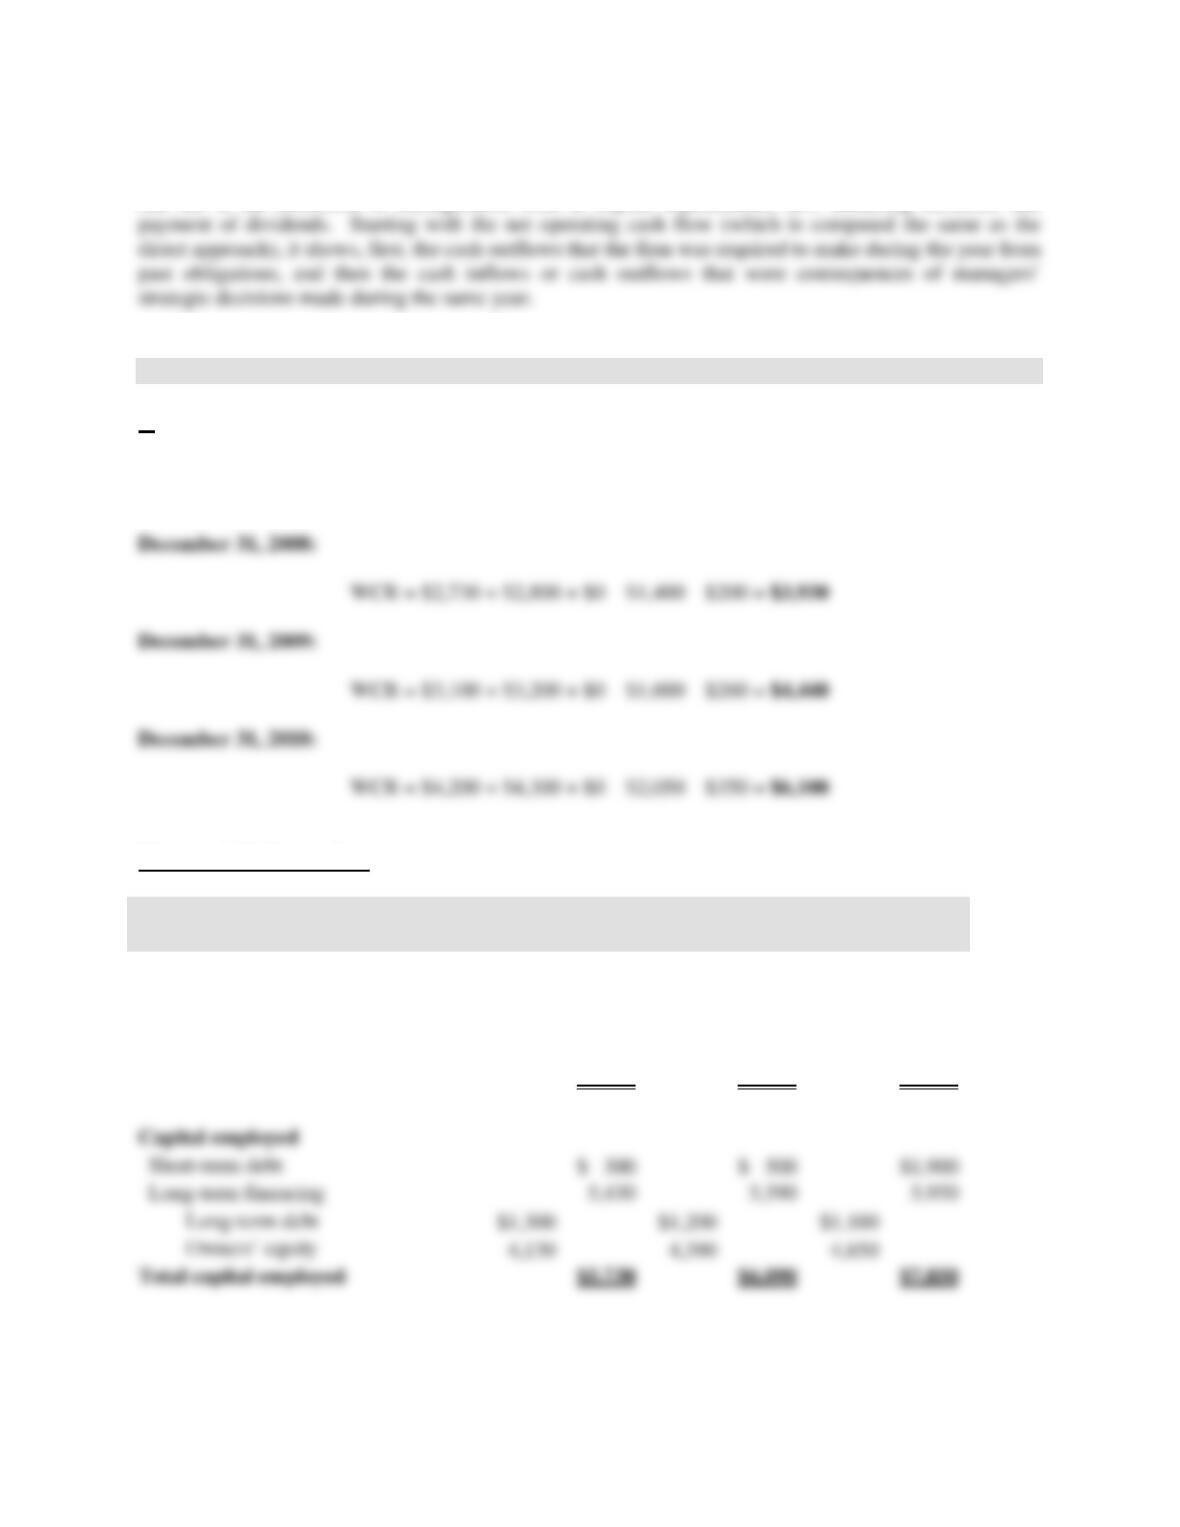
9. The effect of the management of the operating cycle on the firm’s cash flows.
a.
Working capital requirement (WCR) = Accounts receivable + Inventories + Prepaid expenses
– Accounts payable – Accrued expenses
Managerial balance sheet
in thousands
December, 31,
2008
December 31,
2009
December 31,
2010
Invested capital
Cash
$ 600
$ 350
$ 300
Working capital requirement (WCR)
3,930
4,440
6,100
Net fixed assets
1,200
1,300
1,450
Total invested capital
$5,730
$6,090
$7,850
Capital employed
Short-term debt
$ 300
$ 500
$1,900
Long-term financing
Long-term debt
Owners’ equity
Total capital employed
$5,730
$6,090
$7,850
4-11
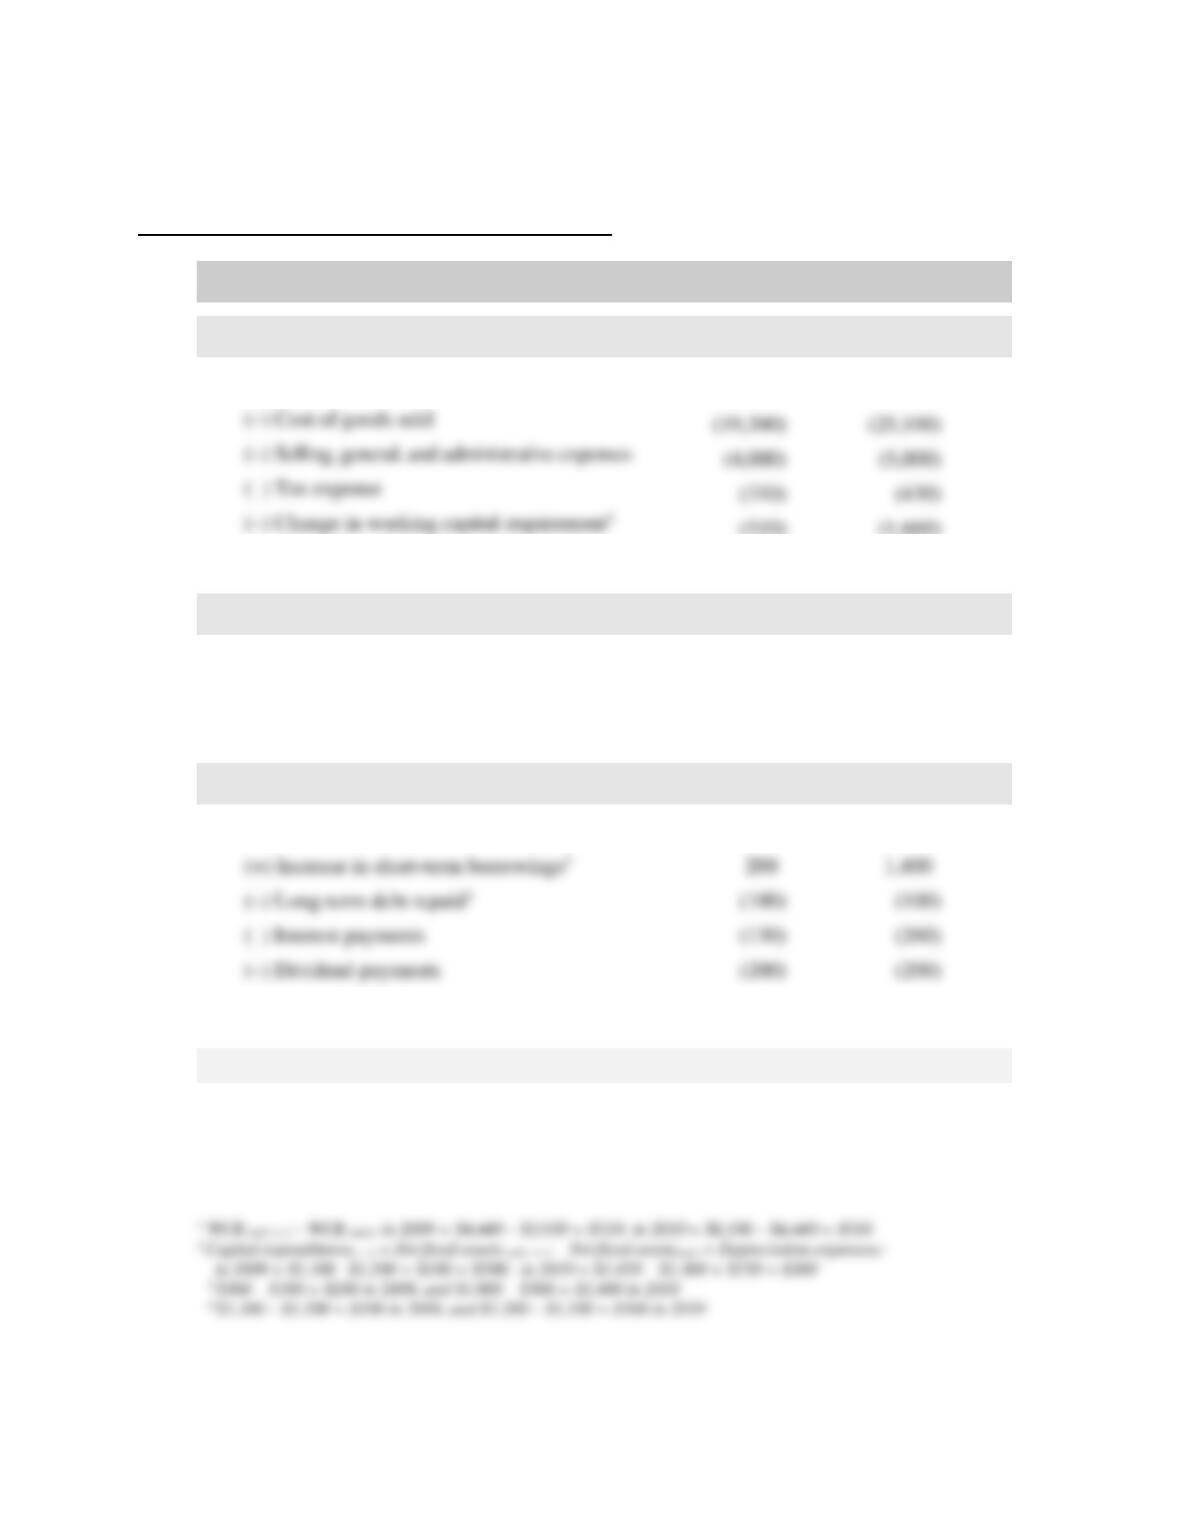
b.
Cash-flow statement according to the direct method.
in thousands
2009
2010
• Cash flows from operating activities
(+) Net sales
$24,300
$31,600
(510)
(1,660)
A. Net operating cash flow (NOCF)
$180
($590)
• Cash flows from investing activities
(+) Sale of fixed assets
0
0
(–) Capital expenditures2
(200)
(300)
B. Net cash flow from investing activities
($200)
($300)
• Cash flows from financing activities
(+) Increase in long-term borrowings
0
0
(+) Increase in short-term borrowings3
200
1,400
(100)
(100)
(–) Interest payments
(130)
(260)
(–) Dividend payments
(200)
(200)
C. Net cash flow from financing activities
($230)
$840
D. Total net cash flow (A + B + C)
($250)
($50)
E. Opening cash
$600
$350
F. Closing cash (E + D)
$350
$300
(–) Cost of goods sold
(19,300)
(25,100)
(–) Selling, general, and administrative expenses
(4,000)
(5,000)
(–) Tax expense
(310)
(430)
(–) Change in working capital requirement1
4-12
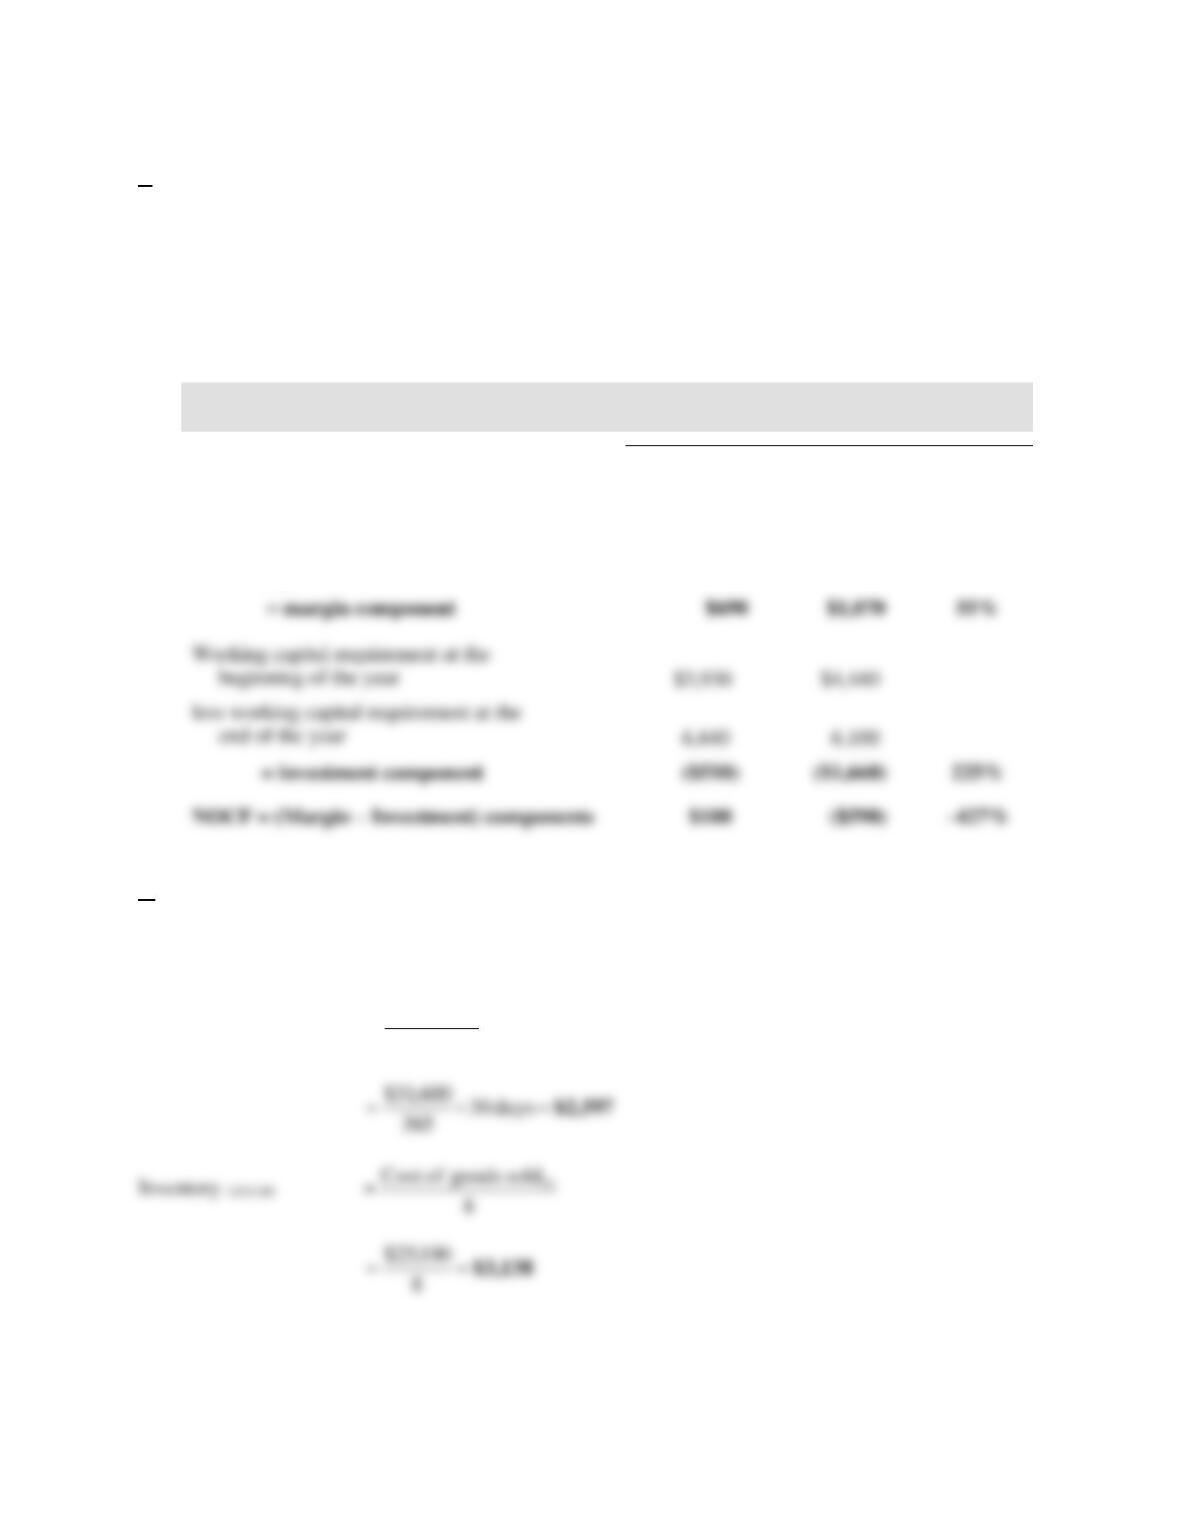
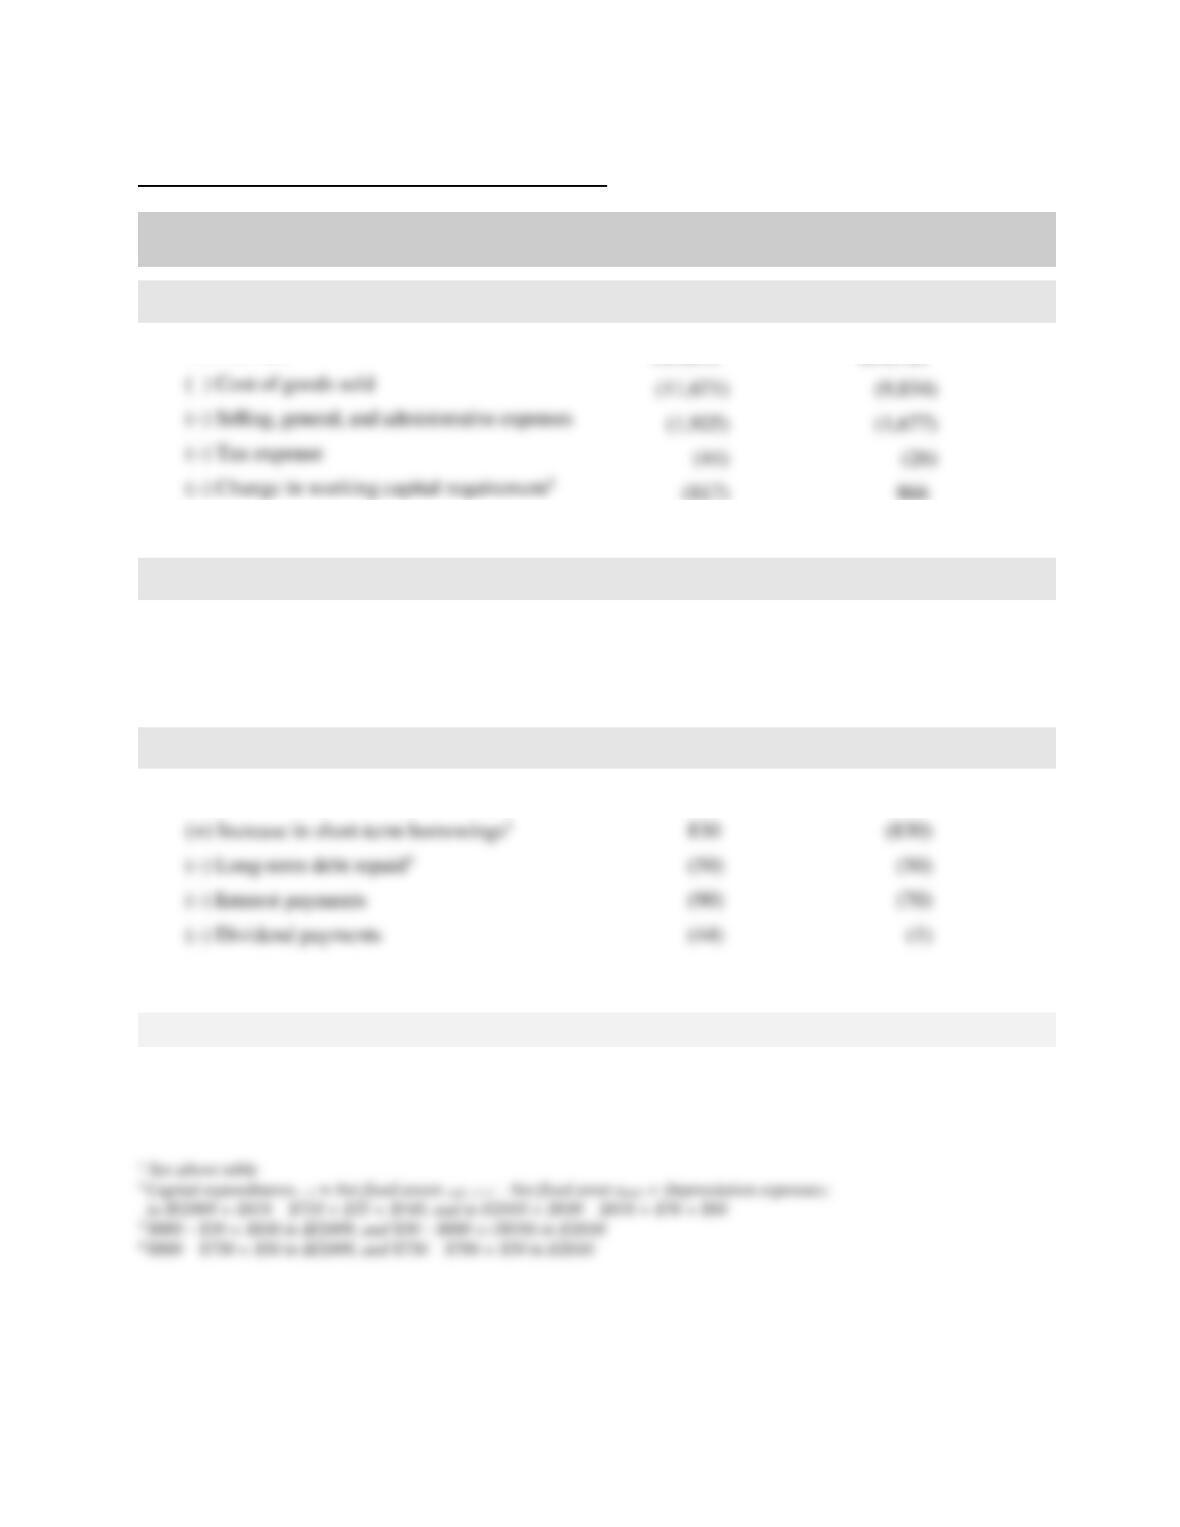
c.
The drastic decrease in the operating cash flow from a positive $180,000 in 2009 to a negative $590,000
in 2010 can originates either from its margin component or its investment component, or both.
From the following table, it is clear that the decrease in the firm’s operating cash flow came from a drastic
increase in its working capital requirement. While the margin component increased by 55 percent over
the two-year period, the investment component exploded by more than 200 percent (225 percent).
in thousands
2009
2010
Percent
change
Sales
$24,300
$31,600
30%
less COGS
19,300
25,100
less SG&A expenses
4,000
5,000
less tax expenses
310
430
d.
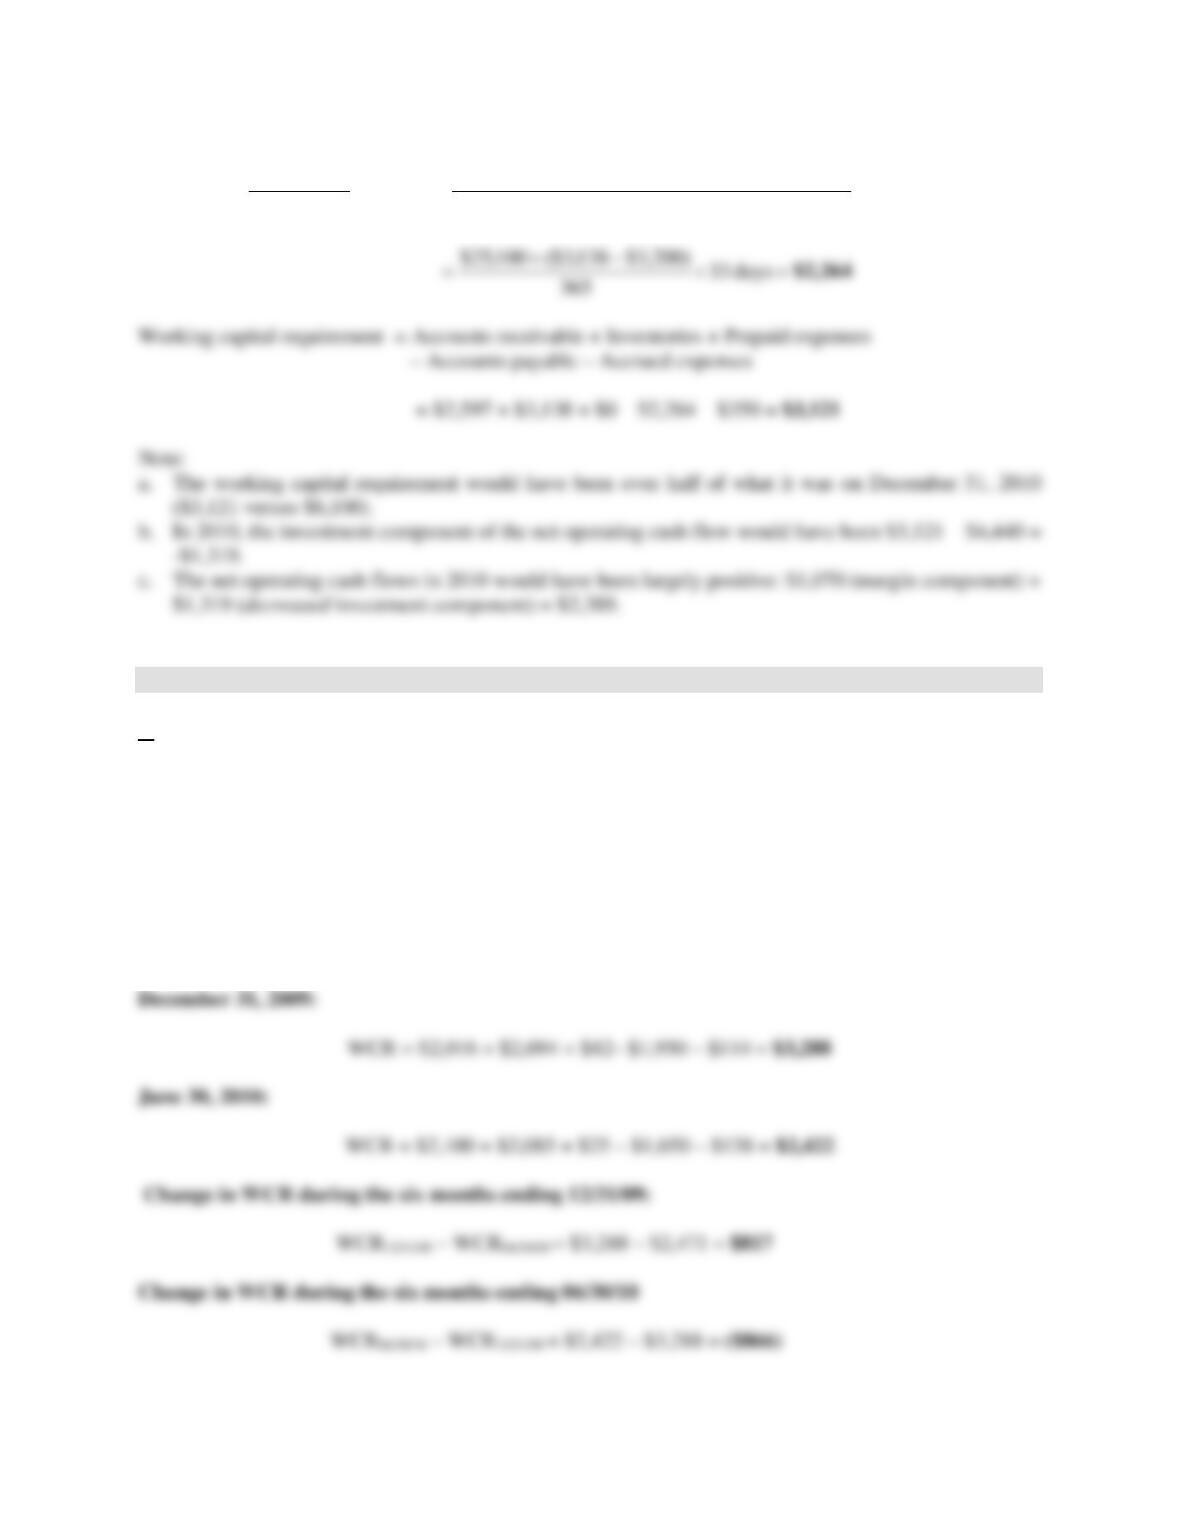
If Sentec Inc. had managed its operating cycle with the same efficiency as the average firm in the sector,
we would have (in $ thousands):
Accounts receivable12/31/10 =
days30
365
salesNet 10
4-13
Accounts payable12/31/10 =
days33
365
sinventorieinChangesoldgoodsofCost
days33
365
Purchases 101010
+
=
10. Seasonal business.
a.
To prepare the cash-flow statement, we need to compute the change in the firm’s working capital
requirement (WCR) during the two six-month periods.
Working capital requirement (WCR) = Accounts receivable + Inventories + Prepaid expenses
– Accounts payable – Accrued expenses
June 30, 2009: WCR = $1,953 + $1,986 + $80 – $1,450 – $98 = $2,471
4-14
Cash-flow statement according to the direct method
in thousands
Six months ending
12/31/09
Six months ending
06/30/10
• Cash flows from operating activities
(+) Net sales
$13,851
$11,720
A. Net operating cash flow (NOCF)
($606)
$1,049
• Cash flows from investing activities
(+) Sale of fixed assets
0
0
(–) Capital expenditures2
(140)
(88)
B. Net cash flow from investing activities
($140)
($88)
• Cash flows from financing activities
(+) Increase in long-term borrowings
0
0
(+) Increase in short-term borrowings3
830
(830)
(50)
(50)
(–) Interest payments
(90)
(70)
(–) Dividend payments
(44)
(1)
C. Net cash flow from financing activities
$646
($951)
D. Total net cash flow (A + B + C)
($100)
$10
E. Opening cash
$160
$60
F. Closing cash (E + D)
$60
$70
(–) Cost of goods sold
(11,671)
(9,834)
(–) Selling, general, and administrative expenses
(1,925)
(1,677)
(–) Tax expense
(44)
(26)
(–) Change in working capital requirement1
(817)
866
4-15
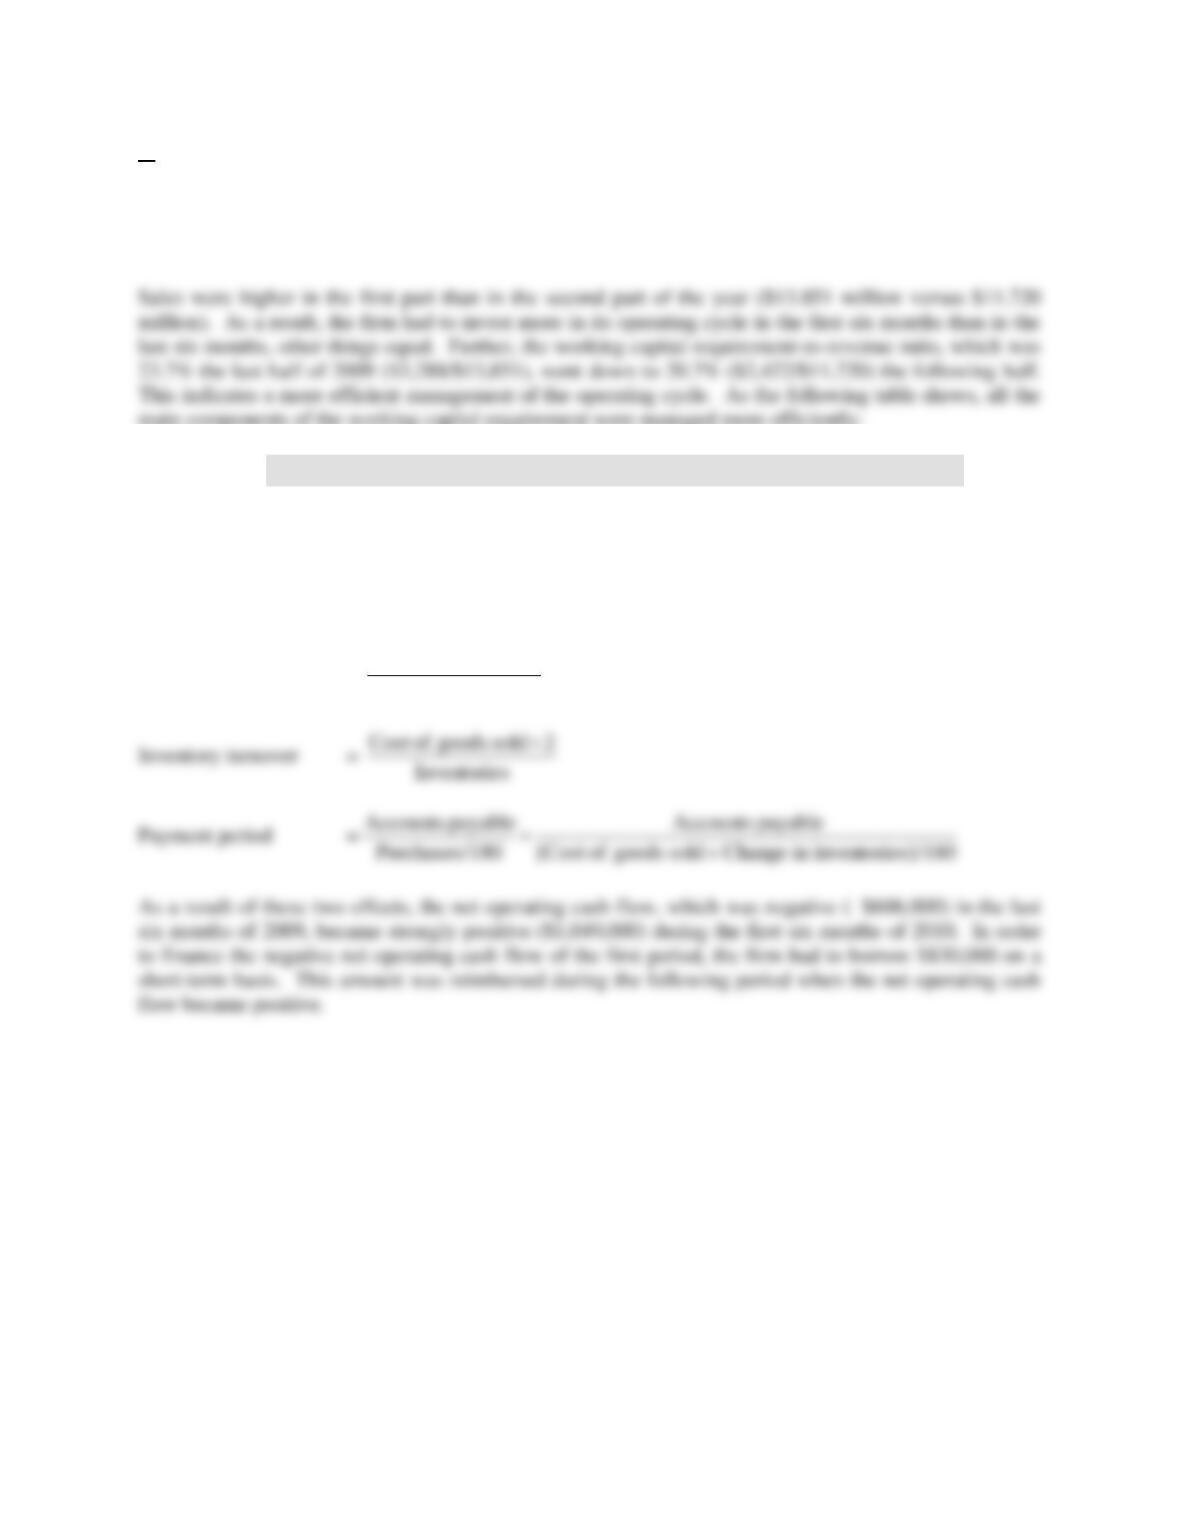
b.
The total net cash flow which changed from –$100,000 to +$10,000 from the second half of 2009 to the
first half of 2010 is a consequence of both the seasonality of the business, and of improvements in the
management of the operating cycle during the second six-month period.
main components of the working capital requirement were managed more efficiently:
December 31, 2009
June 30, 2010
Collection period
34 days
32.3 days
Inventory turnover
8.7
9.4
Payment period
28.4 days
32.2 days
where:
Collection period days =
180/venuesRe
receivableAccounts