Please refer to Table 4-6 for the following question.
Table 4-6
Financial Data for Springfield Power Co. as of December 31, 2010:
Inventory
$300,000
Long-term debt
500,000
Interest expense
25,000
Accumulated depreciation
450,000
Cash
280,000
Net sales (all credit)
1,800,000
Common stock
900,000
Accounts receivable
325,000
Operating expense (incl. depr. exp. and taxes)
625,000
Notes payable-current
200,000
Cost of goods sold
1,100,000
Plant and equipment
1,400,000
Accounts payable
180,000
Marketable securities
80,000
Accrued wages
45,000
Retained earnings
190,000
116) From the information presented in Table 4-6, calculate the following ratios for the
Springfield Power Co.
i. current ratio
ii. acid test ratio
iii. average collection period
iv. inventory turnover
v. gross profit margin
vi. operating profit margin
vii. net profit margin
viii. total asset turnover
35
Please refer to Table 4-7 for the following question.
Table 4-7
Hokie Corporation Comparative Balance Sheet
For the Years Ending December 31, 2009 and 2010
(Millions of Dollars)
Assets
2009
2010
Current Assets:
Cash
$2
$10
Accounts receivable
16
12
Inventory
22
26
Total current assets
$40
$48
Gross fixed assets:
$120
$124
Less accumulated depreciation
(60)
(64)
Net fixed assets
60
60
Total assets
$100
$108
Liabilities and owners’ equity:
Current liabilities:
Accounts payable
$16
$18
Notes payable
10
10
Total current liabilities
$26
$28
Long-term debt
20
18
Owners’ equity:
Common stock
40
40
Retained earnings
14
22
Total liabilities and owners’ equity
$100
$108
Hokie had net income of $28 million for 2010 and paid total cash dividends of $20 million to
their common stockholders.
117) Calculate the following 2010 financial ratios of Hokie Corporation using the information
given in Table 4-7:
i. current ratio
ii. acid test ratio
iii. debt ratio
iv. return on total assets
v. return on common equity
118) Certainty Corp. had total sales of $1,200,000 in 2010 (80 percent of its sales are credit). The
company’s gross profit margin is 25 percent, its ending inventory is $150,000, and its accounts
receivable balance is $90,000. What additional amount of cash could the firm have generated if it
had increased its inventory turnover ratio to 9.0 and reduced its average collection period to
28.21875 days?
37
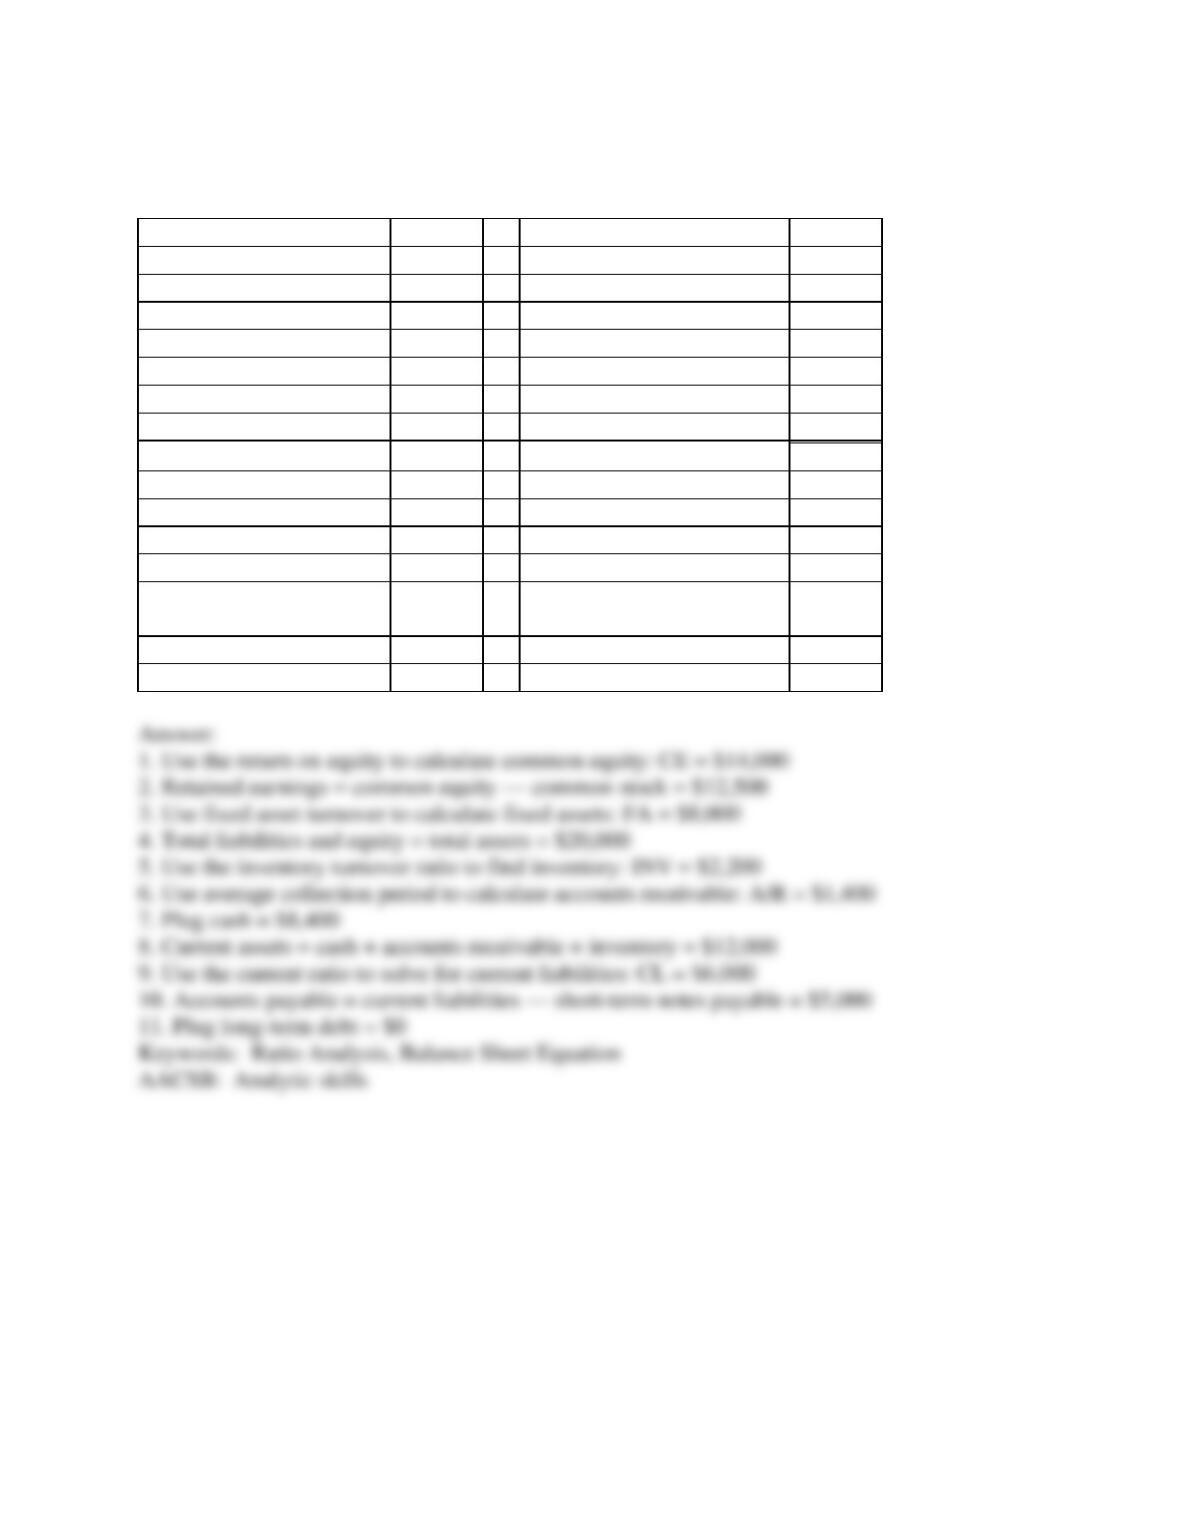
119) Complete the following balance sheet using the information given. Round account balances
to the nearest dollar.
Balance Sheet
Income Statement
Cash
Sales (All Credit)
$20,000
Accounts receivable
Cost of goods sold
10,000
Inventory
Operating expenses
6,000
Net fixed assets
Interest expense
100
Total assets
Taxes
1,365
Net income
$2,535
Accounts payable
Short-term notes payable
$1,425
Ratios:
Long-term debt
Profit Margin =
12.675%
Common stock
$5,000
Return on Equity =
15%
Retained earnings
Quick Ratio =
1.2
Total Liabilities and
equity
Return on Total Assets =
10%
Fixed Asset Turnover =
1.6
Current Ratio =
2
Days Sales Outstanding =
45
38
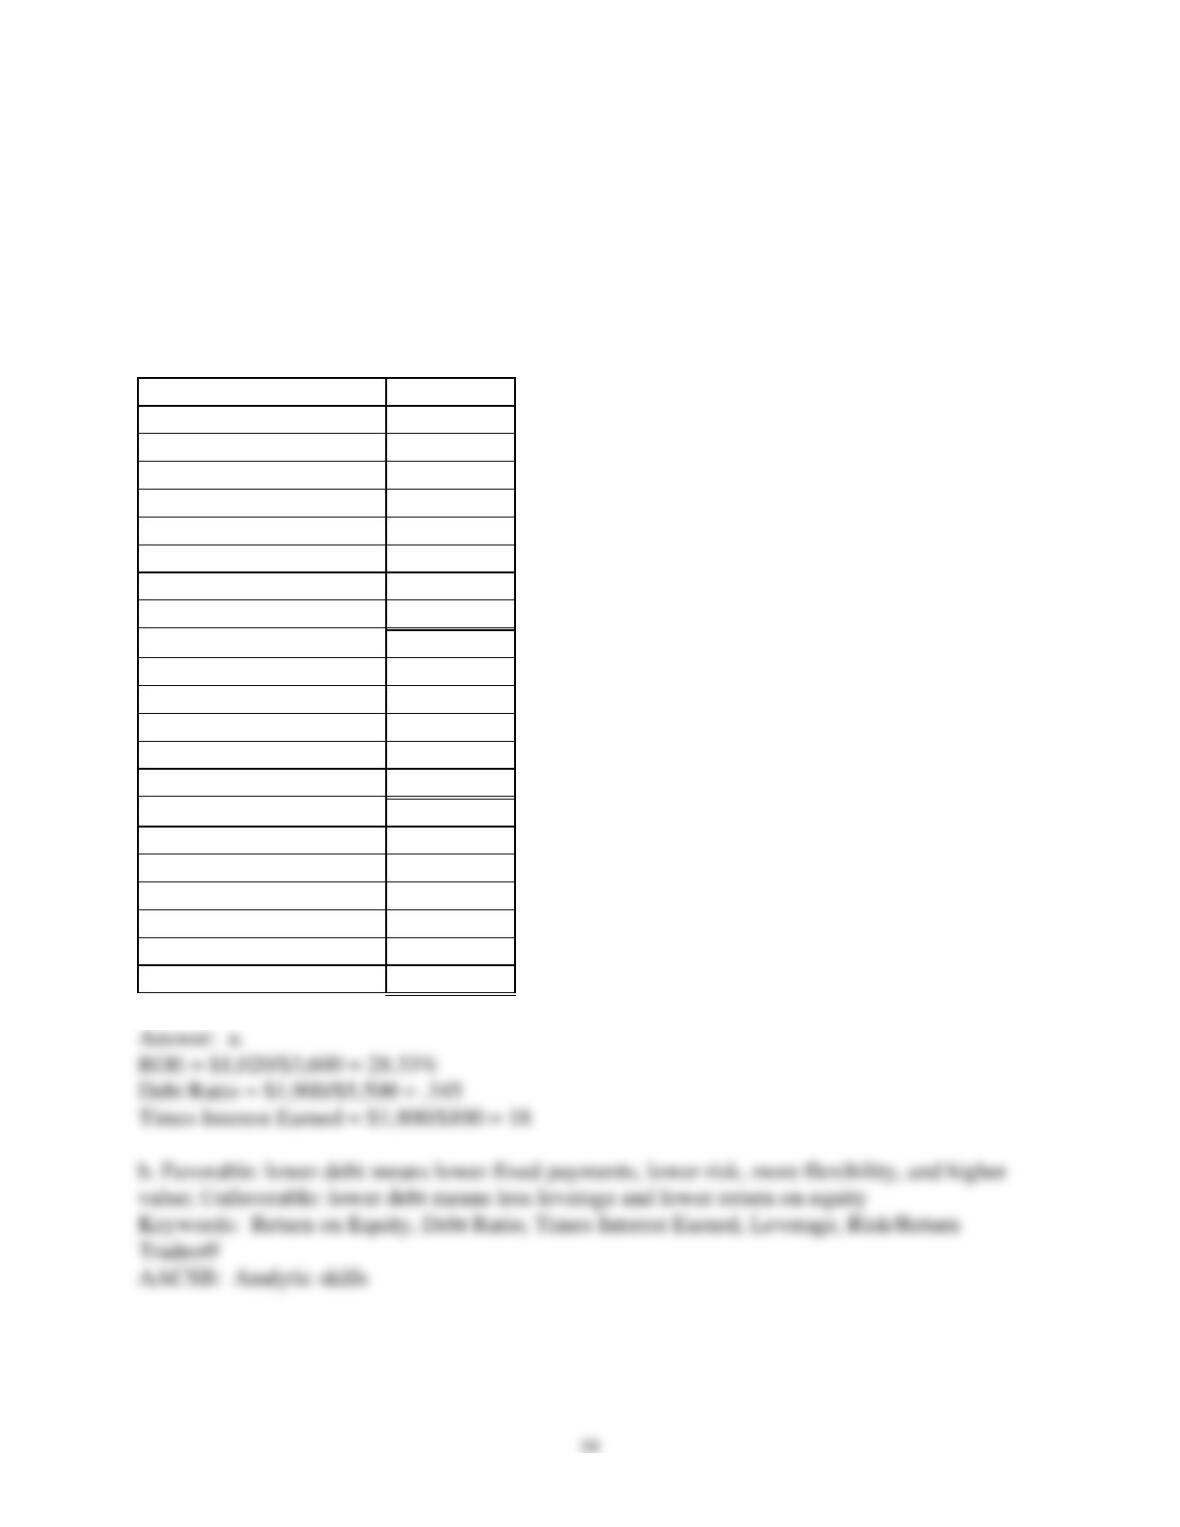
120) Complete the following balance sheet using the information given. Round account balances
to the nearest dollar.
Balance Sheet
Income Statement
Cash
Sales (All Credit)
$16,000
Accounts receivable
Cost of goods sold
11,000
Inventory
Operating expenses
1,000
Net fixed assets
Interest expense
200
Total assets
$20,000
Taxes
1,000
Net income
$2,800
Accounts payable
Short-term notes payable
$1,000
Ratios:
Long-term debt
Operating Profit Margin =
25%
Common stock
$1,500
Return on Equity =
20%
Retained earnings
Quick Ratio =
31.9375
Total Liabilities and
equity
Fixed Asset Turnover =
2
Current Ratio =
5
Days Sales Outstanding =
2
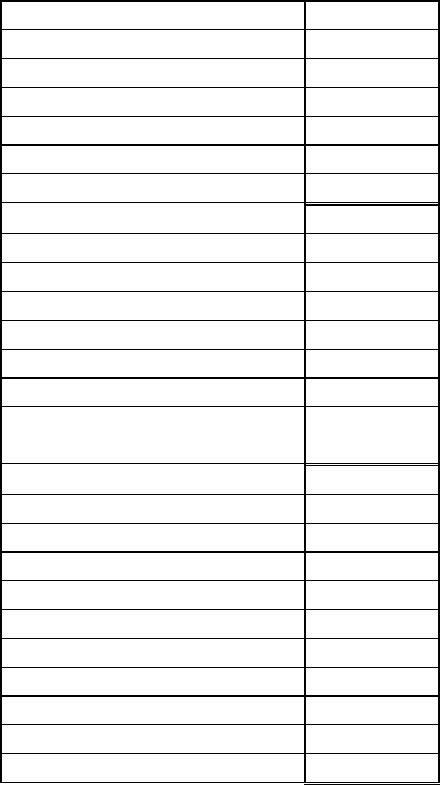
121) a. Using the financial statements for IUP Enterprises for 2010 (given below), calculate the
return on equity, the debt ratio, and the times interest earned ratio.
b. Suppose the industry average debt ratio is 50%. Give one reason why the debt ratio for IUP
Enterprises may be considered favorable, and give one reason why the debt ratio for IUP
Enterprises may be considered unfavorable.
IUP Enterprises
2010 Financial Statements
Income Statement ($)
Sales
10,000
Operating expenses
8,200
EBIT
1,800
Interest expense
100
EBT
1,700
Taxes (40%)
680
Net income
1,020
Balance Sheet ($)
Current assets
1,500
Fixed assets
4,000
Total assets
5,500
Accounts payable
900
Accruals
600
Long-term debt
400
Common stock
2,100
Retained earnings
1,500
Total liabilities & equity
5,500
40
122) The balance sheet and income statement for Becker, Becker & Becker is presented below.
Balance Sheet (000)
Cash
$500
Accounts receivable
1,500
Inventories
500
Current assets
2,500
Net fixed assets
5,000
Total Assets
7,500
Accounts payable
1,200
Bank note
300
Total current liabilities
1,500
Long term debt
4,000
Common stock
300
Retained earnings
1,700
Total liabilities and owners’
equity
$7,500
Income Statement (000)
Net sales
$8,500
Cost of goods sold
(3,400)
Gross profit
5,100
Operating expenses
(2,900)
Net operating income
2,200
Interest expense
(580)
Earnings before taxes
1,620
Income tax (34%)
(551)
Net income
$1,069
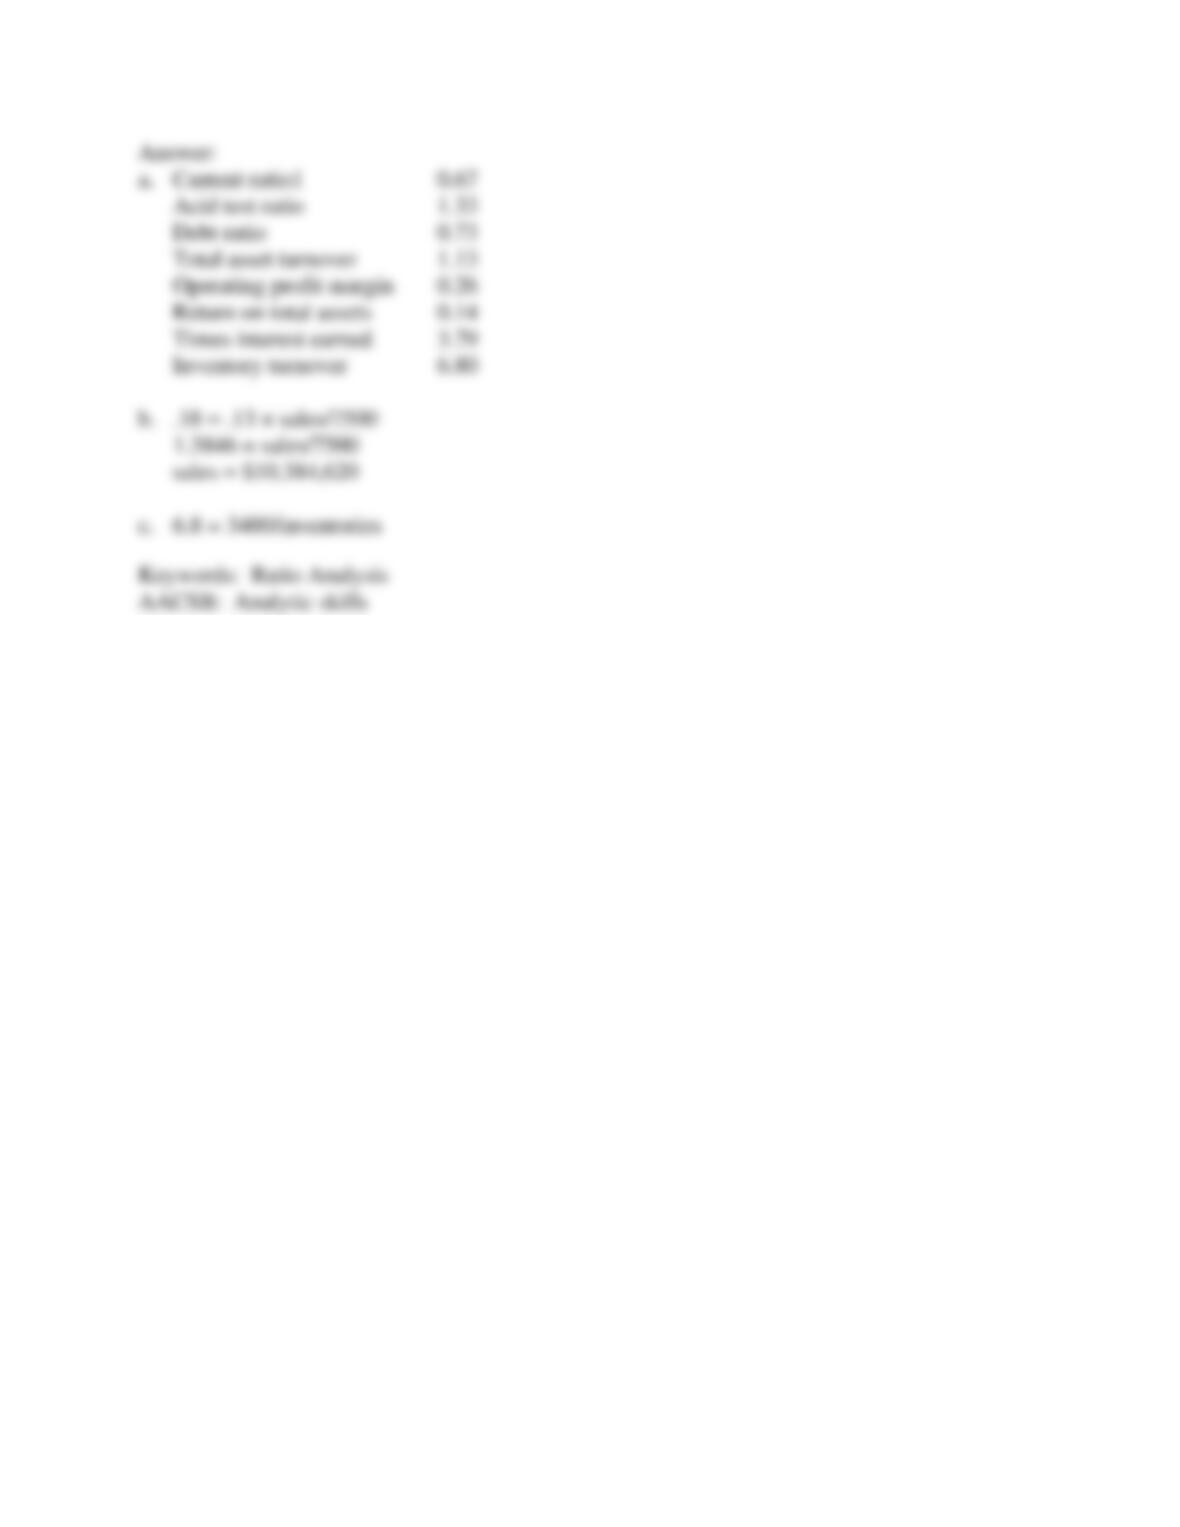
a. Compute the following ratios: Current ratio, Acid test ratio, Debt ratio, Total asset turnover,
Operating profit margin, Return on total investments, Times interest earned, Inventory turnover.
b. All other things equal, compute the dollar amount of sales needed to achieve an 18% return
on total assets for the coming year.
c. Given Becker’s inventory turnover ratio, find a way of computing the current level of
inventory given this ratio and assuming the current level of inventories is unknown. Set up but
do not solve.
41
123) How could an analyst determine whether a company’s ratio is good or bad?
Answer: Two common benchmarks provide comparisons for determining whether a ratio is
good or bad, relatively speaking. They are:
1. Comparing a firm’s ratios against its own ratios over time. This provides a means to determine
what trends might be present.
2. Comparing a firm against an industry average may provide a comparison of the firm’s ratios
against peer firms.
A firm’s ratios may also be compared to targets or goals stated by the firm’s management, such as
“we expect to increase or return on equity to 15% next year.”
Keywords: Ratio Analysis, Benchmarks, Trend Analysis
AACSB: Reflective thinking skills
4.3 Learning Objective 3
1) Financial ratios are used by personnel in marketing, human resources, and other groups within
a firm, not just by the finance and accounting personnel.
43
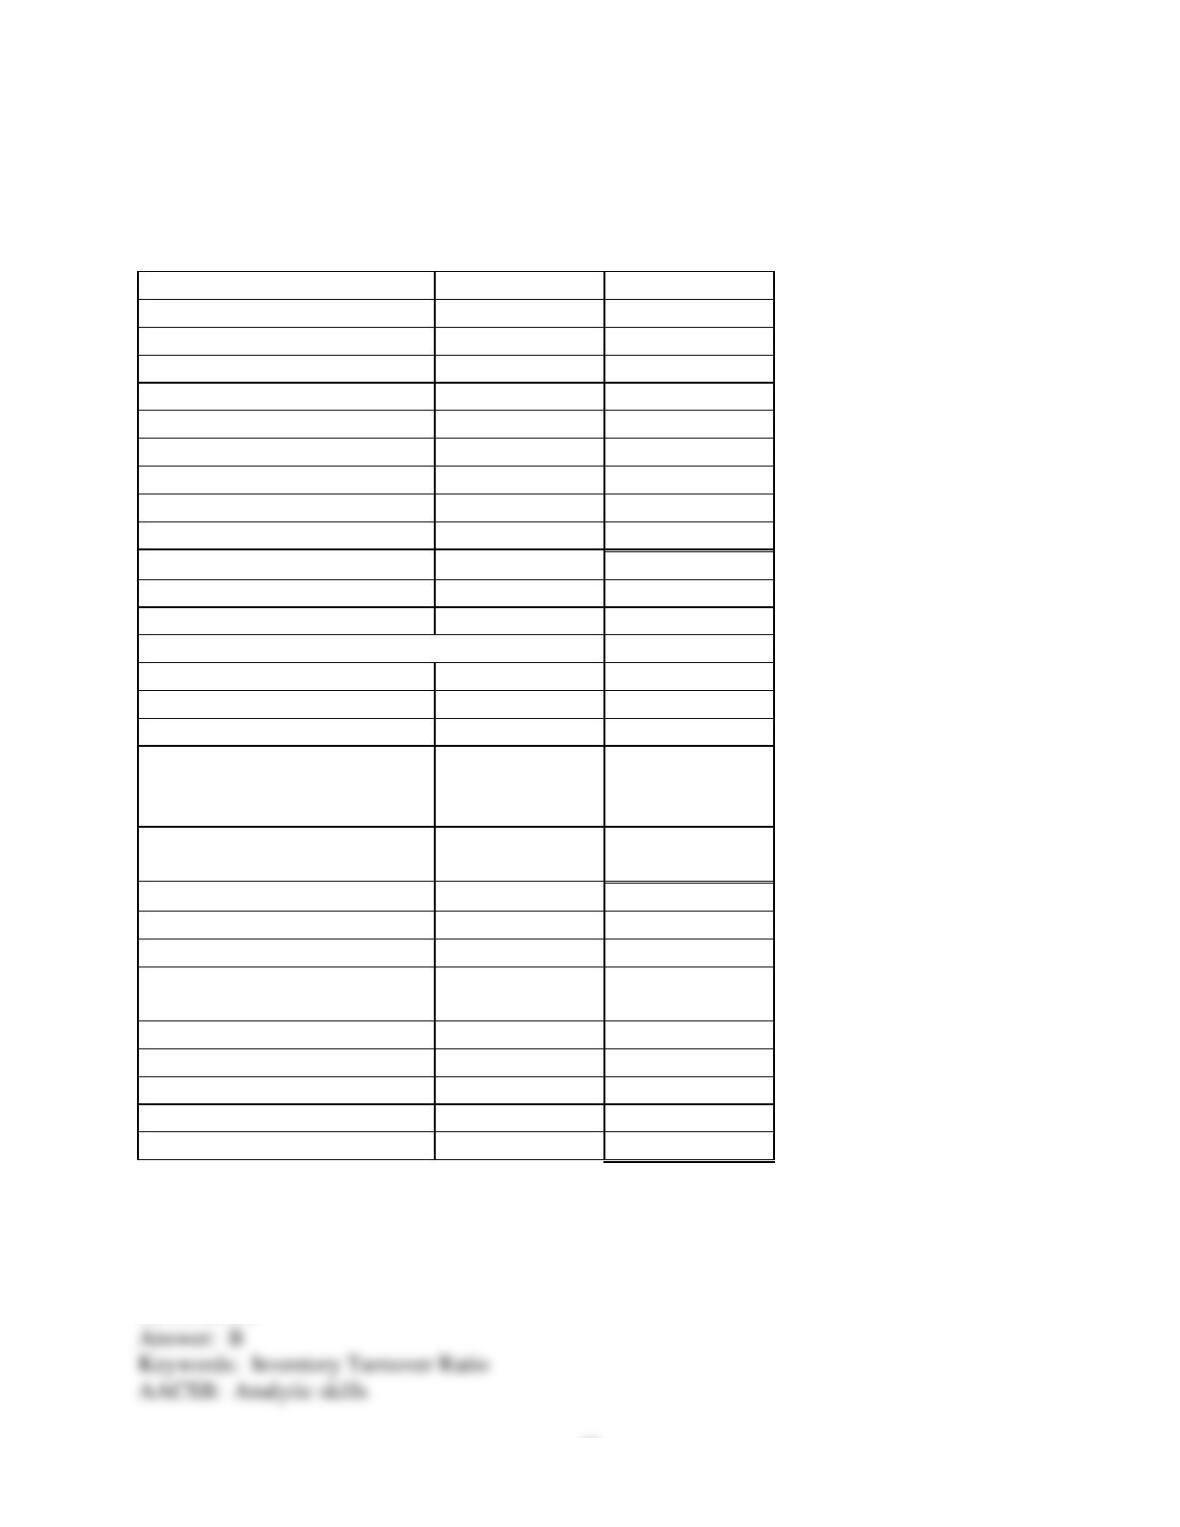
Please refer to Table 4-1 for the following questions.
Table 4-1
Stewart Company
Balance Sheet
Assets:
Cash and marketable securities
$600,000
Accounts receivable
900,000
Inventories
1,500,000
Prepaid expenses
75,000
Total current assets
$3,075,000
Fixed assets
8,000,000
Less: accum. depr.
(2,075,000)
Net fixed assets
$5,925,000
Total assets
$9,000,000
Liabilities:
Accounts payable
$800,000
Notes payable
700,000
Accrued taxes
50,000
Total current liabilities
$1,550,000
Long-term debt
2,500,000
Owner’s equity (1 million
shares of common stock
outstanding)
4,950,000
Total liabilities and owner’s
equity
$9,000,000
Net sales (all credit)
$10,000,000
Less: Cost of goods sold
(3,000,000)
Selling and administrative
expense
(2,000,000)
Depreciation expense
(250,000)
Interest expense
(200,000)
Earnings before taxes
4,550,000
Income taxes
(1,820,000)
Net income
$2,730,000
5) Based on the information in Table 4-1, the inventory turnover ratio is
A) 1.3 times.
B) 2.0 times.
C) 2.5 times.
D) 2.9 times.
44
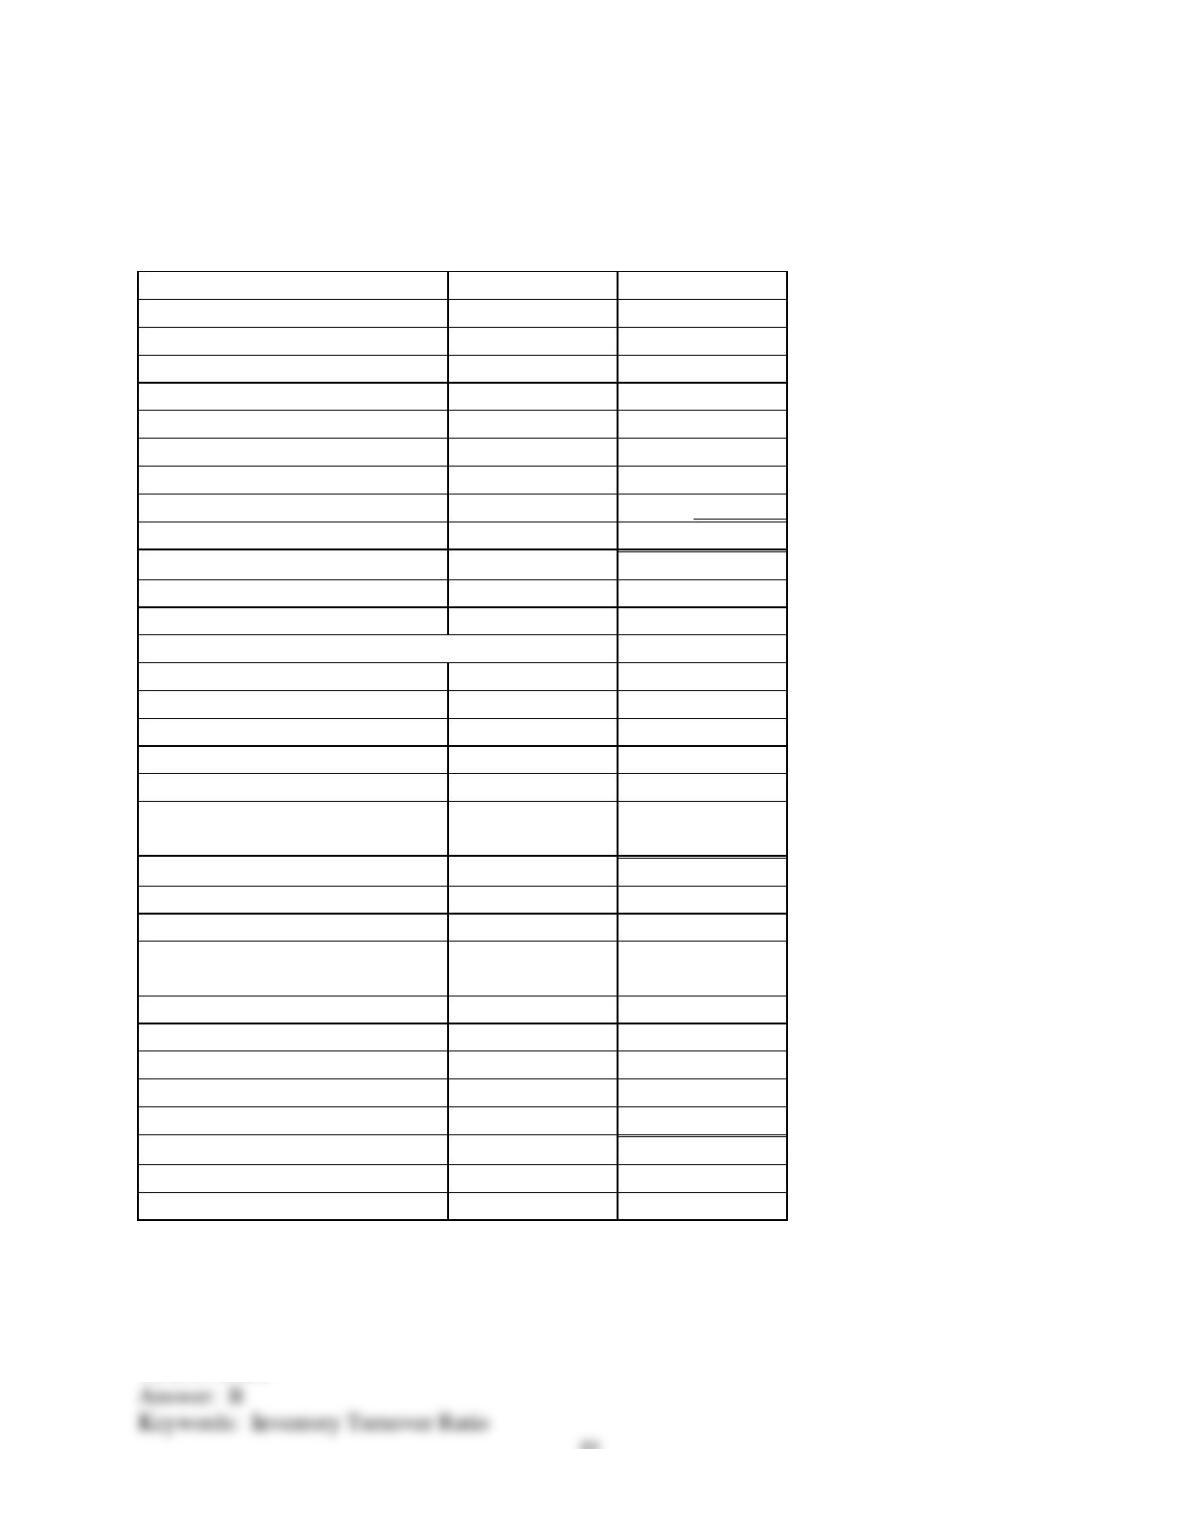
Please refer to Table 4-2 for the following questions.
Table 4-2
Drummond Company
Balance Sheet
Assets:
Cash and marketable securities
$400,000
Accounts receivable
1,415,000
Inventories
1,847,500
Prepaid expenses
24,000
Total current assets
3,686,500
Fixed assets
2,800,000
Less: accum. depr.
(1,087,500)
Net fixed assets
1,712,500
Total assets
$5,399,000
Liabilities:
Accounts payable
$600,000
Notes payable
875,000
Accrued taxes
92,000
Total current liabilities
$1,567,000
Long-term debt
900,000
Common Stock (100,000 shares)
700,000
Retained Earnings
2,232,000
Total liabilities and owner’s
equity
$5,399,000
Net sales (all credit)
$6,375,000
Less: Cost of goods sold
(4,375,000)
Selling and administrative
expense
(1,000,000)
Depreciation expense
(135,000)
Interest expense
(100,000)
Earnings before taxes
$765,000
Income taxes
(306,000)
Net income
$459,000
6) Based on the information in Table 4-2, the inventory turnover ratio is
A) 1.29 times.
B) 2.37 times.
C) 4.43 times.
D) 2.99 times.
45
7) Discuss five limitations to ratio analysis.