3-1
Chapter 3
Answers to Review Problems
Finance For Executives – 4th Edition
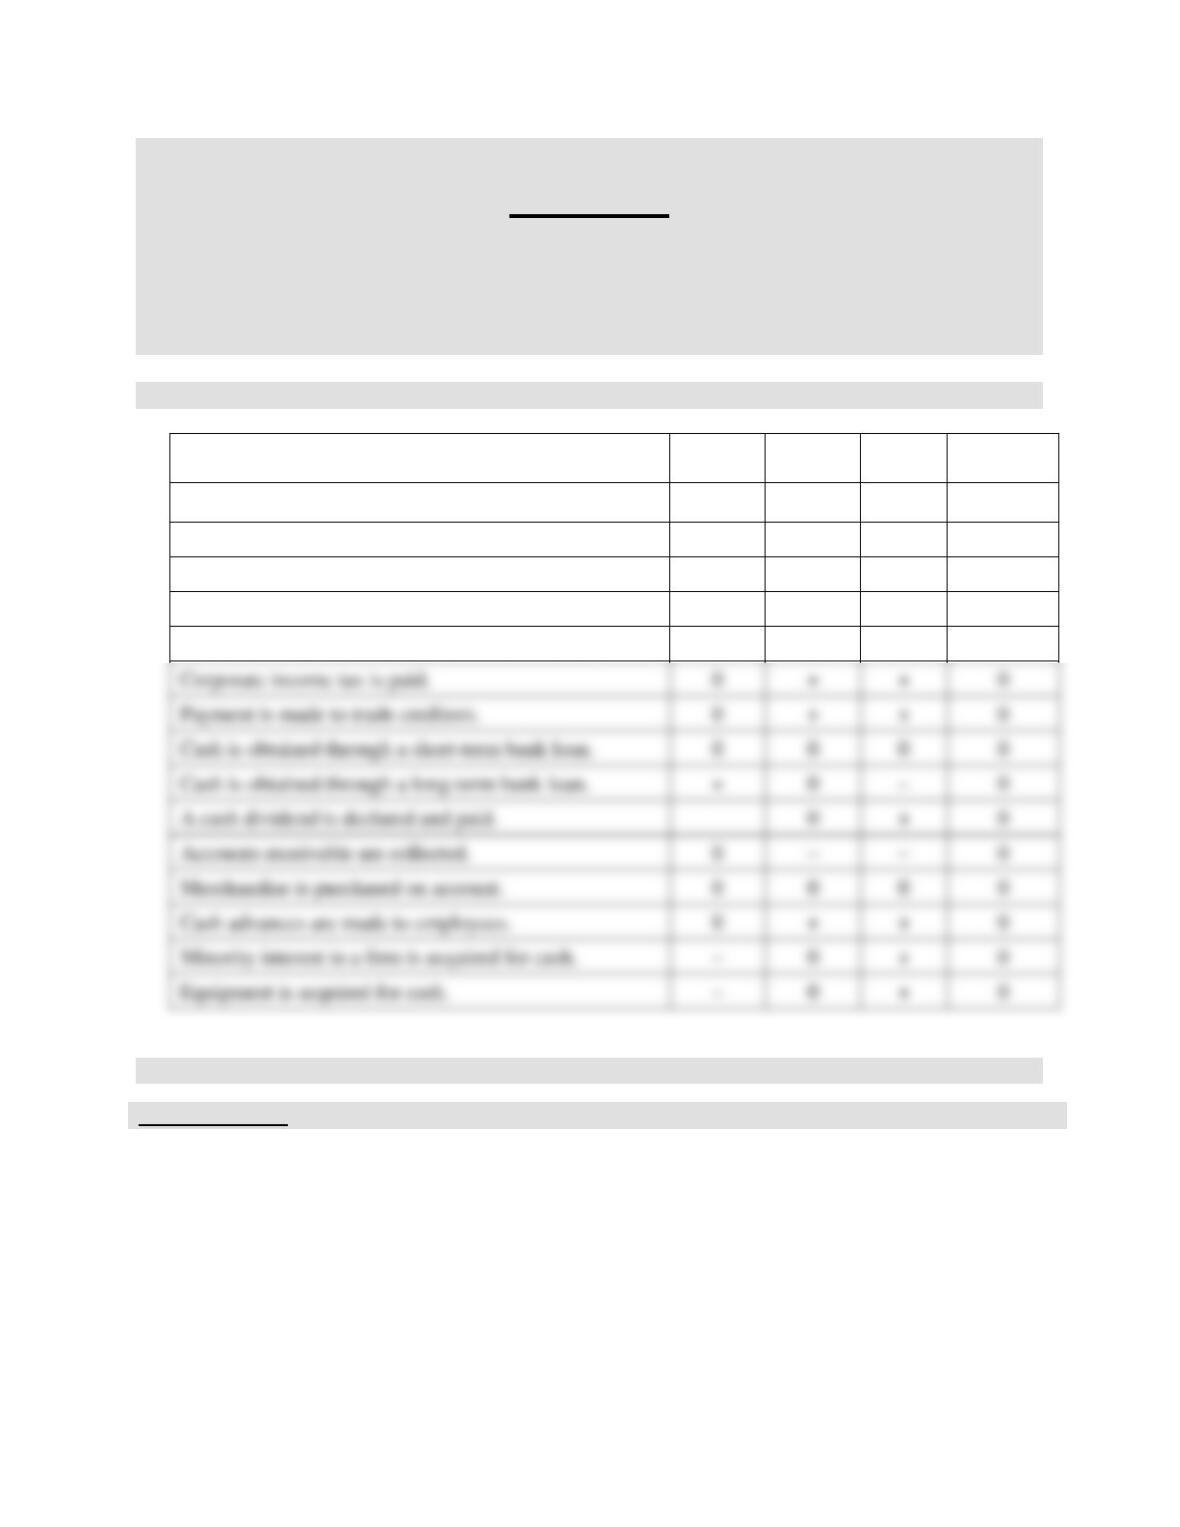
1. Transactions.
NLF
WCR
NSF
NET
PROFIT
Shares are issued for cash.
+
0
–
0
Goods for inventory are sold for cash.
+
–
–
+
Goods from inventory are sold on account.
+
+
0
+
A fixed asset is sold for cash for less than book value.
+
0
–
–
A fixed asset is sold for cash for more than book value.
+
0
–
+
2. Constructing a managerial balance sheet.
Invested Capital
In millions
Cash
$661
Cash and cash equivalents + Short-term investment
Working Capital Requirement
1,589
Merchandise inventories
+ Deferred income taxes
+ Other current assets
– Accounts payable
– Accrued compensation and employees benefits
– Self-insurance liabilities – Deferred revenue
– Other current liabilities
Corporate income tax is paid.
0
+
Payment is made to trade creditors.
0
+
Cash is obtained through a short-term bank loan.
0
0
0
Cash is obtained through a long-term bank loan.
+
0
–
A cash dividend is declared and paid.
–
0
Accounts receivable are collected.
0
–
–
Merchandise is purchased on account.
0
0
0
Cash advances are made to employees.
0
+
Minority interest in a firm is acquired for cash.
–
0
Equipment is acquired for cash.
–
0
3-2
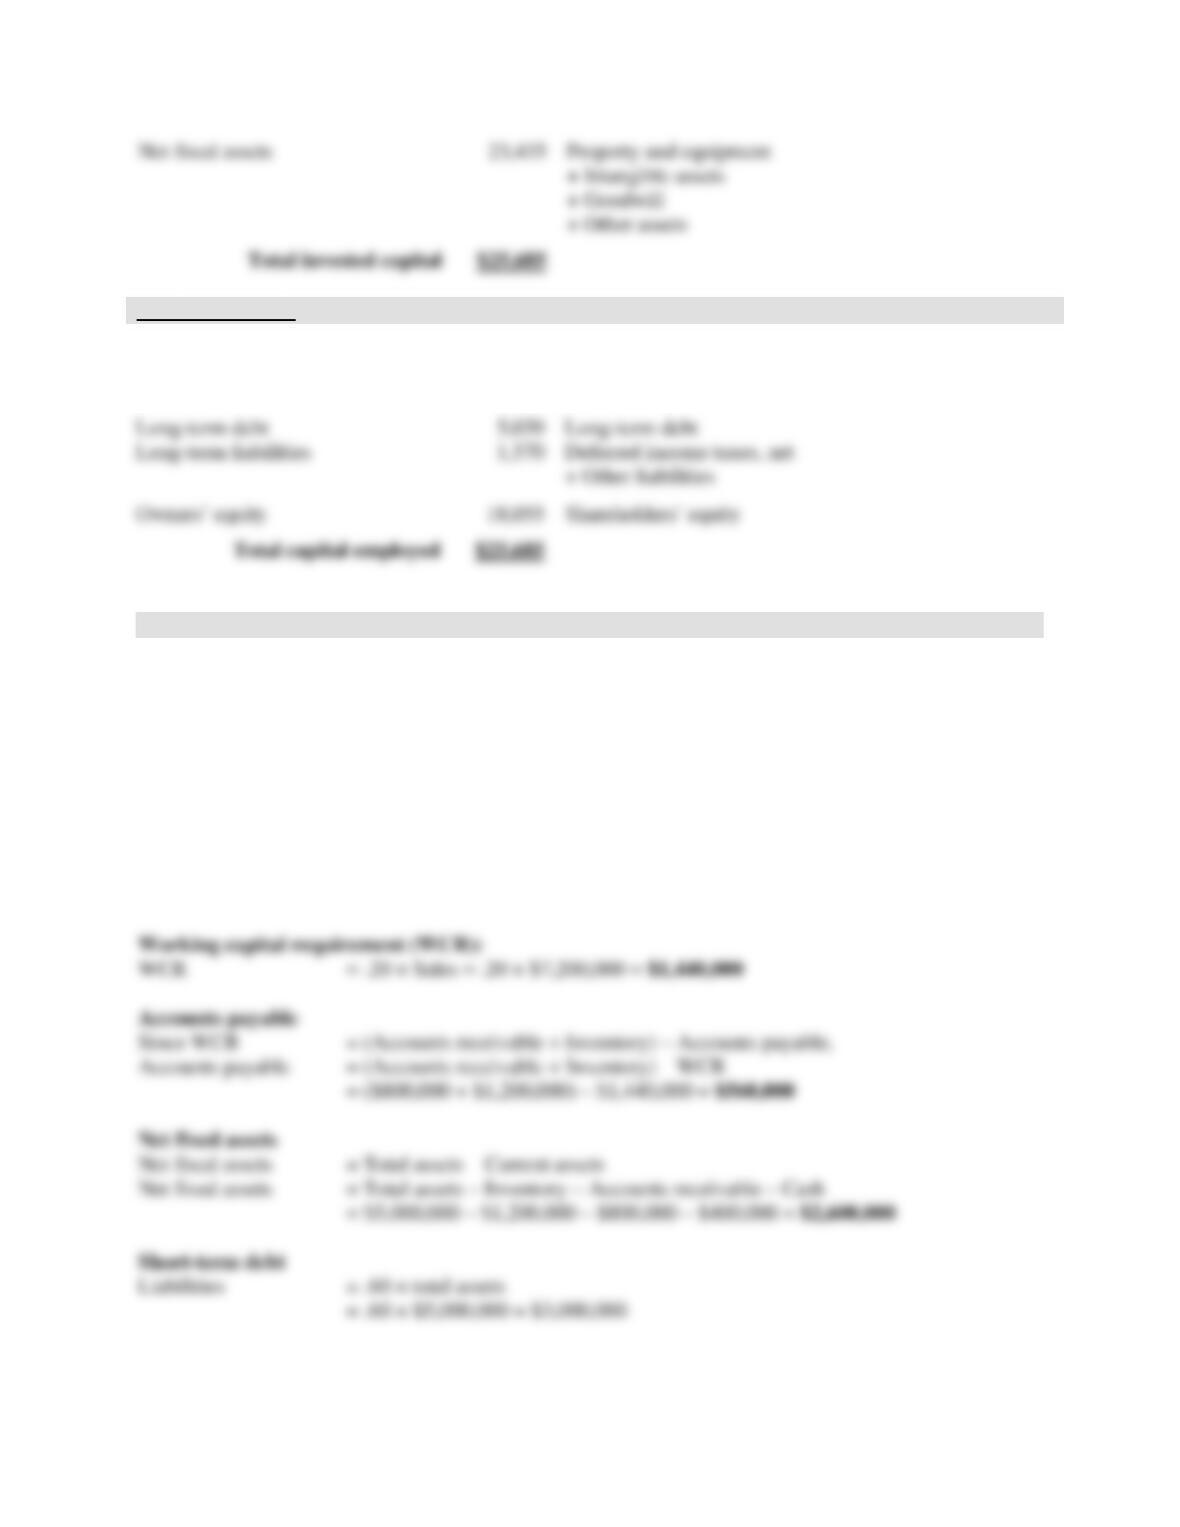
3. Reconstructing a balance sheet.
Sales
20 days of sales = $400,000
360 days of sales = ($400,000/20) × 360 = $7,200,000
Accounts receivable
40 days of sales = ($7,200,000/360) × 40 = $800,000
Inventory
Inventory = Sales/6
= $7,200,000/6 = $1,200,000
Capital employed
In millions
Short-term debt
$1,021
Short-term borrowing
+ Current portion of long-term debt
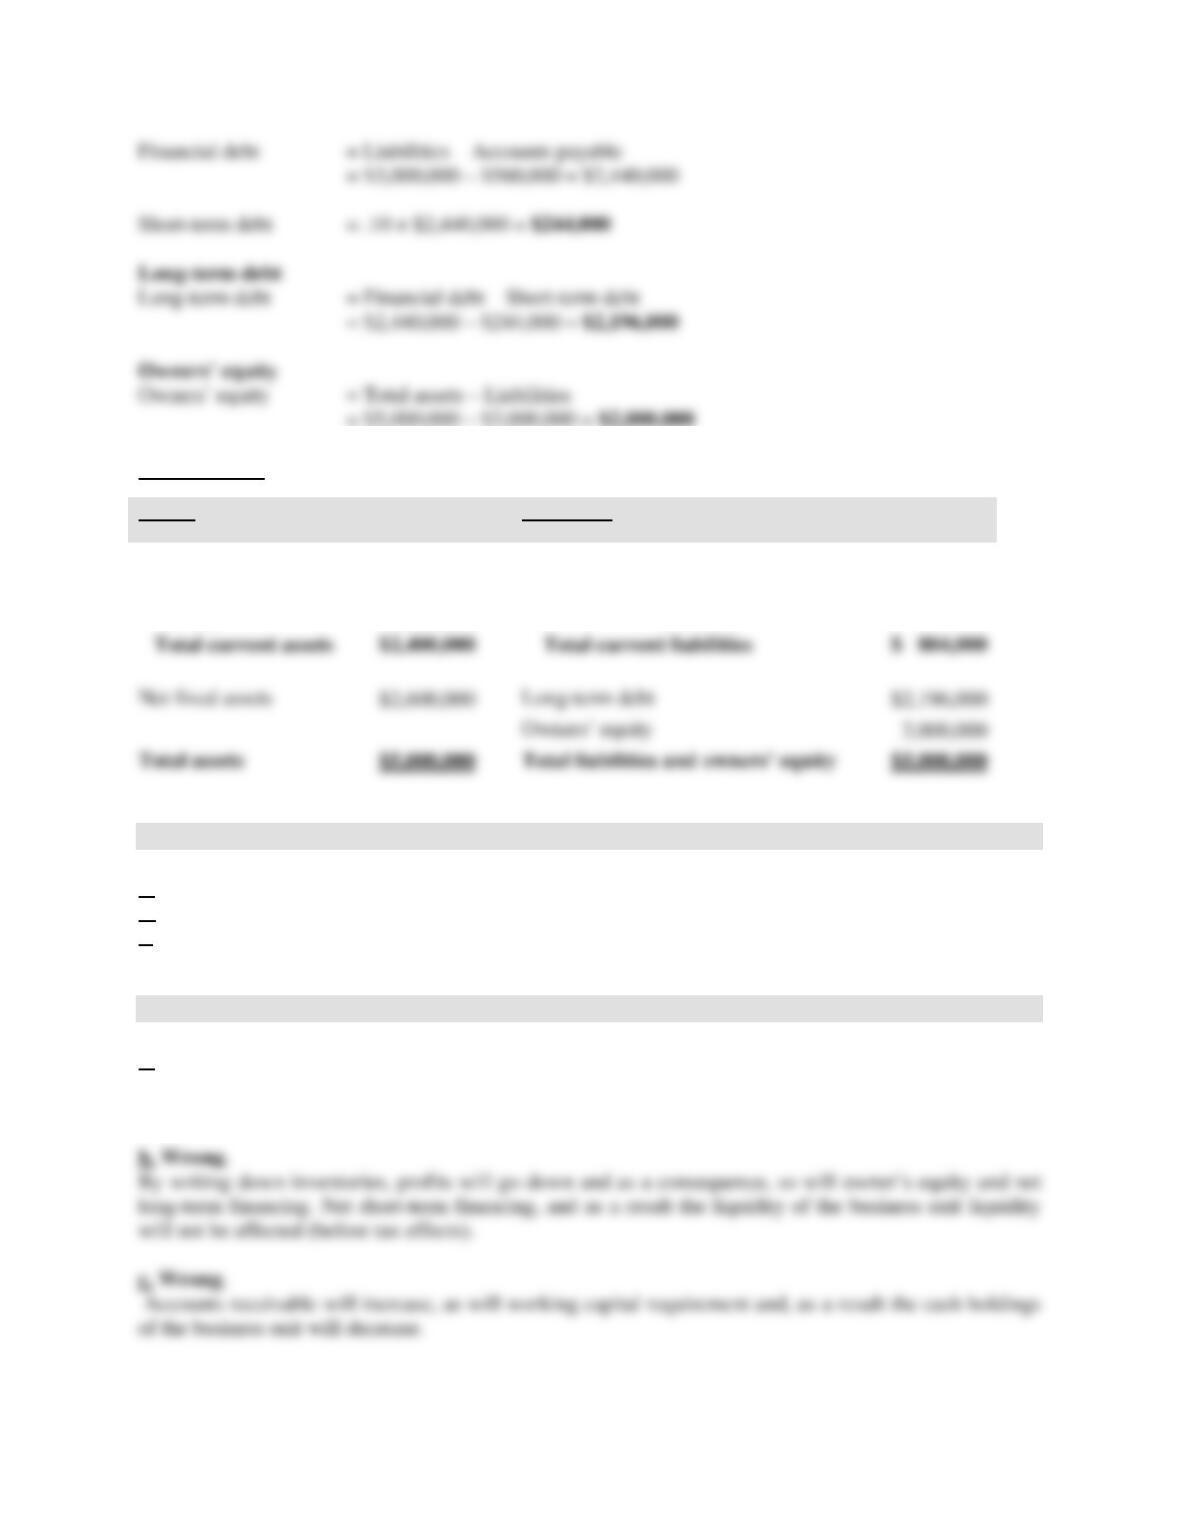
3-3
Balance Sheet
4. Effect of transactions on working capital requirement.
a. Decrease
b. Decrease
c. Increase
5. Managing liquidity.
a. Wrong.
From where would the cash come from to repurchase shares or reimburse short-term debt?
The relationship is a tautology. As such, it cannot be used for causality relations.
Assets
Liabilities
Cash
$ 400,000
Short-term debt
$ 244,000
Accounts receivable
800,000
Accounts payable
560,000
Inventory
1,200,000
3-4
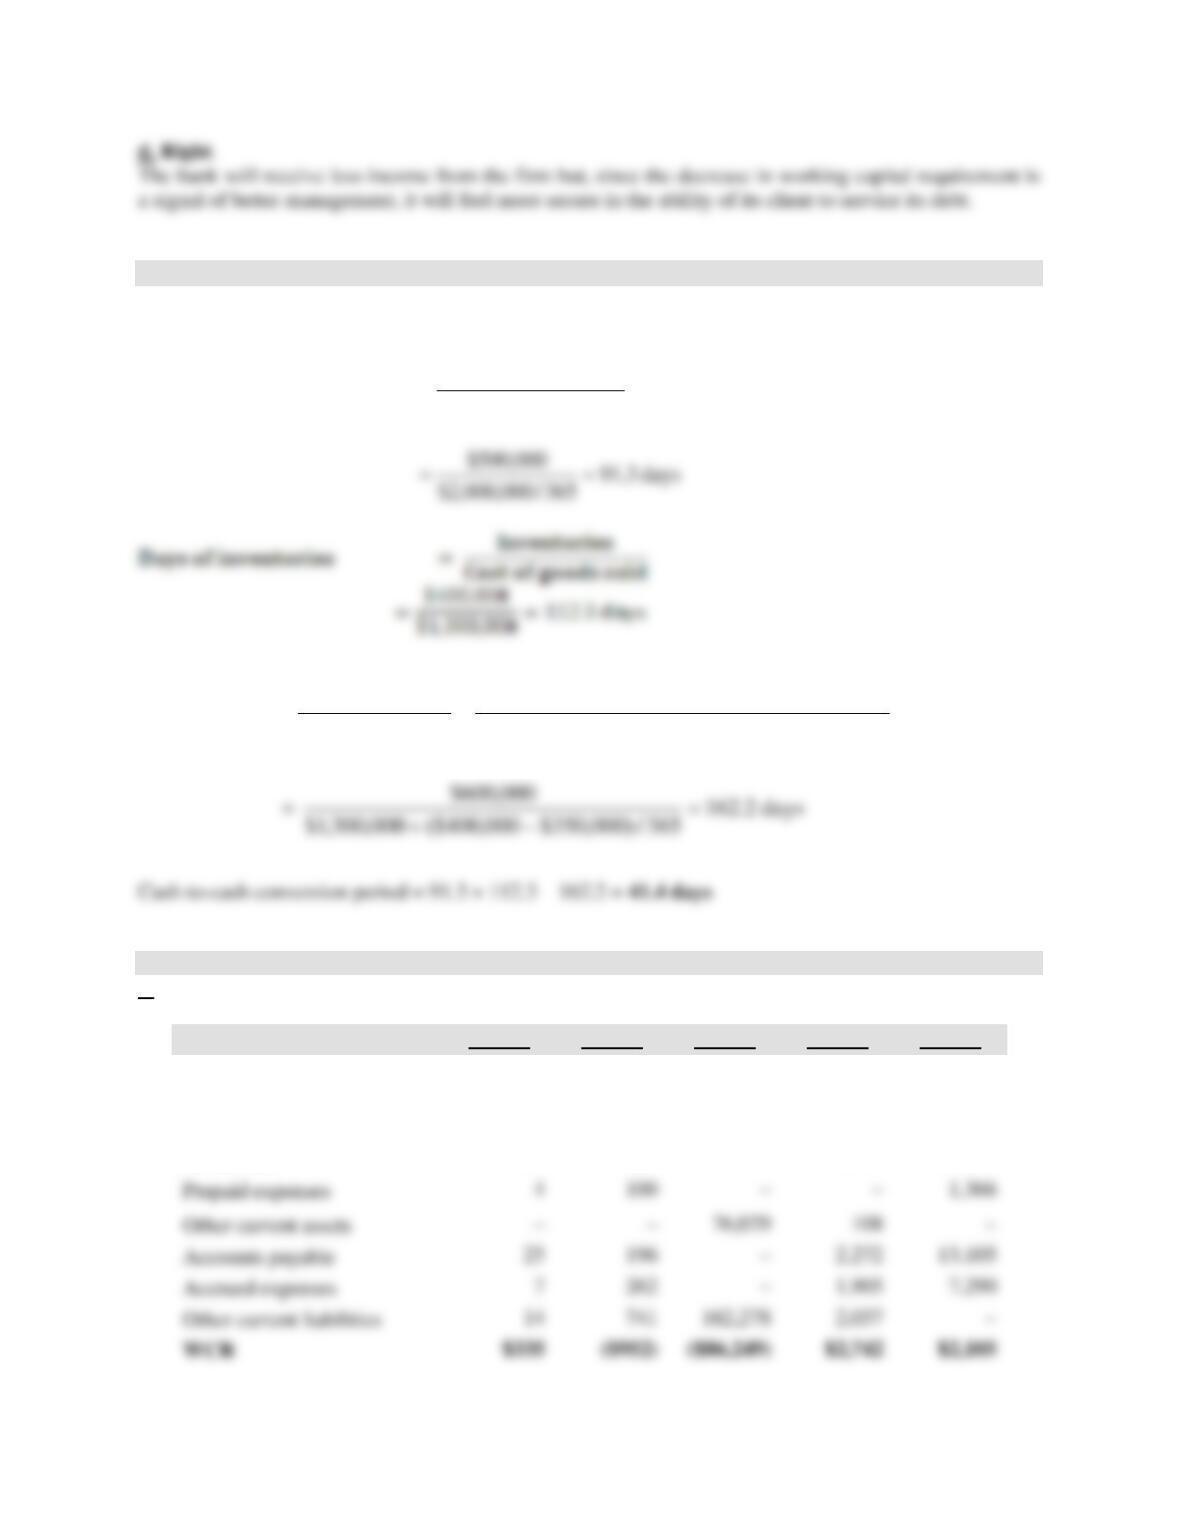
6. The cash-to-cash conversion period.
Cash-to-cash conversion period = Inventory period + Collection period – Payment period
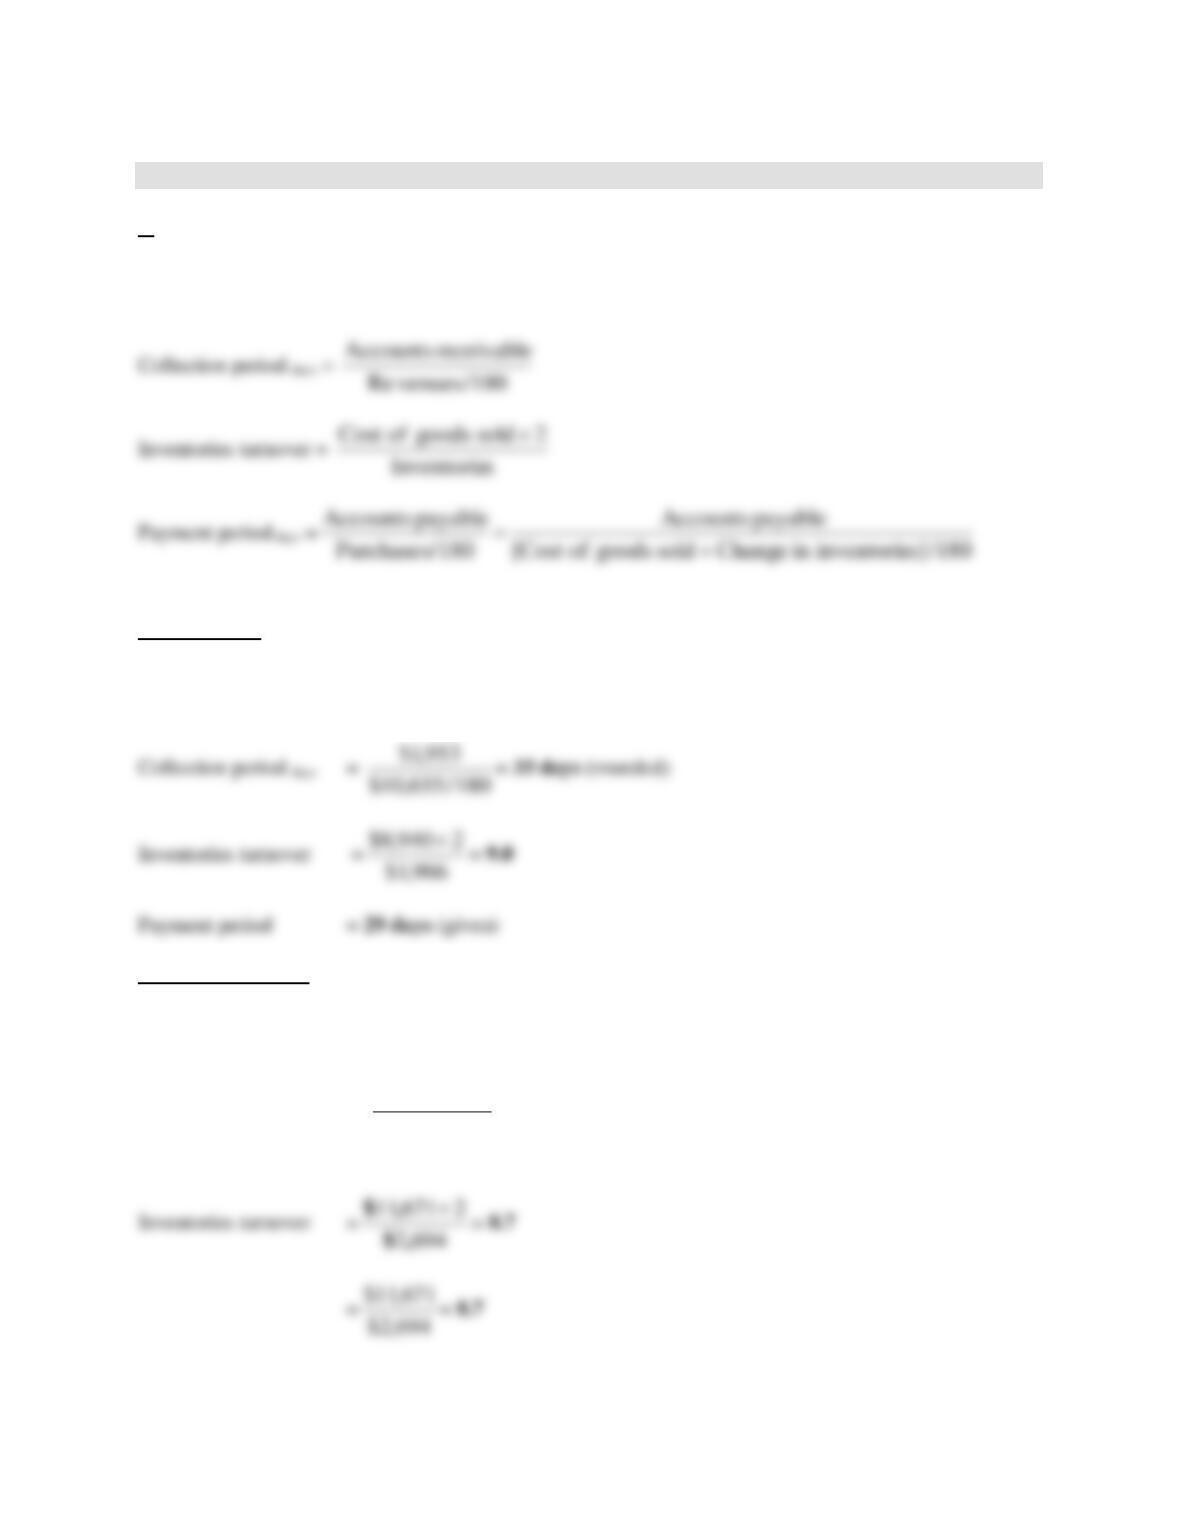
Collection period =
365/sales Net
receivableAccounts
Payment period =
s)/365inventoriein Change sold goods of Cost(
payableAccounts
365/Purchases
payableAccounts
+
=
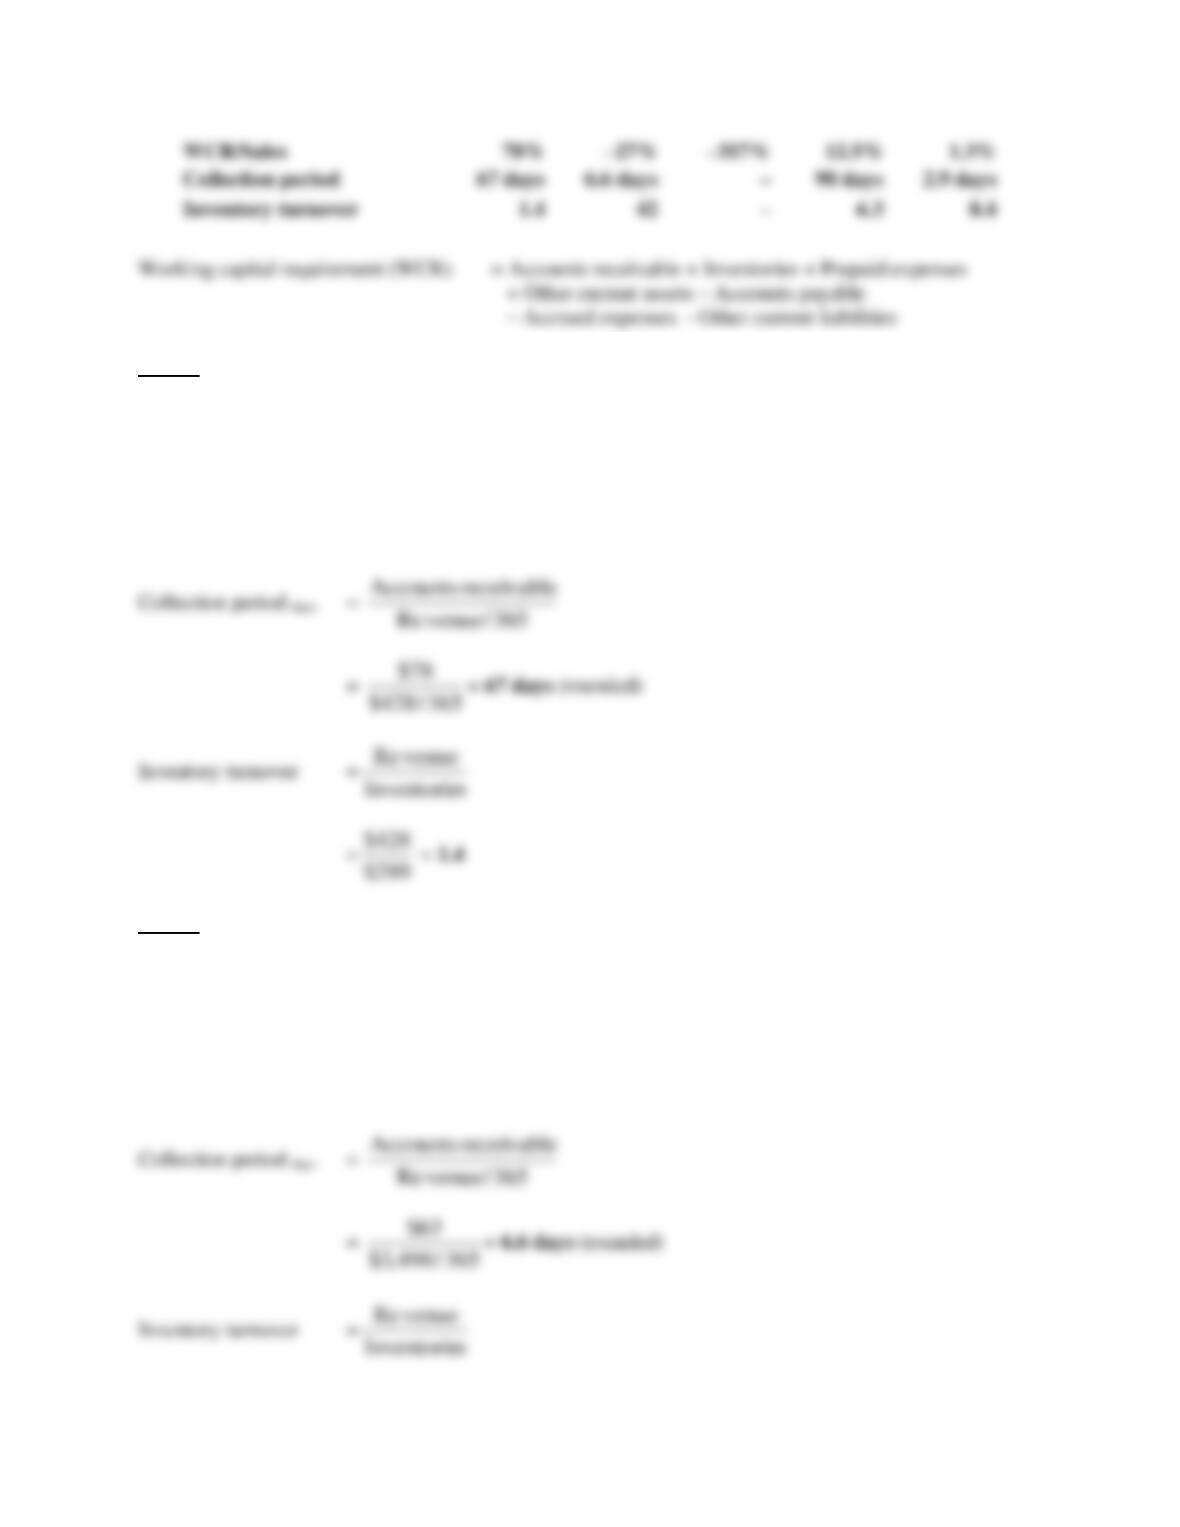
7. Industry effect on the working capital requirement.
a.
in millions
Firm 1
Firm 2
Firm 3
Firm 4
Firm 5
Revenue
$428
$3,498
$27,235
$21,870
$166,809
Accounts Receivable
78
63
–
5,385
1,341
Inventories
299
84
–
3,463
19,793
100
–
1,366
3-5
Firm 1
WCR = $78 + $299 + $4 + $0 – $25 – $7 – $14 = $335
Working capital requirement-to-revenue ratio
= $335/$428 = .78
Firm 2
WCR = $63 + $84 + $100 + $0 – $196 – $262 – $741 = ($952)
Working capital requirement-to-revenue ratio
= ($952)/$3,498 = (.27)
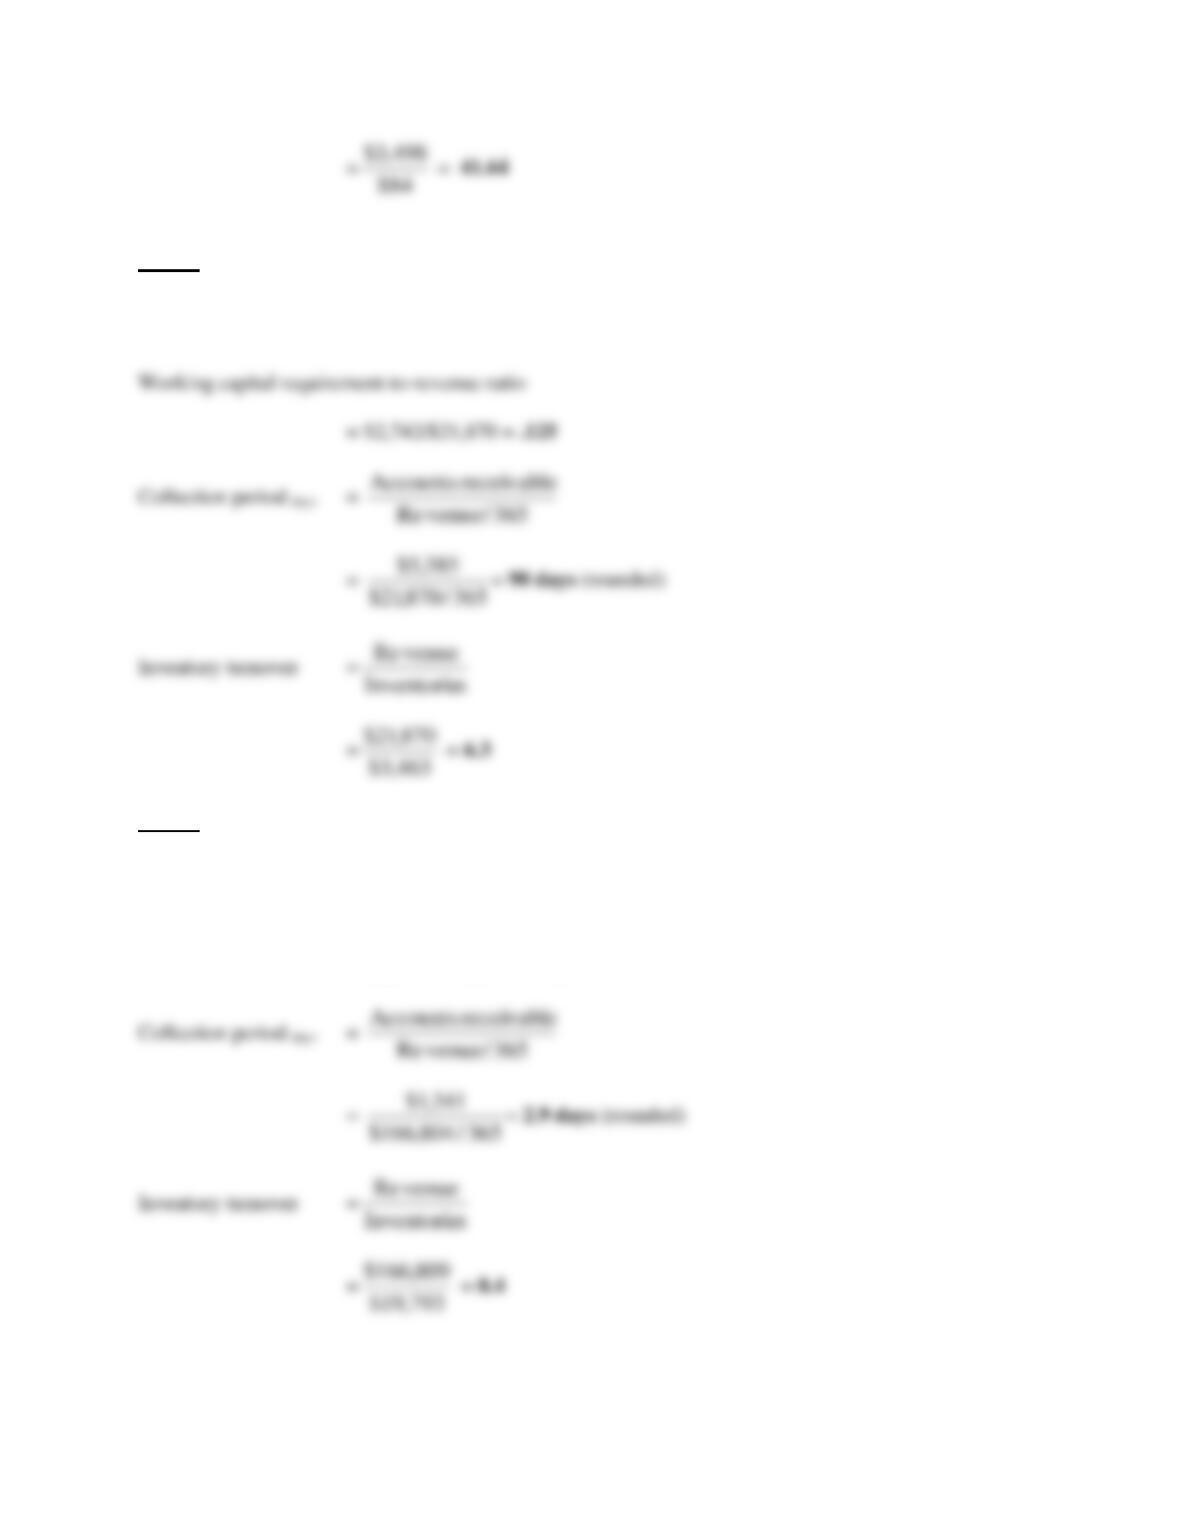
3-6
Firm 3
WCR = $5,385 + $3,463 + $0 + $108 – $2,272 – $1,905 – $2,037 = $2,742
Firm 4
WCR = $1,341 + $19,793 + $1,366 + $0 – $13,105 – $7,290 – $0 = $2,105
Working capital requirement-to-revenue ratio
= $2,105/$166,809 = .0126
3-7
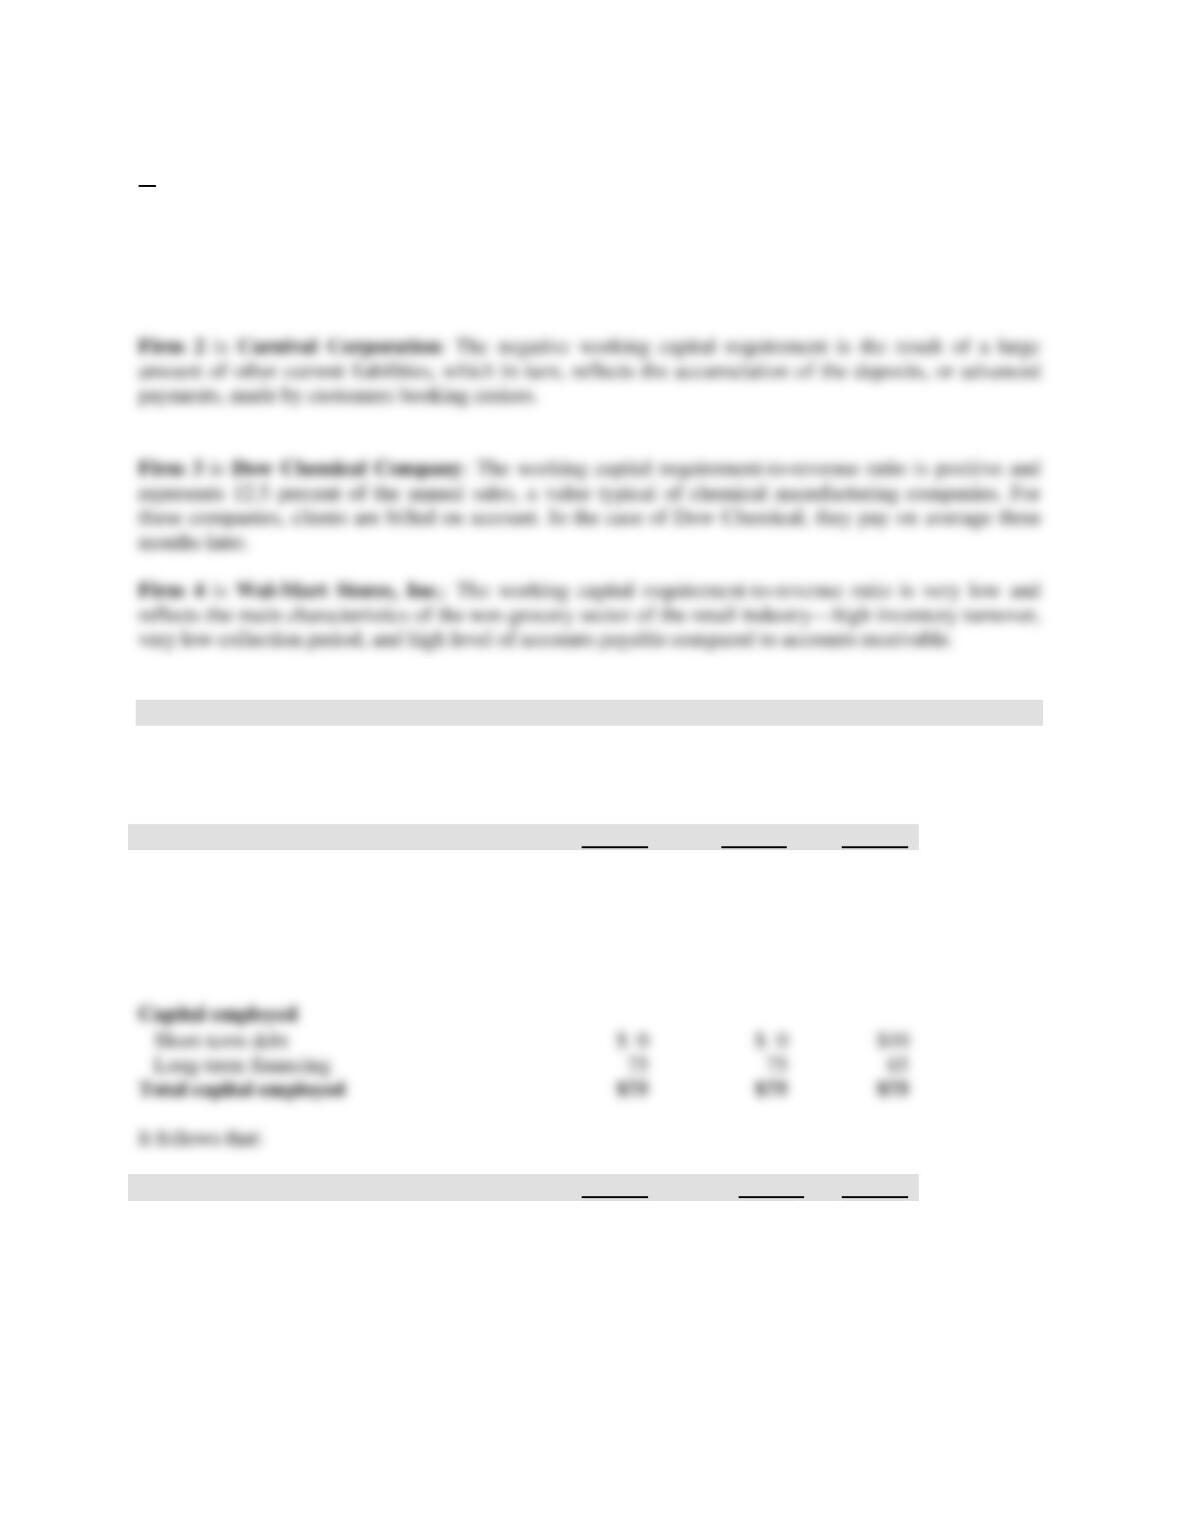
b.
Firm 1 is The Robert Mondavi Corporation: Inventory turnover is low, reflecting aging wine. The
amount of accounts payable is low reflecting a low level of purchases, which is not surprising since most
of the raw material needed to grow grapes (air, sun, and rain) is free. As a result, working capital
requirement is high relative to sales (78 cents out of one dollar of sales is locked in the firm’s operating
cycle).
8. Financing strategies.
The managerial balance sheet of the three firms can be directly constructed from the data with
Working capital requirement = Accounts receivable + Inventories – Accounts payable:
Firm A
Firm B
Firm C
Invested capital
Cash
$ 0
$10
$ 0
Working capital requirement
25
15
25
Net fixed assets
50
50
50
Total invested capital
$75
$75
$75
Capital employed
Short-term debt
$ 0
Long-term financing
75
75
65
Total capital employed
$75
$75
$75
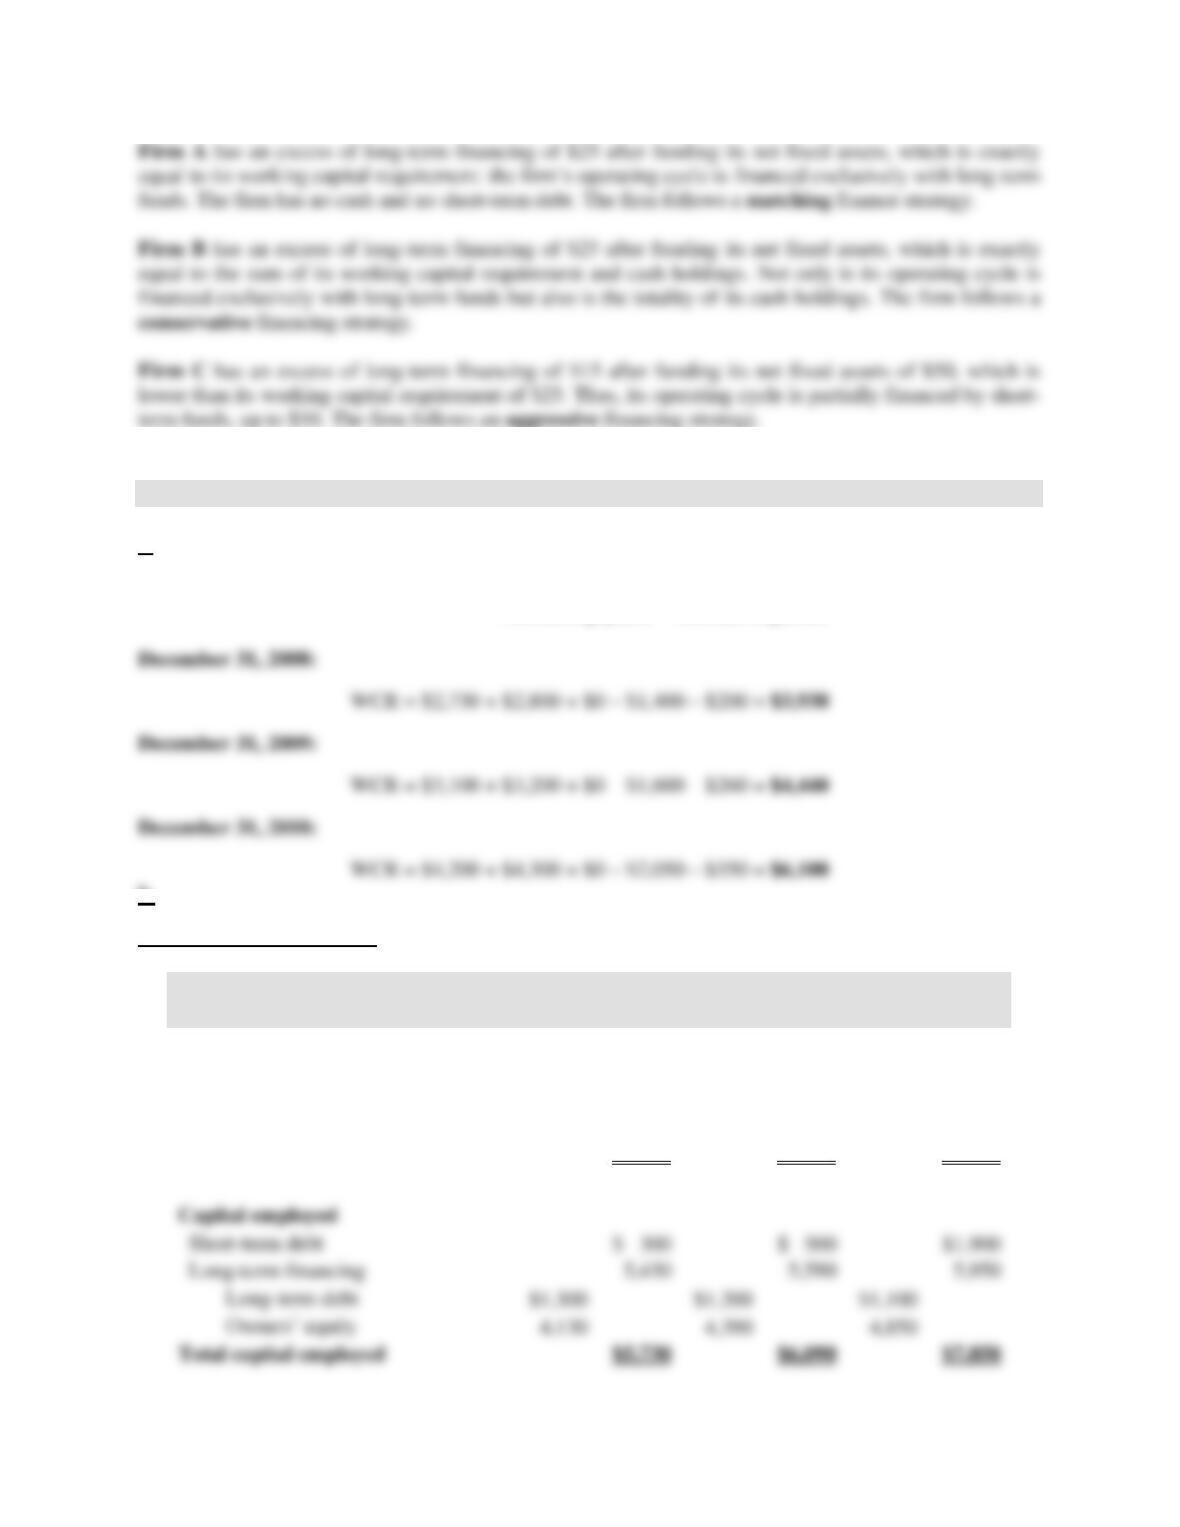
Firm A
Firm B
Firm C
Net long-term financing
[Long-term financing – Net fixed assets]
$25
$ 25
$15
Net short-term financing
[Short-term debt – Cash]
0
(10)
10
3-8
9. The financial effect of the management of the operating cycle.
a.
Working capital requirement (WCR) = Accounts receivable + Inventories + Prepaid expenses
– Accounts payable – Accrued expenses
b.
Managerial balance sheets
in thousands
December 31,
2008
December 31,
2009
December 31,
2010
Invested capital
Cash
$ 600
$ 350
$ 300
Working capital requirement (WCR)
3,930
4,440
6,100
Net fixed assets
1,200
1,300
1,450
Total invested capital
$5,730
$6,090
$7,850
Capital employed
Short-term debt
$ 300
$ 500
Long-term financing
Long-term debt
Total capital employed
$5,730
$6,090
$7,850
3-9
c.
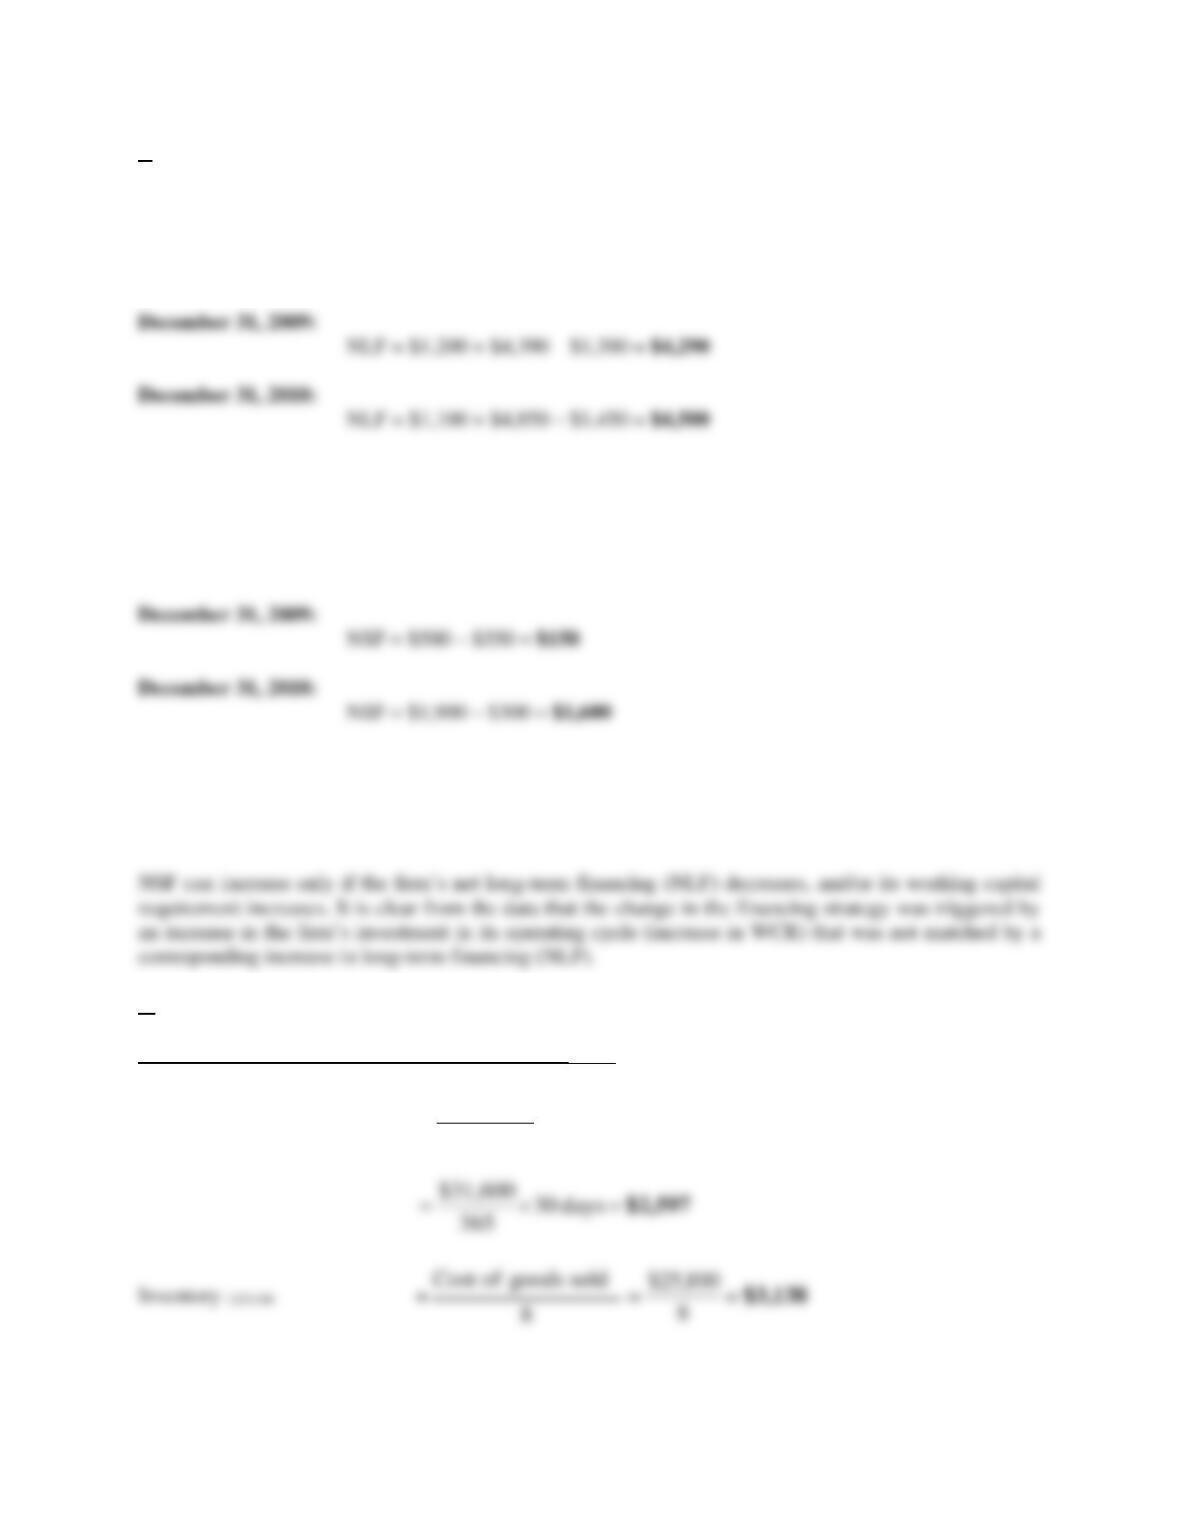
Net long-term financing (NLF) = Long-term debt + Owners’ equity – Net fixed assets
December 31, 2008: NLF = $1,300 + $4,130 – $1,200 = $4,230
Net short-term financing (NSF) = Short-term debt – Cash
December 31, 2008: NSF = $300 – $600 = ($300)
Note that net short-term financing (NSF) went up drastically from December 31, 2008, to December 31,
2010. In the third year, the firm’s financing strategy changed from a matching one to a very aggressive
one. During that year, each extra dollar invested in the operating cycle which was not financed either by
retained earnings or long-term debt was funded by short-term debt
d.
Pro forma working capital requirement (WCR)12/31/10
Accounts receivable12/31/10 =
days30
365
salesNet
3-10
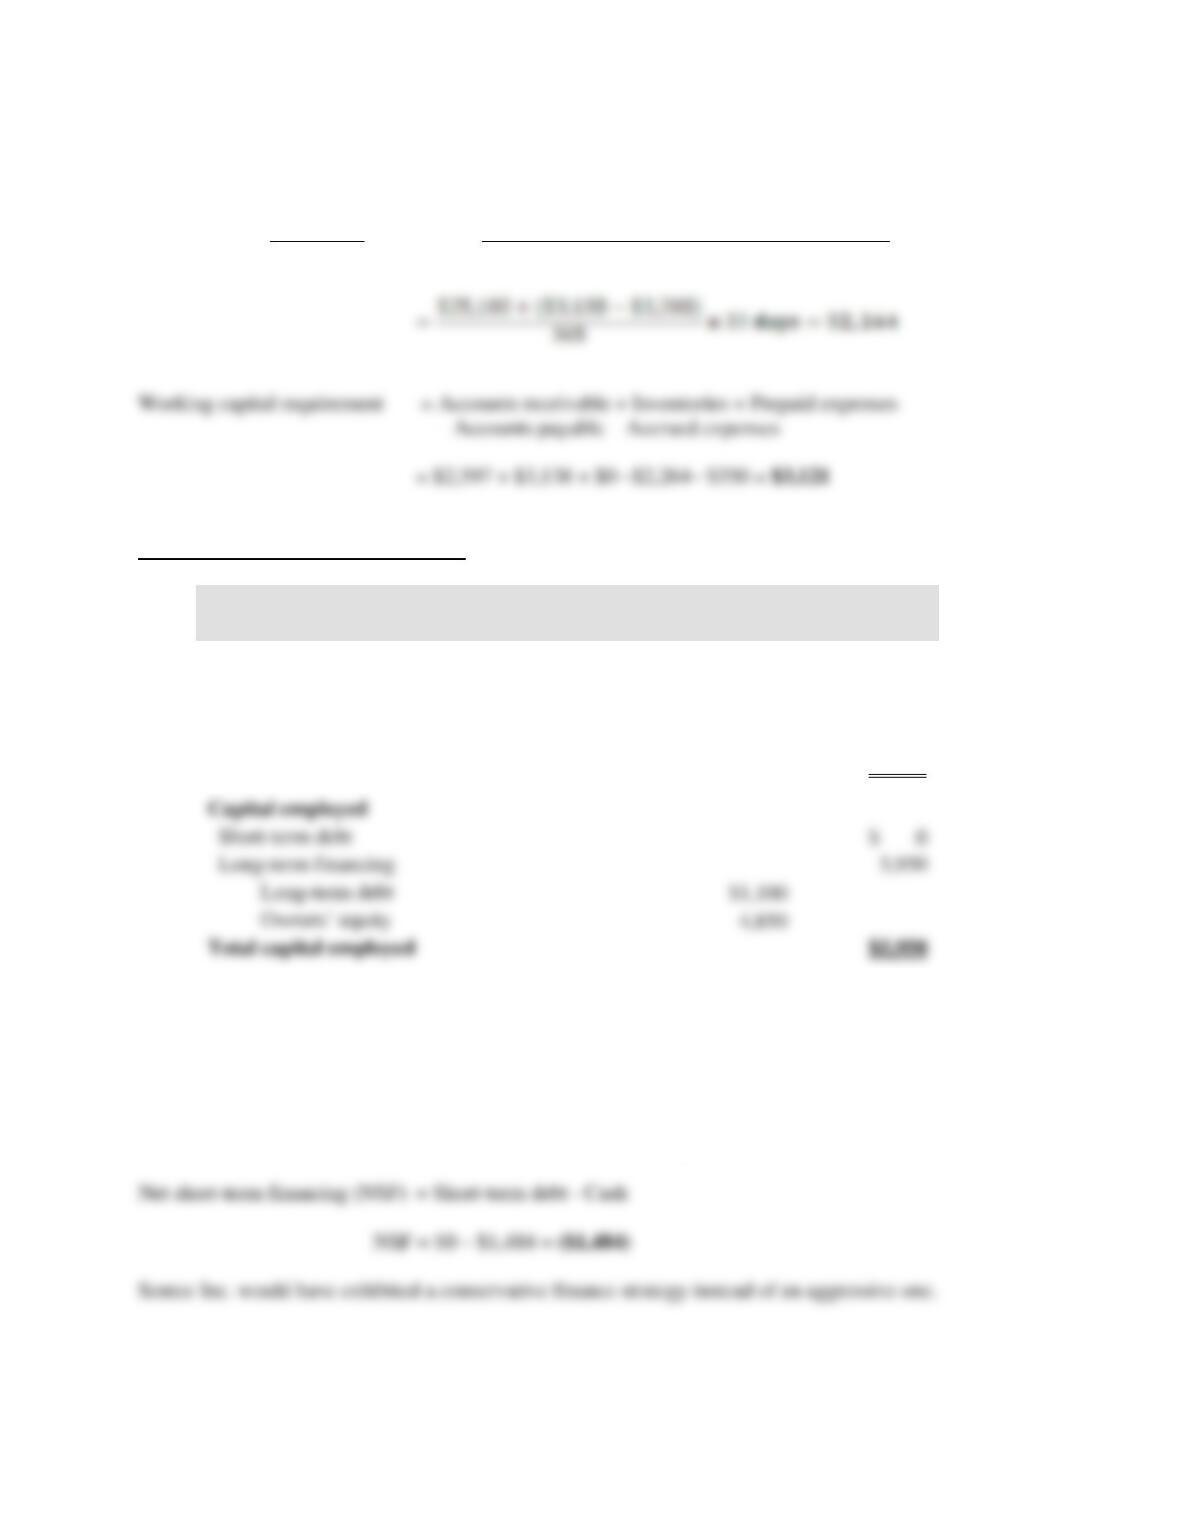
Accounts payable12/31/10 =
days33
365
sinventorieinChangesoldgoodsofCost
days33
365
Purchases
+
=
Pro forma managerial balance sheet
in thousands
December 31,
2010
Invested capital
Cash
$1,379
Working capital requirement (WCR)
3,121
Net fixed assets
1,450
Total invested capital
$5,950
Capital employed
Short-term debt
Long-term financing
Long-term debt
Owners’ equity
Note that the amount of long-term financing ($5,950) would have been higher than the investment in
fixed assets and in the operating cycle ($1,450 + $3,121 = $4,571). Sentec Inc. would not have needed
any short-term debt, and would have $1,379 million (5,950 – $44,571) in cash.
Net long-term financing (NLF) = Long-term debt + Owners’ equity – Net fixed assets
NLF = $1,100 + $4,850 – $1,450 = $4,500
3-11
10. Seasonal business.
a.
Working capital requirement (WCR) = Inventories + Accounts receivable + Prepaid expenses
– Accounts payable – Accrued expenses
June 30, 2009
WCR = $1,986 + $1,953 + $80 – $1,450 – $98 = $2,471
December 31, 2009
WCR = $2,694 + $2,616 + $42 – $1,950 – $114 = $3,288
Collection period days =
180/851,13$
616,2$
= 34 days (rounded)
3-12
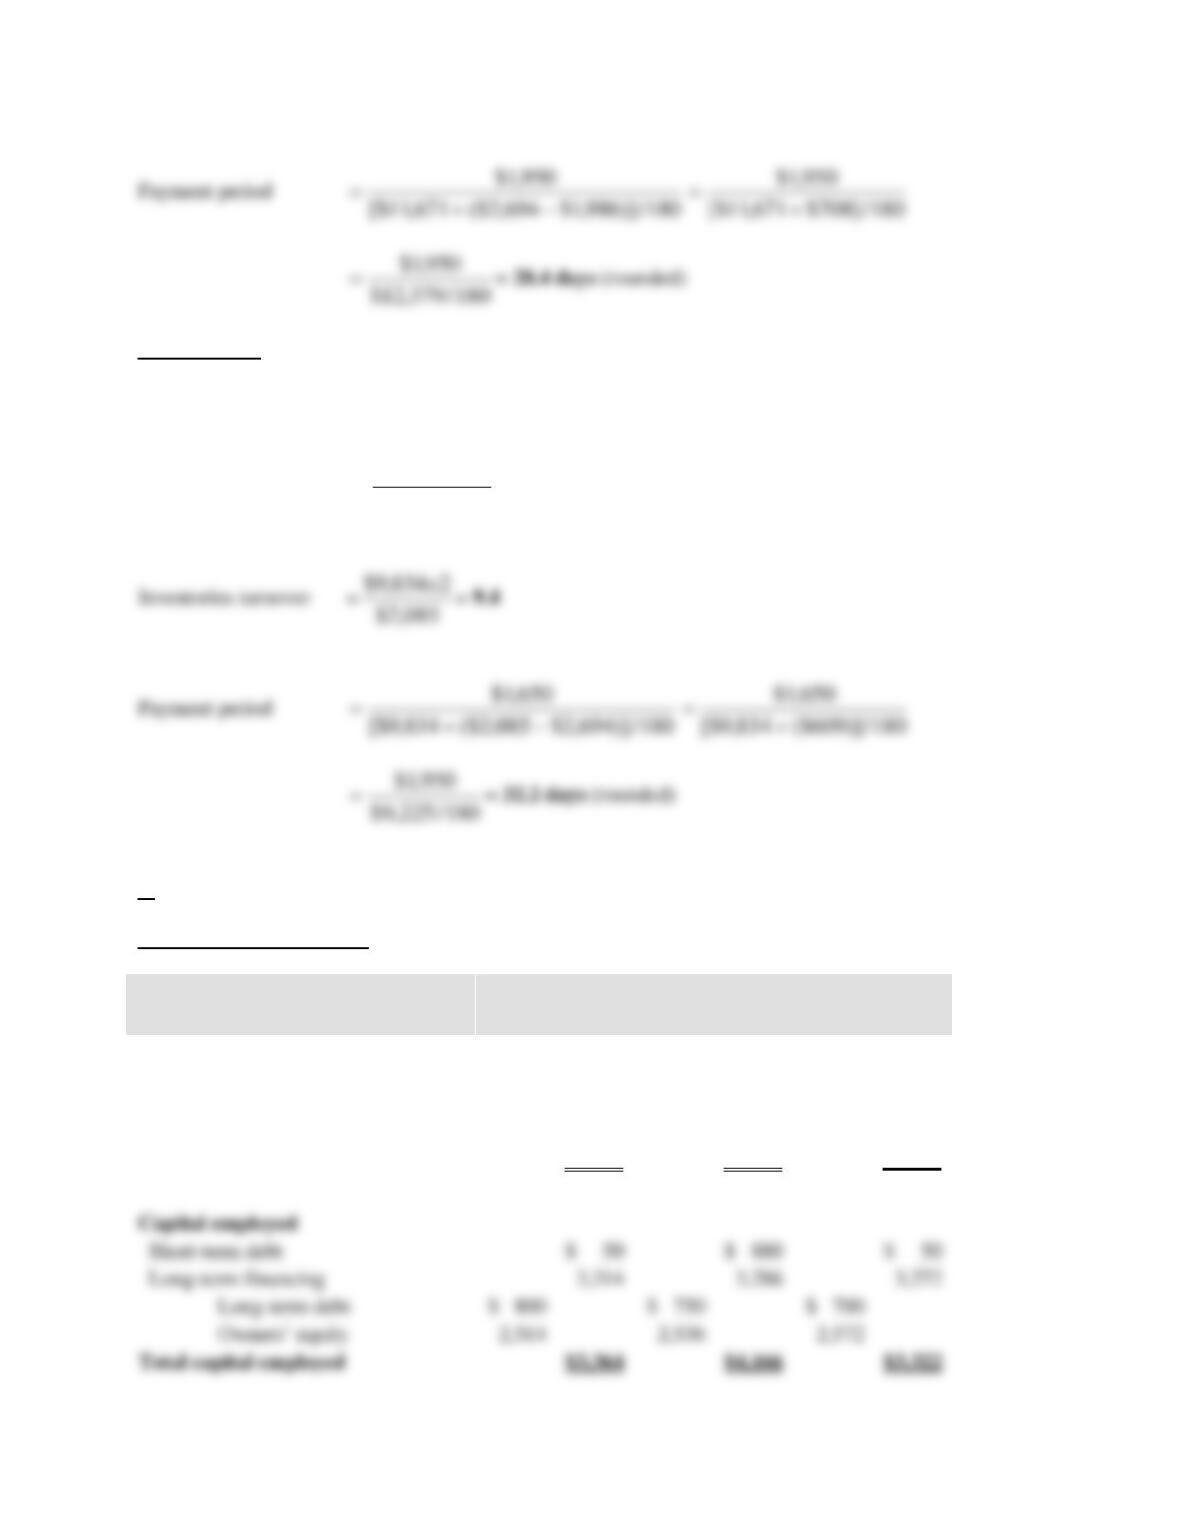
June 30, 2010
WCR = $2,085 + $2,100 + $25 – $1,650 – $138 = $2,422
Collection period days =
180/720,11$
100,2$
= 32.3 days (rounded)
b.
Managerial balance sheet
in thousands
June 30,
2009
December 31,
2009
June 30,
2010
Invested capital
Cash
$ 160
$ 60
$ 70
Working capital requirement (WCR)
((WC(WCR)
2,471
3,288
2,422
Net fixed assets
733
818
830
Total invested capital
$3,364
$4,166
$3,322
Capital employed
Short-term debt
$ 50
$ 880
$ 50
Long-term financing
3,314
3,286
3,272
Long-term debt
$ 800
$ 750
$ 700
Owners’ equity
2,514
2,536
2,572
Total capital employed
$3,364
$4,166
$3,322
3-13
c.
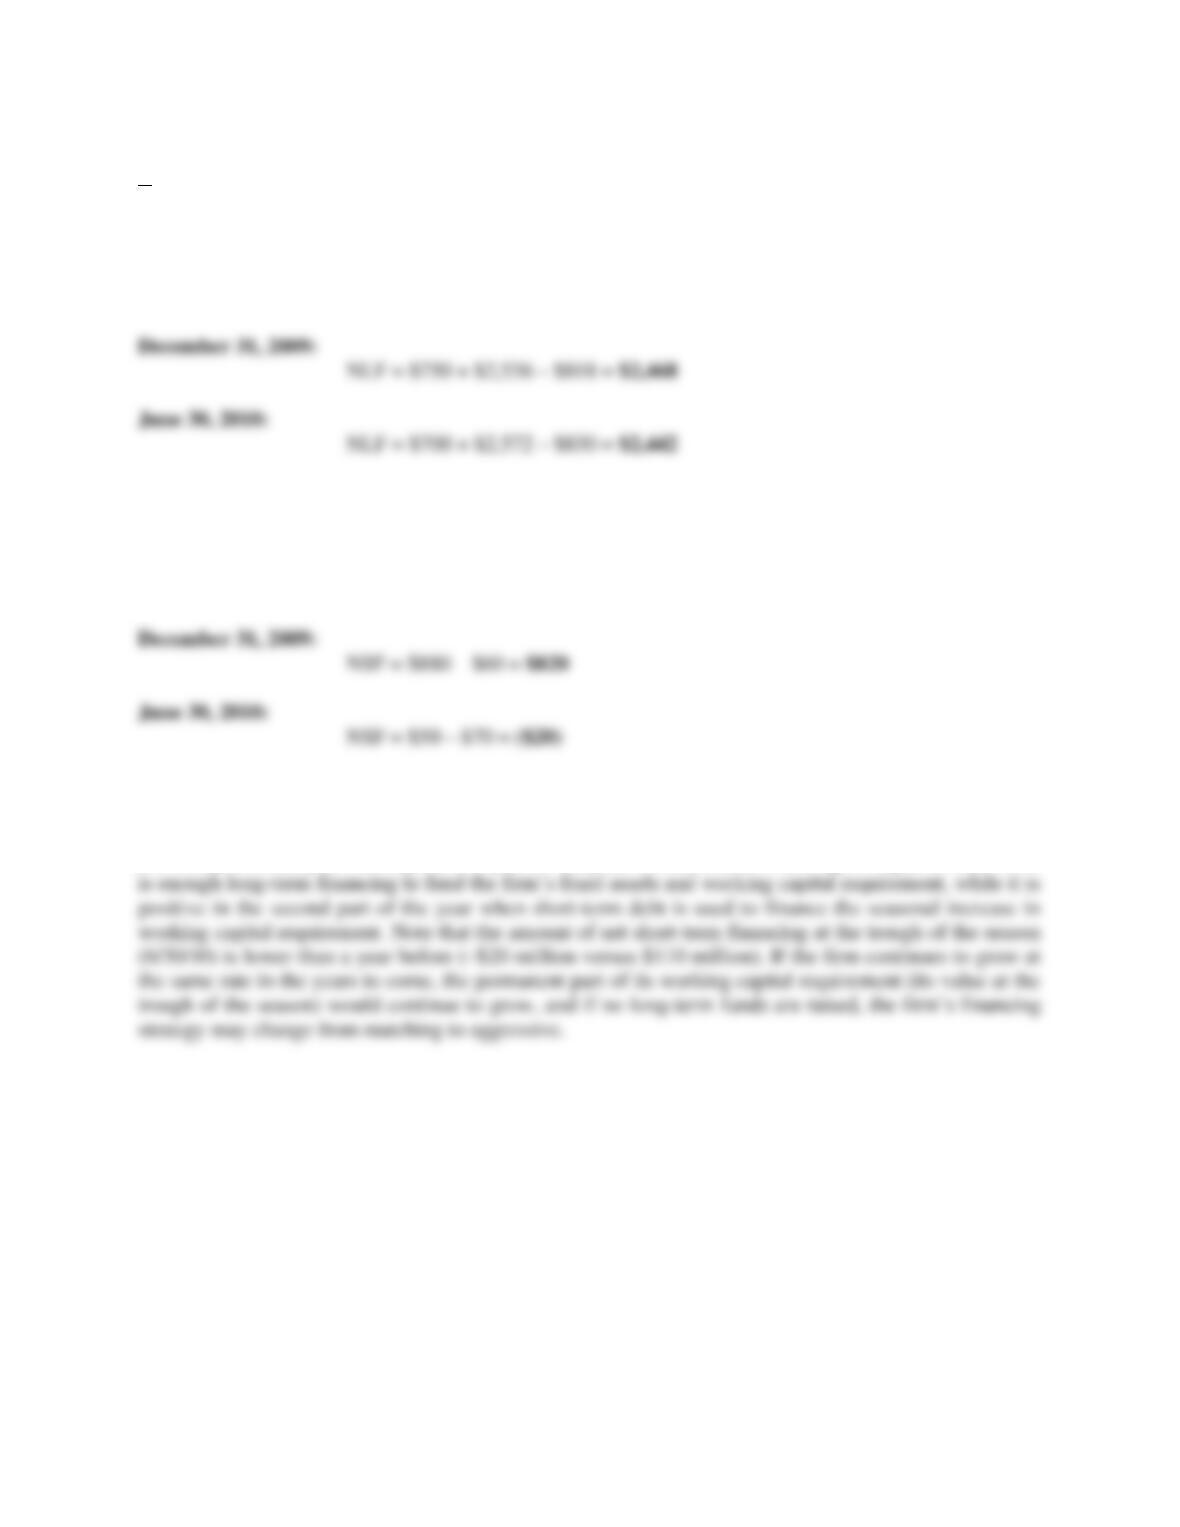
Net long-term financing (NLF) = Long-term debt + Owners’ equity – Net fixed assets
June 30, 2009: NLF = $800 + $2,514 – $733 = $2,581
Net short-term financing (NSF) = Short-term debt – Cash
June 30, 2009: NSF = $50 – $160 = ($110)
Mars Electronics has a matching strategy since its short-term financing needs are funded with short-term
debt and its permanent financing needs are funded with long-term debt and equity. The firm has a
seasonal activity: its sales and working capital requirement are larger in the second part of the year than in
the first part of the year. During the first part of the year, net short-term financing is negative since there