CHAPTER 3—RISK AND RETURN: PART II
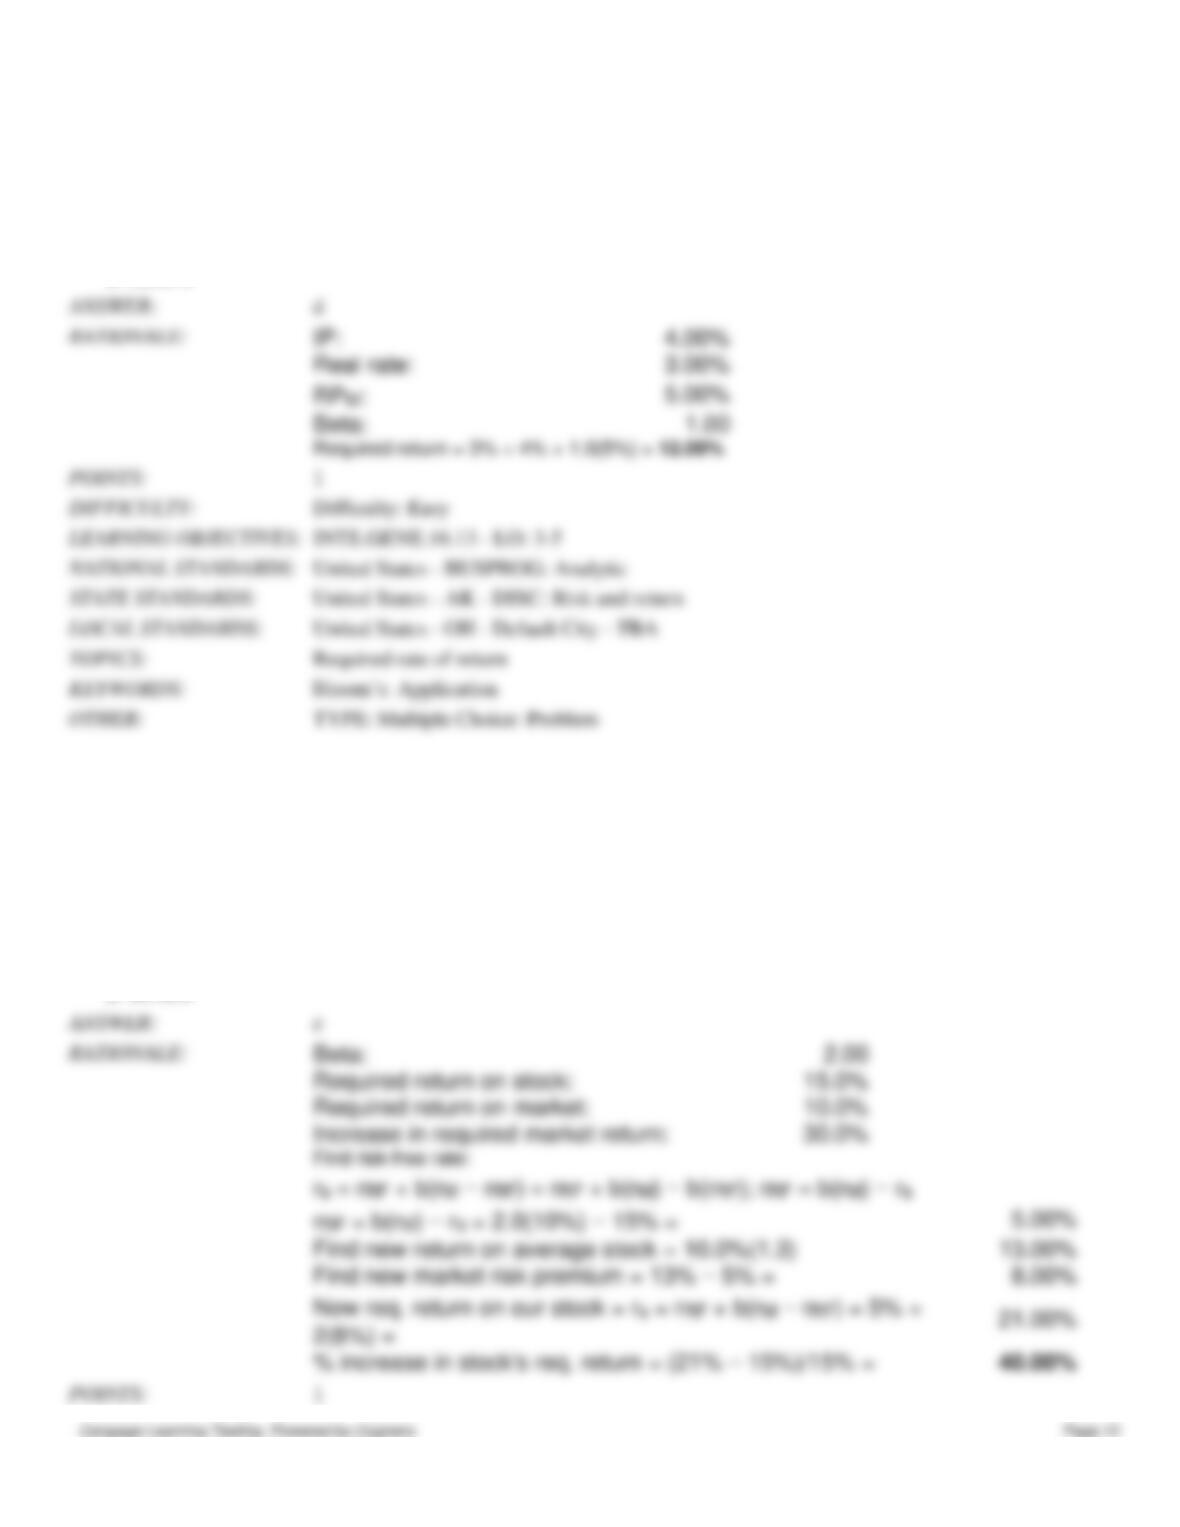
last 5 years. Calculate the required rate of return for Talcot Inc.
a.
10.29%
b.
10.83%
c.
11.40%
d.
12.00%
e.
12.60%
28. A stock you are holding has a beta of 2.0 and the stock is currently in equilibrium. The required rate of return on the
stock is 15% versus a required return on an average stock of 10%. Now the required return on an average stock increases
by 30.0% (not percentage points). The risk-free rate is unchanged. By what percentage (not percentage points) would the
required return on your stock increase as a result of this event?
a.
36.10%
b.
38.00%
c.
40.00%
d.
42.00%
e.
44.10%
c
CHAPTER 3—RISK AND RETURN: PART II
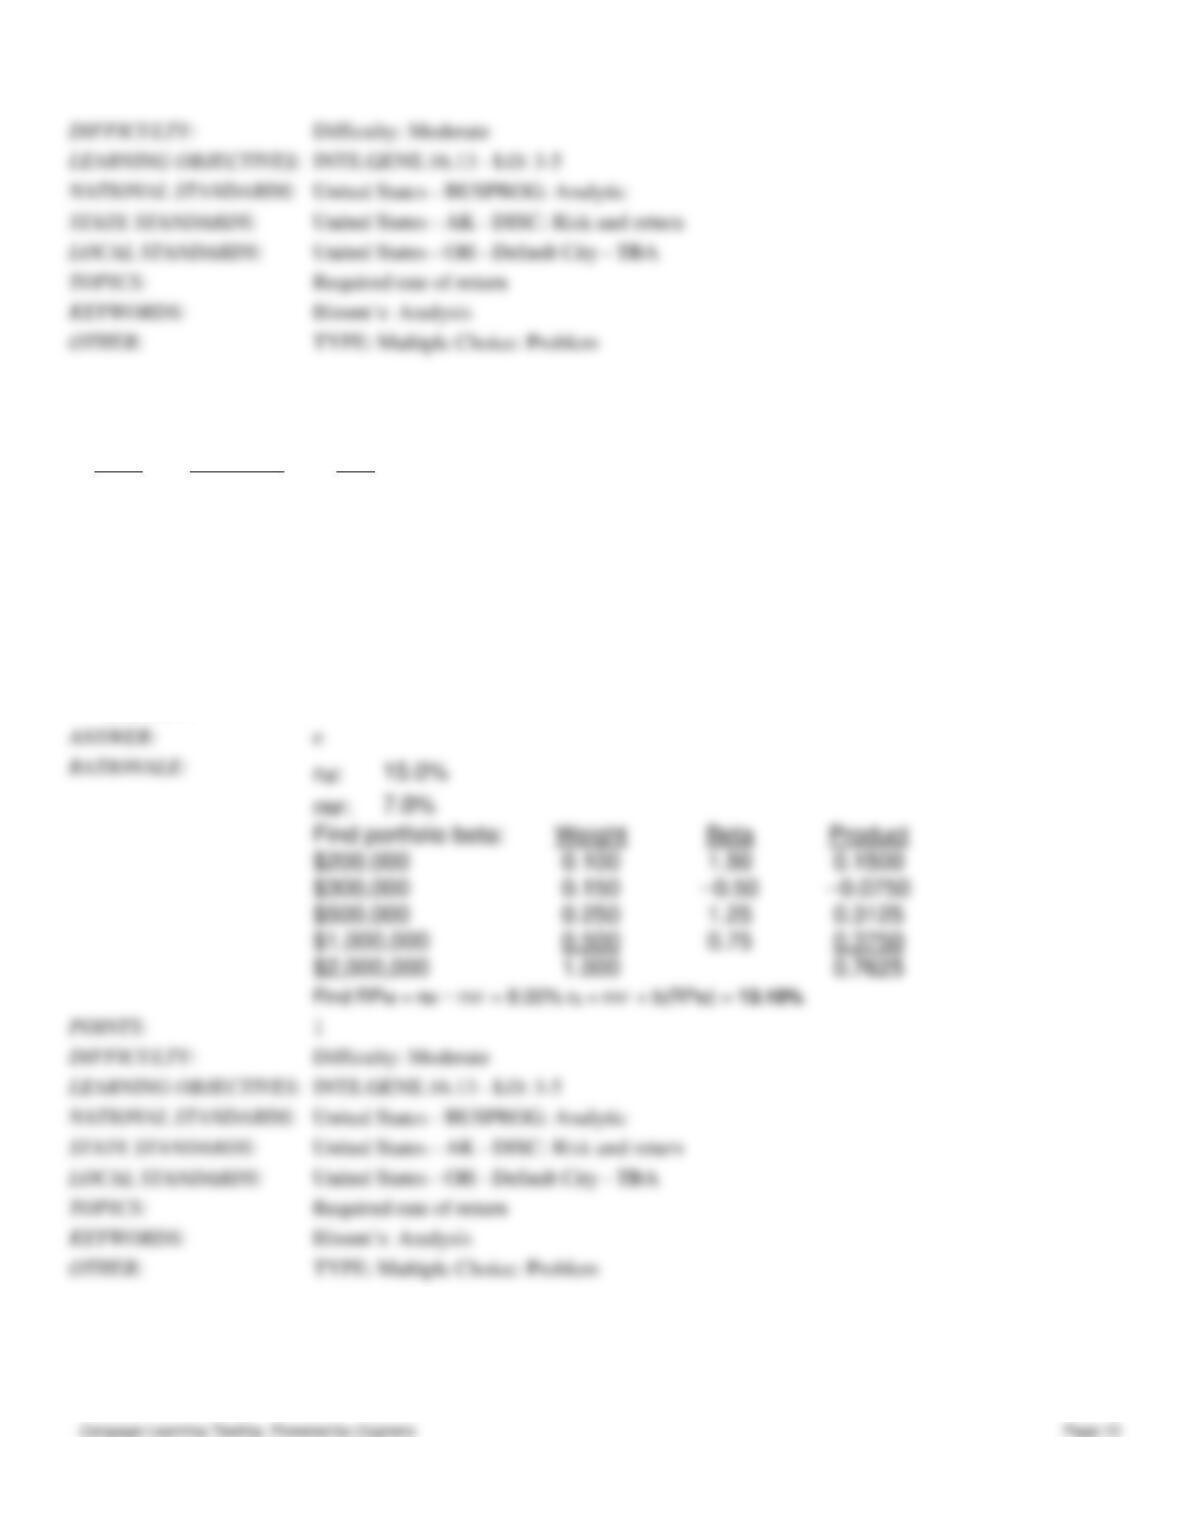
29. Calculate the required rate of return for the Wagner Assets Management Group, which holds 4 stocks. The market’s
required rate of return is 15.0%, the risk-free rate is 7.0%, and the Fund’s assets are as follows:
Stock
Investment
Beta
A
$ 200,000
1.50
B
300,000
−0.50
C
500,000
1.25
D
1,000,000
0.75
a.
10.67%
b.
11.23%
c.
11.82%
d.
12.45%
e.
13.10%
e
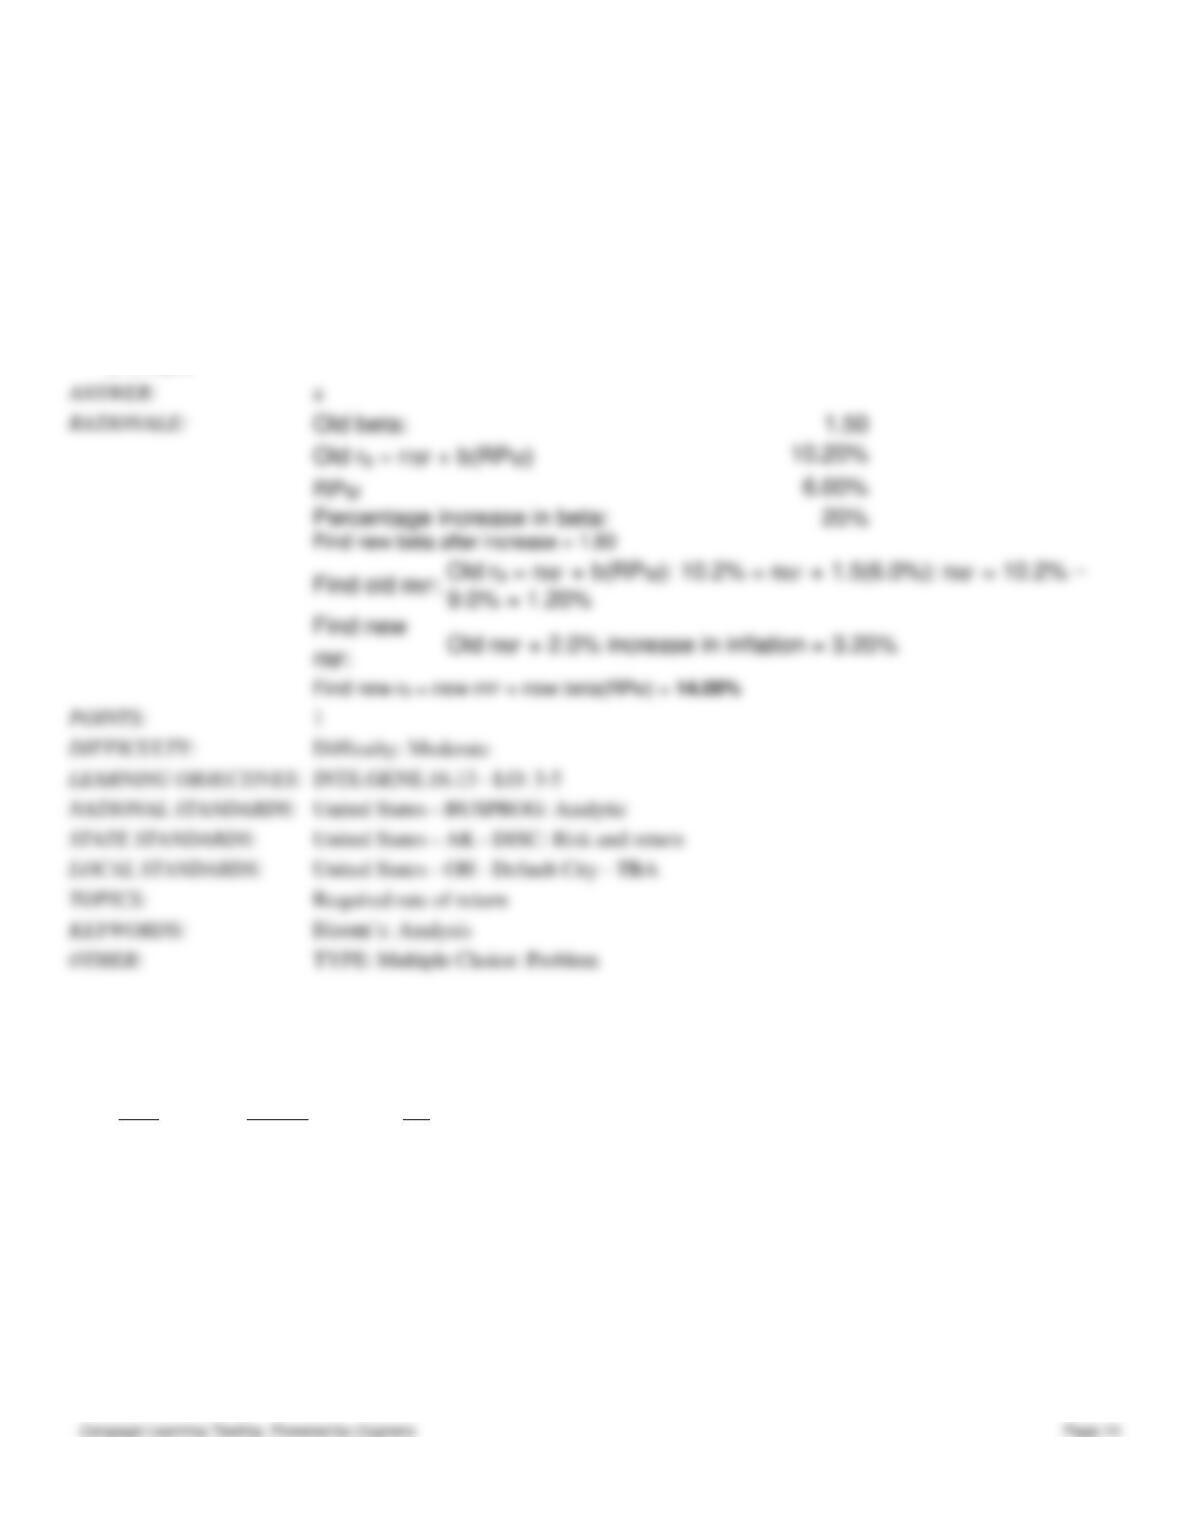
30. Consider the information below for Postman Builders Inc. Suppose that the expected inflation rate and thus the
inflation premium increase by 2.0 percentage points, and Postman acquires risky assets that increase its beta by the
indicated percentage. What is the firm’s new required rate of return?
CHAPTER 3—RISK AND RETURN: PART II
Beta:
1.50
Required return (rs)
10.20%
RPM:
6.00%
Percentage increase in beta:
20%
a.
14.00%
b.
14.70%
c.
15.44%
d.
16.21%
e.
17.02%
a
Difficulty: Moderate
INTE.GENE.16.13 – LO: 3-5
United States – BUSPROG: Analytic
United States – AK – DISC: Risk and return
United States – OH – Default City – TBA
Required rate of return
TYPE: Multiple Choice: Problem
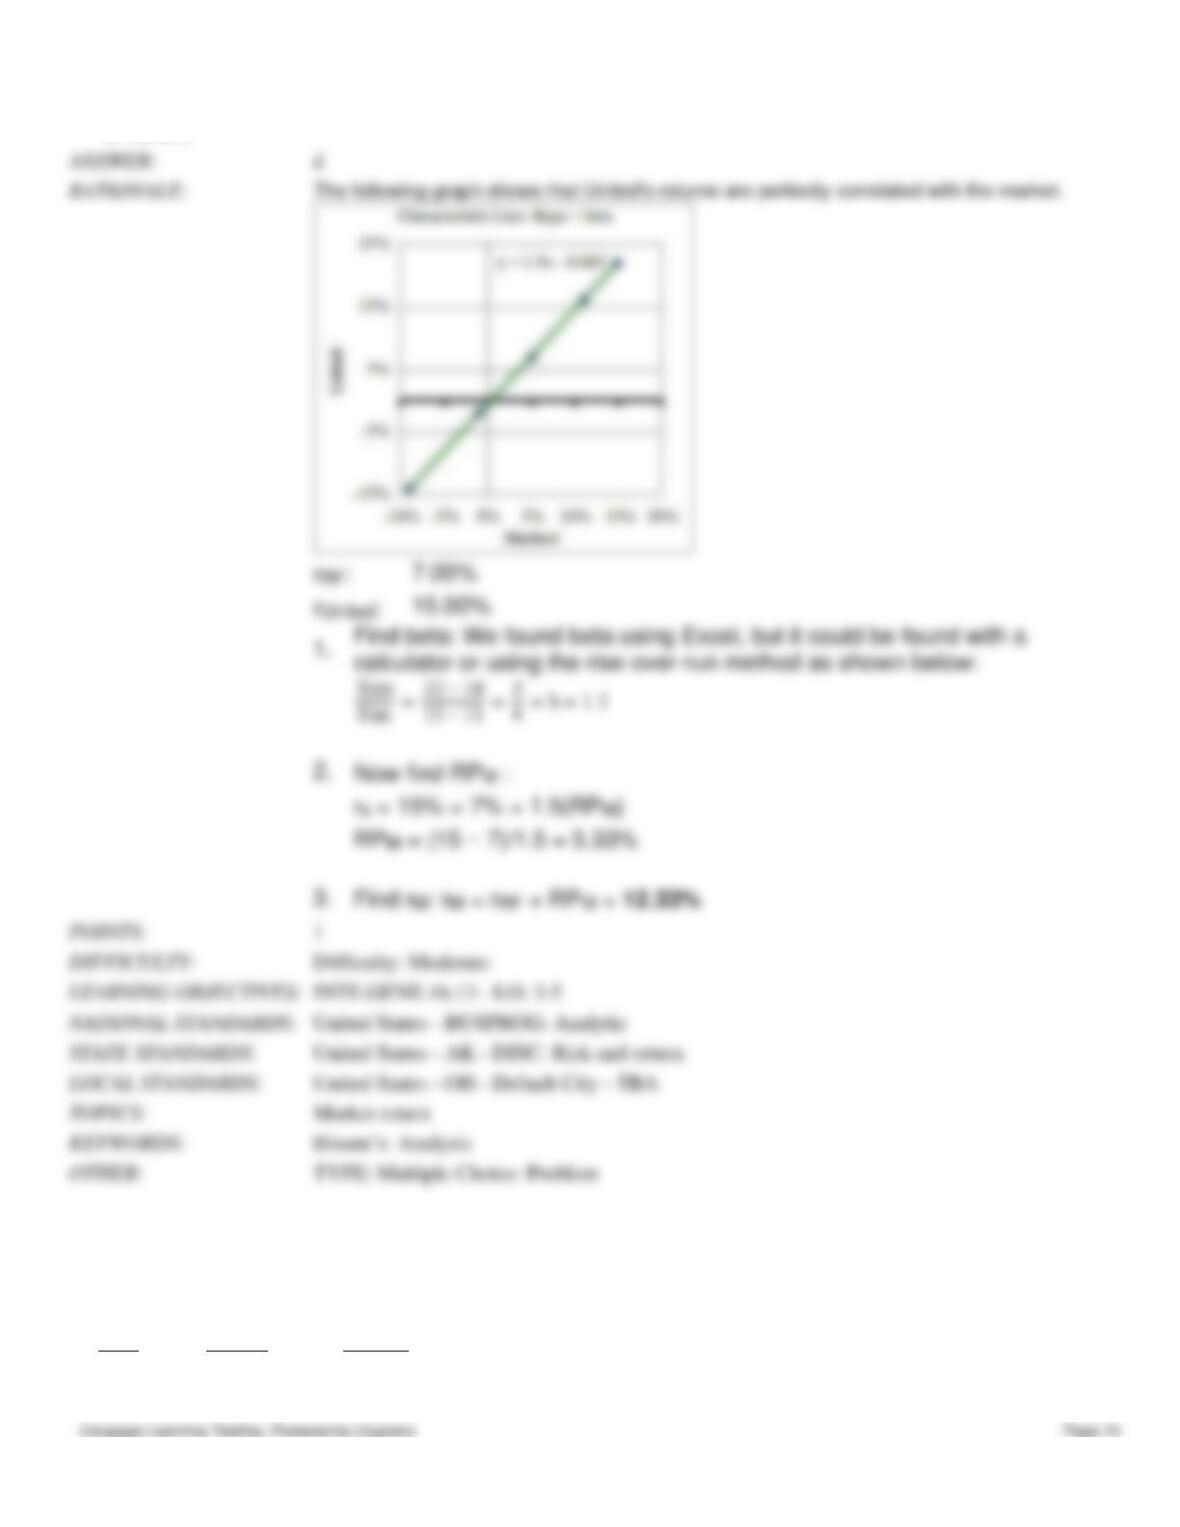
31. Assume that the market is in equilibrium and that stock betas can be estimated with historical data. The returns on the
market, the returns on United Fund (UF), the risk-free rate, and the required return on the United Fund are shown below.
Based on this information, what is the required return on the market, rM?
Year
Market
UF
2011
−9%
−14%
2012
11%
16%
2013
15%
22%
2014
5%
7%
2015
−1%
−2%
rRF: 7.00%;
rUnited: 15.00%
a.
10.57%
b.
11.13%
c.
11.72%
d.
12.33%
CHAPTER 3—RISK AND RETURN: PART II
e.
12.95%
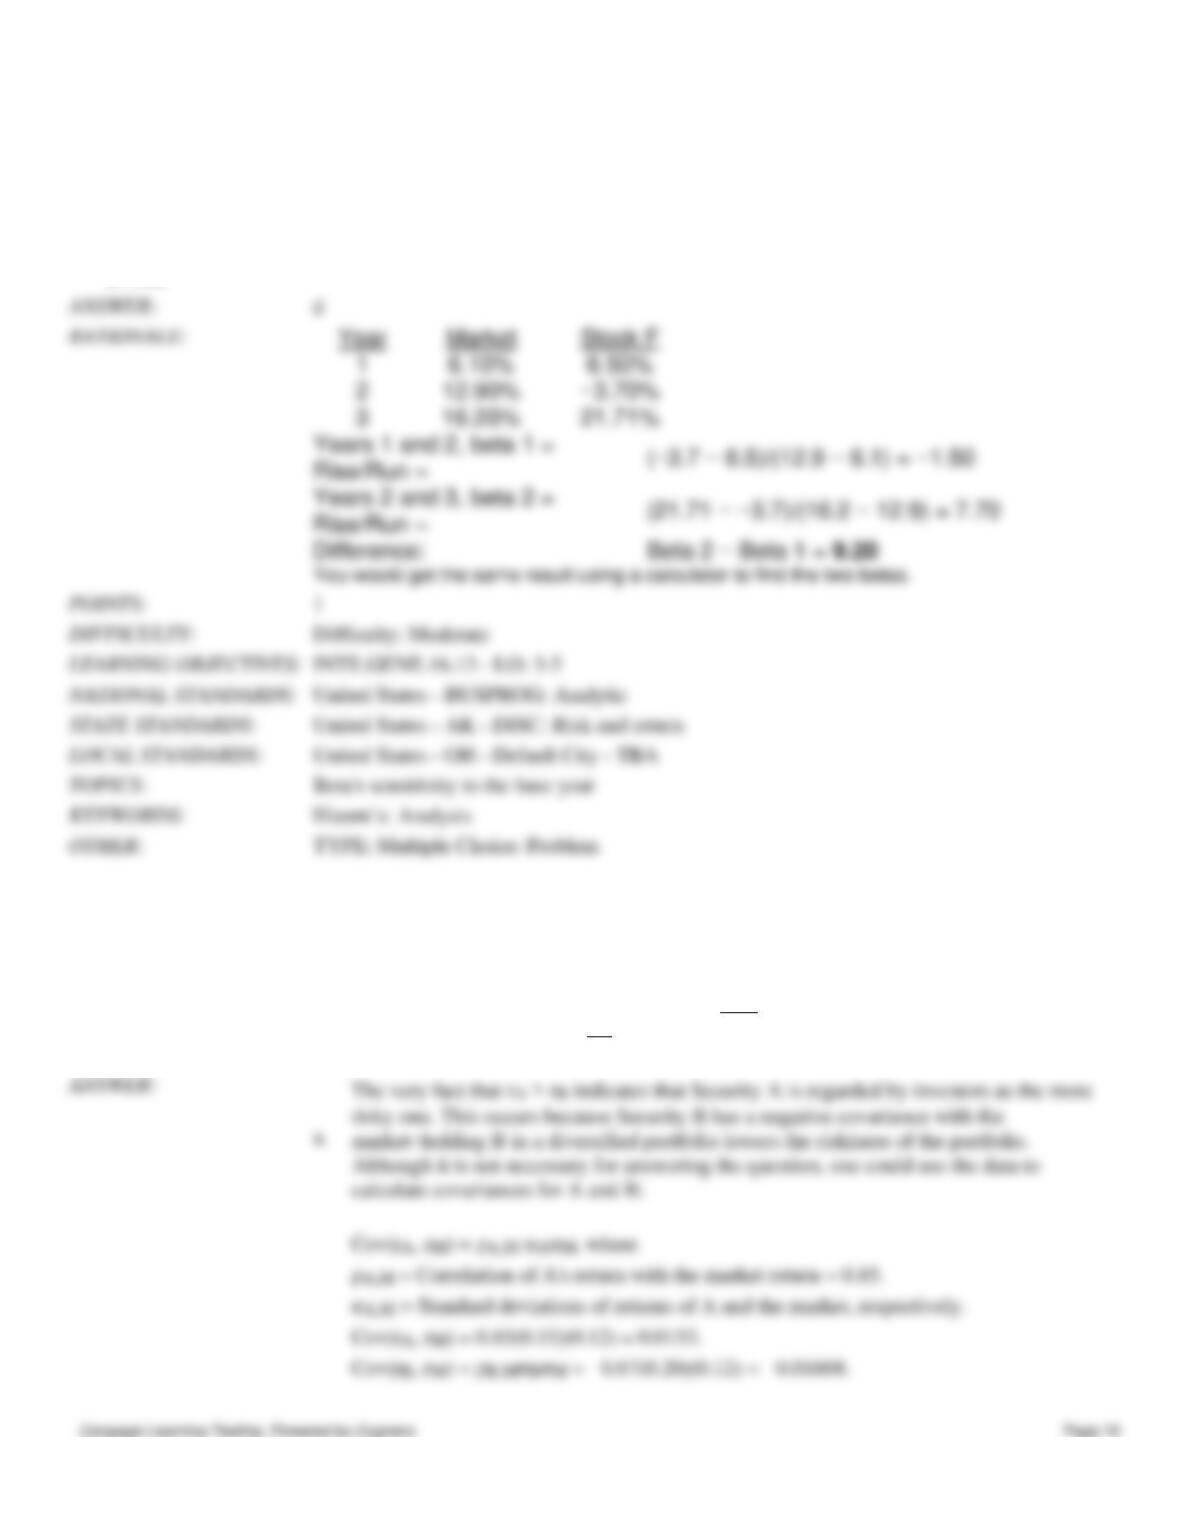
32. You are given the following returns on “the market” and Stock F during the last three years. We could calculate beta
using data for Years 1 and 2 and then, after Year 3, calculate a new beta for Years 2 and 3. How different are those two
betas, i.e., what’s the value of beta 2 − beta 1? (Hint: You can find betas using the Rise-Over-Run method, or using your
calculator’s regression function.)
Year
Market
Stock F
1
6.10%
6.50%
2
12.90%
−3.70%
CHAPTER 3—RISK AND RETURN: PART II
3
16.20%
21.71%
a.
7.89
b.
8.30
c.
8.74
d.
9.20
e.
9.66
Difficulty: Moderate
INTE.GENE.16.13 – LO: 3-5
United States – BUSPROG: Analytic
United States – AK – DISC: Risk and return
United States – OH – Default City – TBA
Beta’s sensitivity to the base year
TYPE: Multiple Choice: Problem
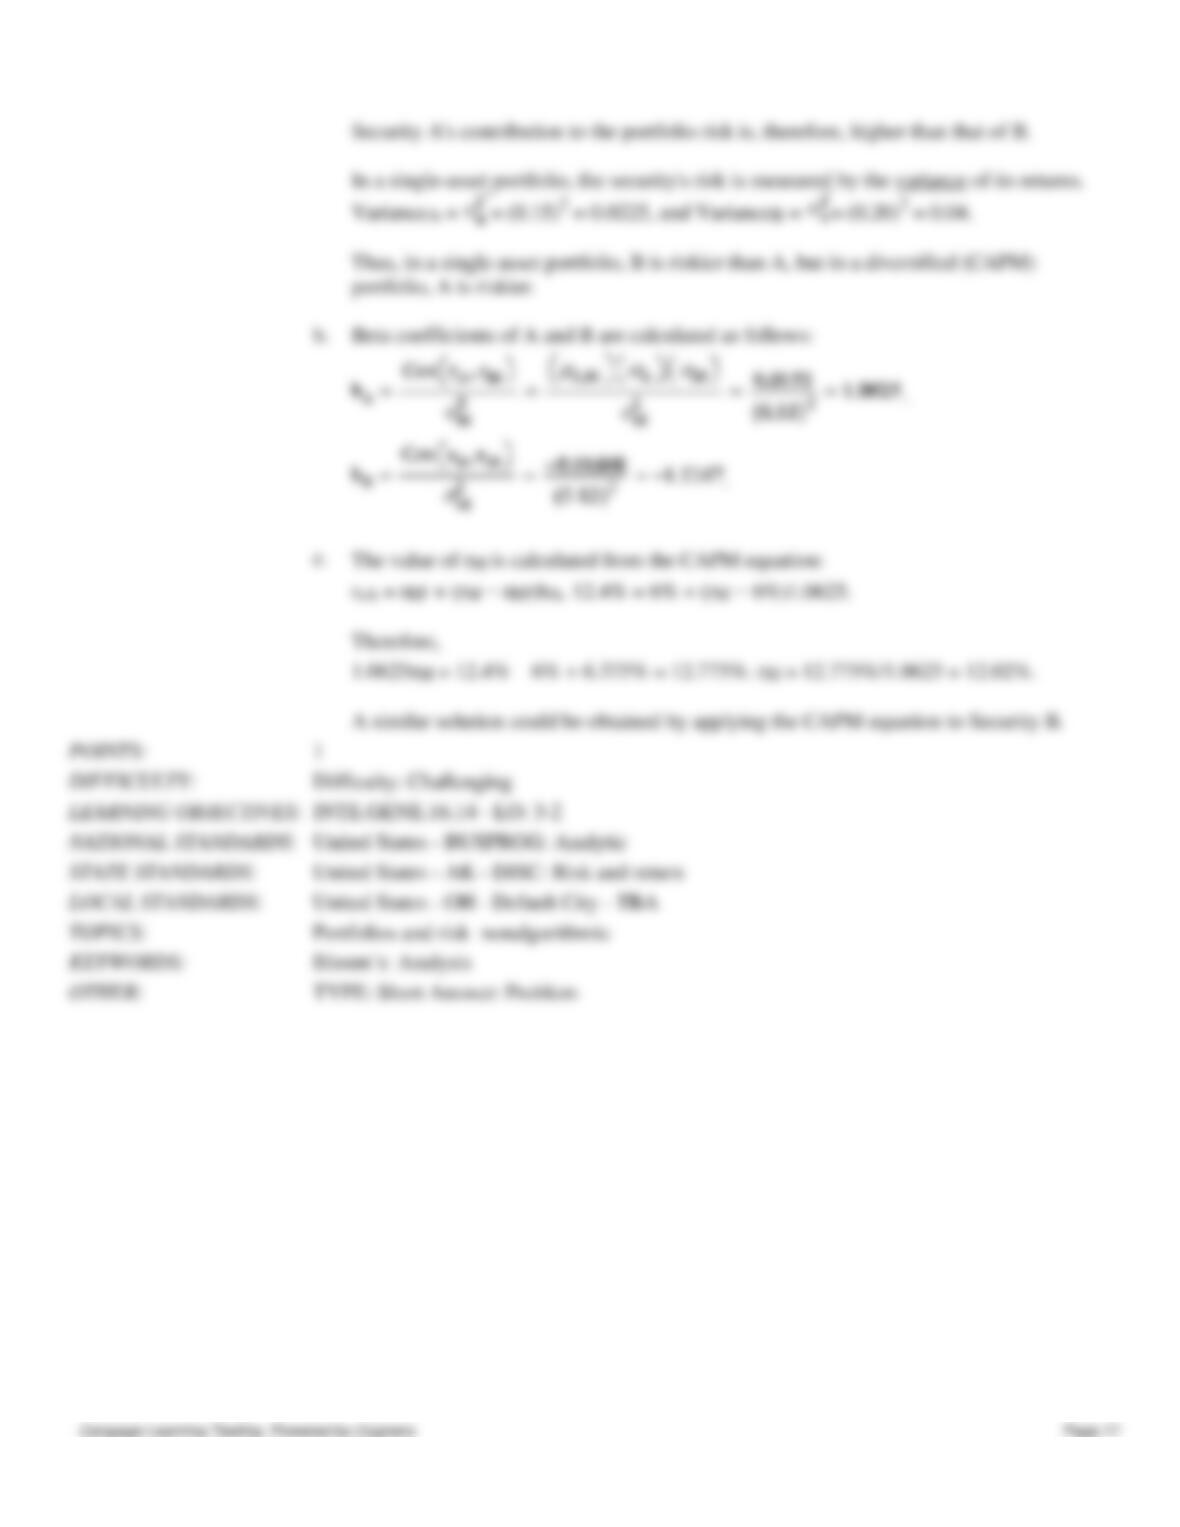
33. Security A has an expected return of 12.4% with a standard deviation of 15%, and a correlation with the market of
0.85. Security B has an expected return of −0.73% with a standard deviation of 20%, and a correlation with the market of
−0.67. The standard deviation of rM is 12%.
a.
To someone who acts in accordance with the CAPM, which security is more risky, A or B?
Why? (Hint: No calculations are necessary to answer this question; it is easy.)
b.
What are the beta coefficients of A and B? Calculations are necessary.
c.
If the risk-free rate is 6%, what is the value of rM?
CHAPTER 3—RISK AND RETURN: PART II
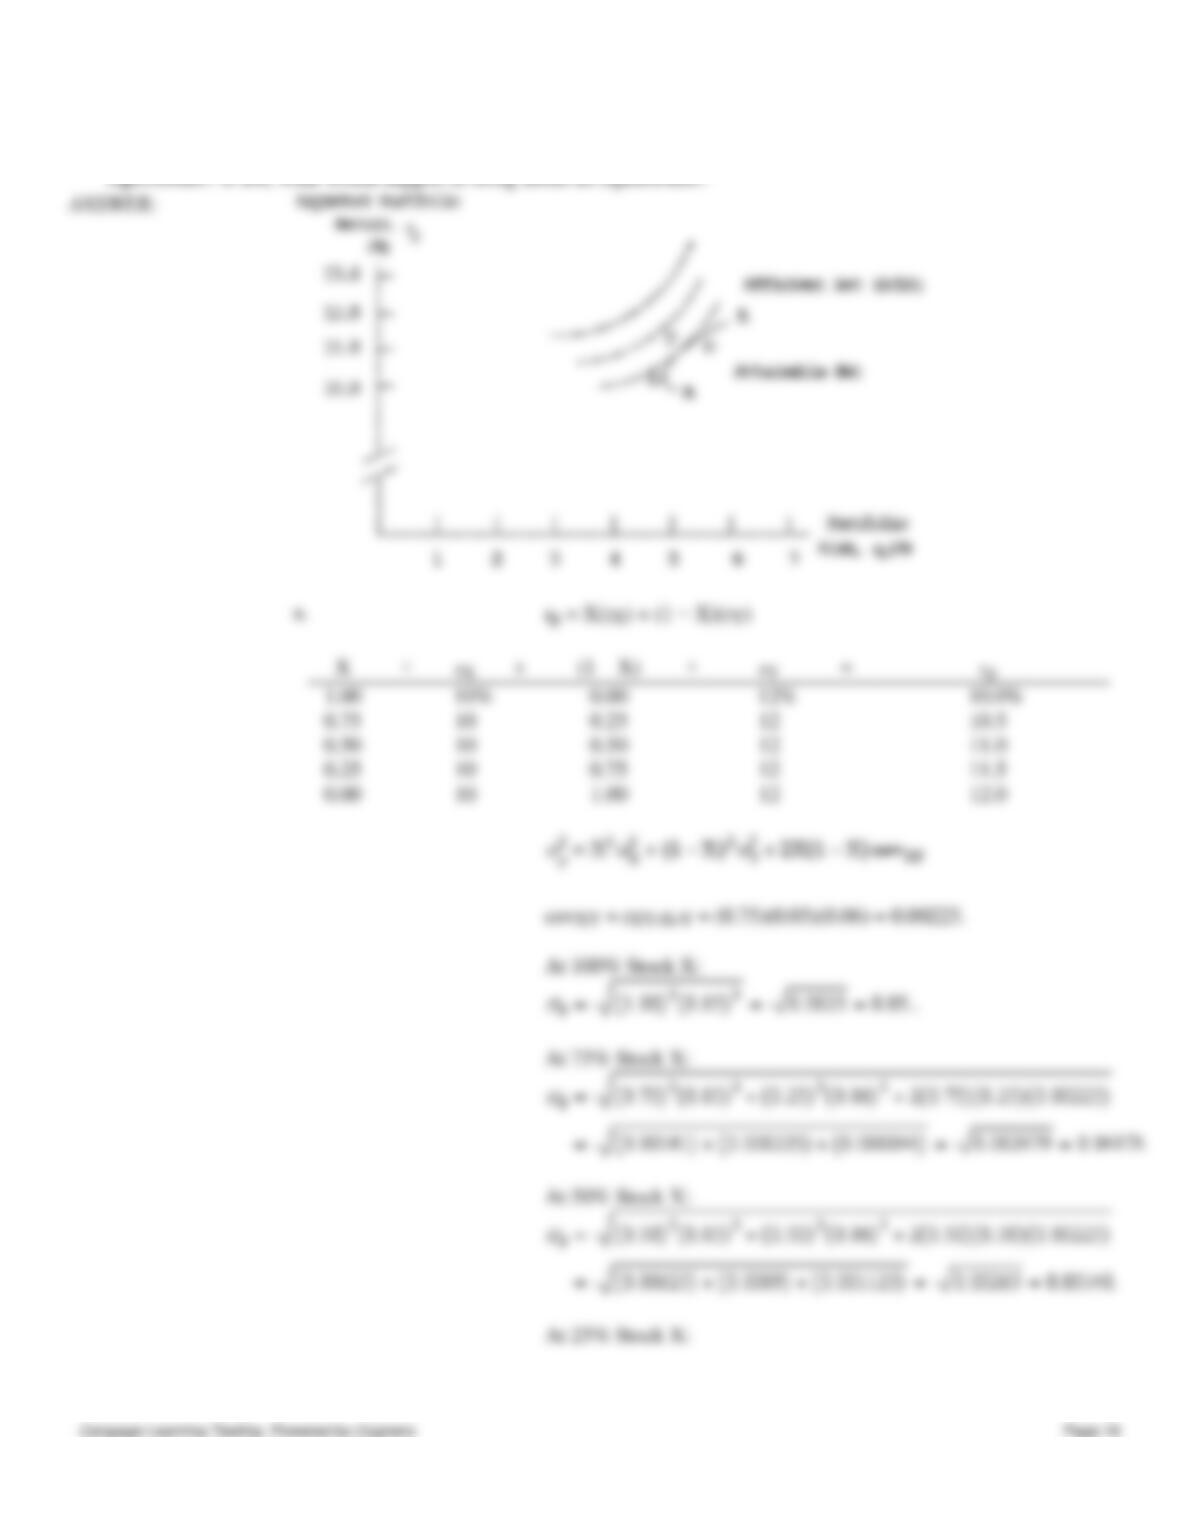
34. You plan to invest in Stock X, Stock Y, or some combination of the two. The expected return for X is 10% and σX =
5%. The expected return for Y is 12% and σY = 6%. The correlation coefficient, rXY, is 0.75.
a.
Calculate rp and σp for 100%, 75%, 50%, 25%, and 0% in Stock X.
b.
Use the values you calculated for rp and σp to graph the attainable set of portfolios. Which
part of the attainable set is efficient? Also, draw in a set of hypothetical indifference curves
to show how an investor might select a portfolio comprised of Stocks X and Y. Let an
indifference curve be tangent to the efficient set at the point where rp = 11%.
c.
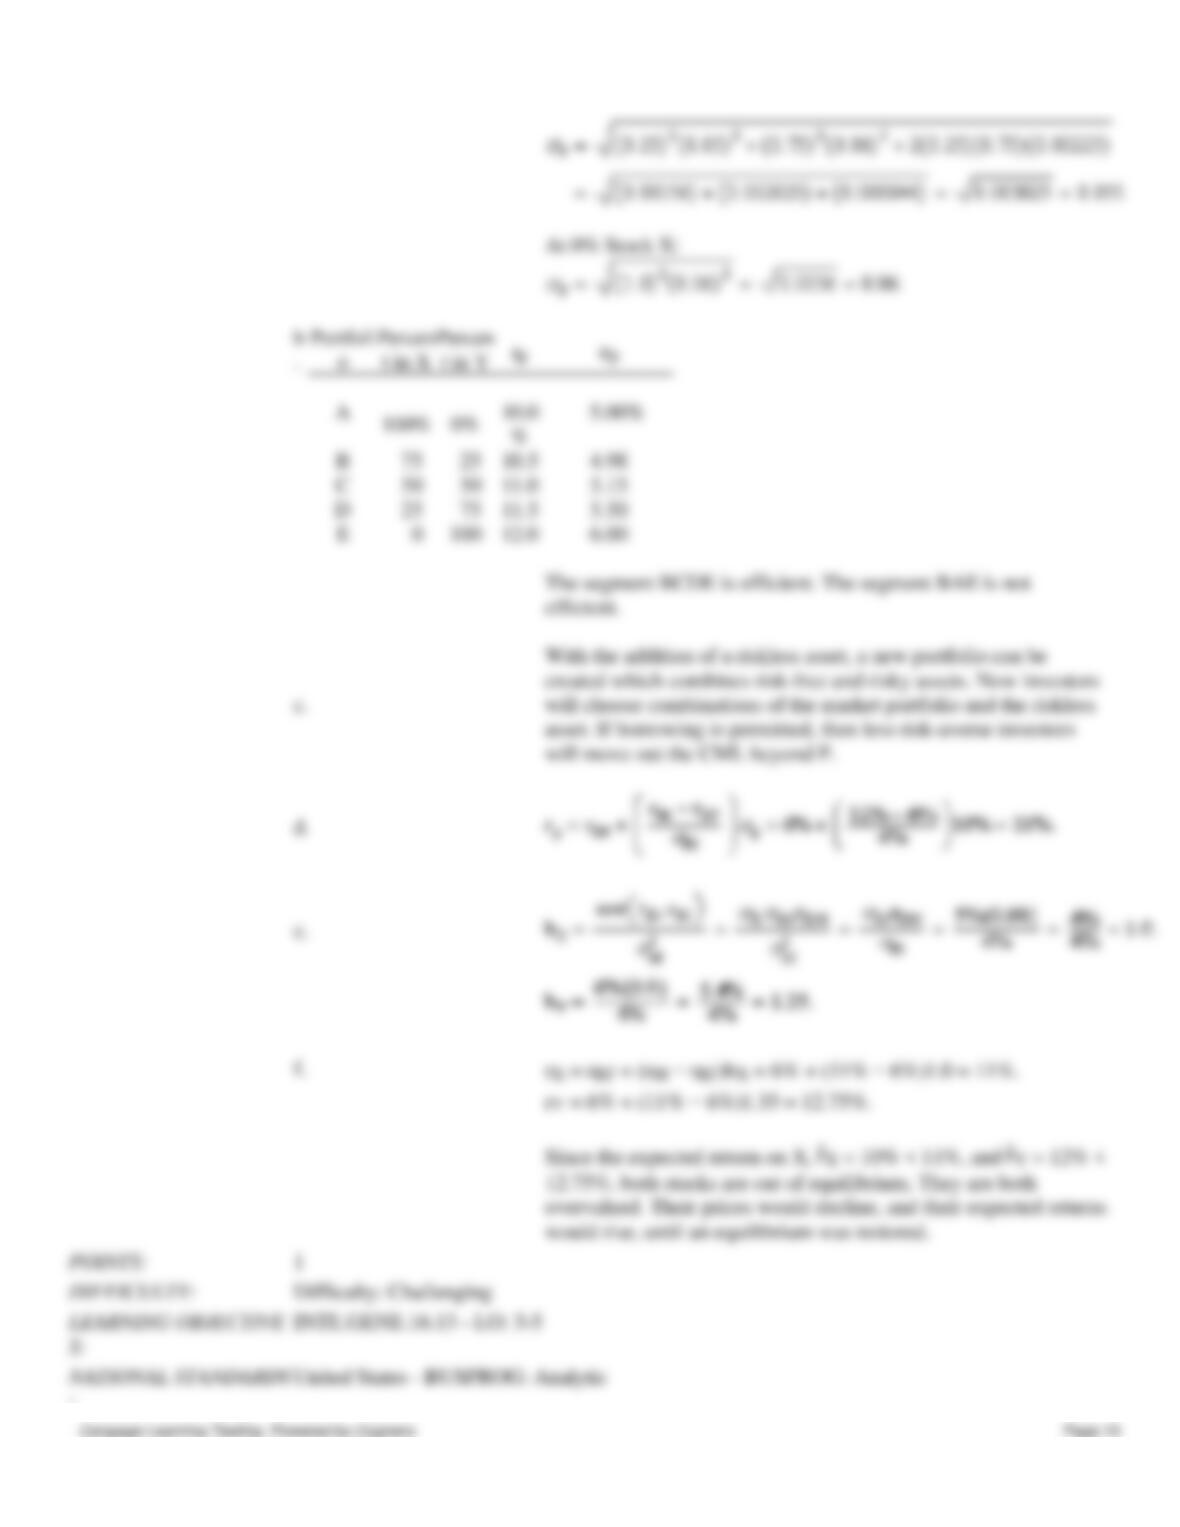
Now suppose we add a riskless asset to the investment possibilities. What effects will this
have on the construction of portfolios?
d.
Suppose rM = 12%, σM = 4%, and rRF = 6%. What would be the required and expected
return on a portfolio with σP = 10%?
e.
Suppose the correlation of Stock X with the market, rXM, is 0.8, while rYM = 0.9. Use this
information, along with data given previously, to determine Stock X’s and Stock Y’s beta
Security A’s contribution to the portfolio risk is, therefore, higher than that of B.
portfolio, A is riskier.
Beta coefficients of A and B are calculated as follows:
c.
The value of rM is calculated from the CAPM equation:
A similar solution could be obtained by applying the CAPM equation to Security B.
Difficulty: Challenging
INTE.GENE.16.14 – LO: 3-2
United States – BUSPROG: Analytic
United States – AK – DISC: Risk and return
United States – OH – Default City – TBA
Portfolios and risk–nonalgorithmic
TYPE: Short Answer: Problem
CHAPTER 3—RISK AND RETURN: PART II
coefficients.
f.
What is the required rate of return on Stocks X and Y? Do these stocks appear to be in
CHAPTER 3—RISK AND RETURN: PART II
:
CHAPTER 3—RISK AND RETURN: PART II
35. Stock A has an expected return rA = 10% and σA = 10%. Stock B has rB = 14% and σB = 15%. rAB = 0. The rate of
return on riskless assets is 6%.
a.
Construct a graph that shows the feasible and efficient sets, giving consideration to the
existence of the riskless asset.
b.
Explain what would happen to the CML if the two stocks had (a) a positive correlation
coefficient or (b) a negative correlation coefficient.
c.
Suppose these were the only three securities (A, B, and riskless) in the economy, and
everyone’s indifference curves were such that they were tangent to the CML to the right of
the point where the CML was tangent to the efficient set of risky assets. Would this represent
a stable equilibrium? If not, how would an equilibrium be produced?
The table below shows the returns and standard deviations for various
United States – AK – DISC: Risk and return
United States – OH – Default City – TBA
Portfolios and risk–nonalgorithmic
TYPE: Short Answer: Problem
CHAPTER 3—RISK AND RETURN: PART II