5) The ________ is used by financial managers as a structure for dissecting a firm’s financial
statements to assess its financial condition.
A) statement of cash flows
B) DuPont system of analysis
C) break-even analysis
D) technical analysis
6) In the DuPont system of analysis, the return on total assets (asset) is equal to ________.
A) (return on equity) × (financial leverage multiplier)
B) (return on equity) × (total asset turnover)
C) (net profit margin) × (fixed asset turnover)
D) (net profit margin) × (total asset turnover)
7) The modified DuPont formula relates the firm’s return on total assets (ROA) to its ________.
A) return on equity (ROE)
B) operating leverage multiplier
C) net profit margin
D) total asset turnover
8) In the DuPont system of analysis, the return on equity is equal to ________.
A) (net profit margin) × (total asset turnover)
B) (stockholders’ equity) × (financial leverage multiplier)
C) (return on total assets) × (financial leverage multiplier)
D) (return on total assets) × (total asset turnover)
9) A firm with a low net profit margin can improve its return on total assets by ________.
A) increasing its debt ratio
B) increasing its total asset turnover
C) decreasing its fixed asset turnover
D) decreasing its total asset turnover
10) Other things being equal, a decrease in total asset turnover will result in ________ in the
return on total assets.
A) an increase
B) a decrease
C) no change
D) an undetermined change
11) A firm with a low return on total assets can improve its return on equity, all else remaining
the same, by ________.
A) increasing its debt ratio
B) increasing its total asset turnover
C) decreasing its debt ratio
D) decreasing its total asset turnover
12) The three basic ratios used in the DuPont system of analysis are ________.
A) net profit margin, total asset turnover, and return on investment
B) net profit margin, total asset turnover, and return on equity
C) net profit margin, total asset turnover, and equity multiplier
D) net profit margin, financial leverage multiplier, and return on equity
13) The financial leverage multiplier is an indicator of how much ________ a corporation is
utilizing.
A) operating leverage
B) long-term debt
C) total debt
D) total assets
14) Financial leverage multiplier is the ratio of ________.
A) current assets to common stockholders’ equity
B) total assets to common stockholders’ equity
C) total assets to total debt
D) current assets to current liabilities
15) Using the DuPont system of analysis, holding other factors constant, an increase in financial
leverage will result in ________.
A) an increase in the return on equity
B) a decrease in the gross profit margin
C) an increase in the gross profit margin
D) an increase in retained earnings
63
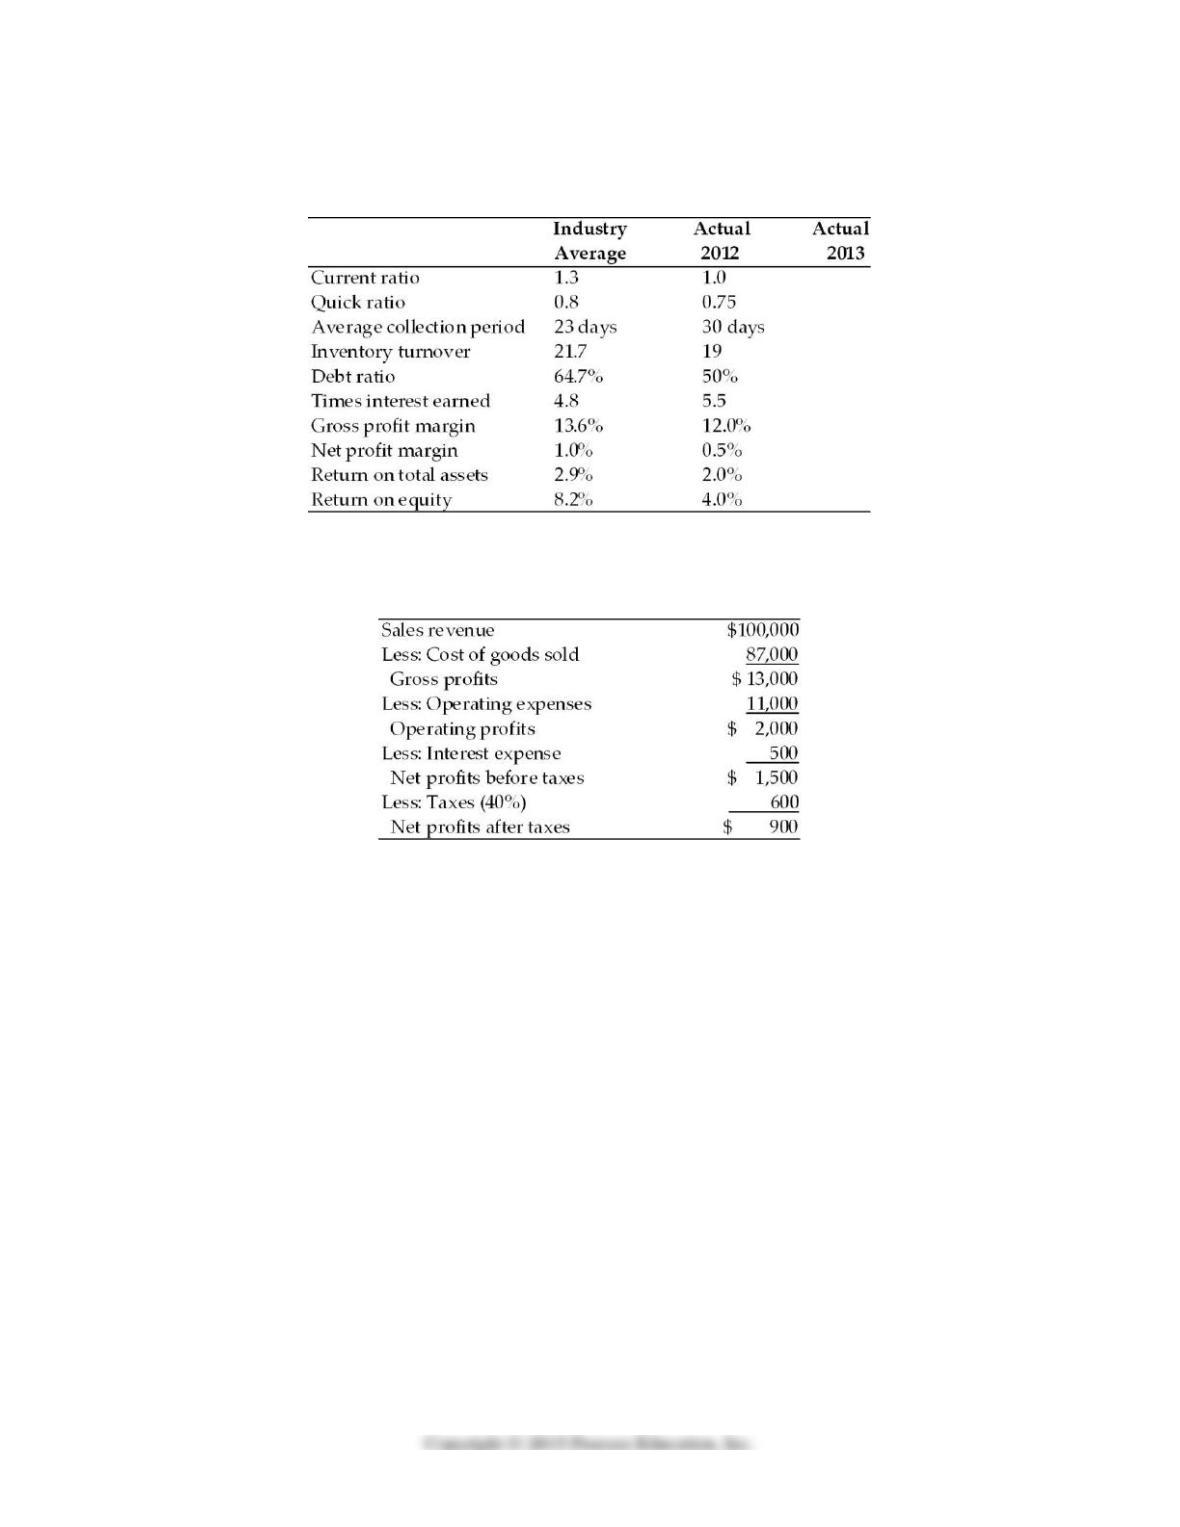
Table 3.2
Dana Dairy Products Key Ratios
Income Statement
Dana Dairy Products
For the Year Ended December 31, 2013
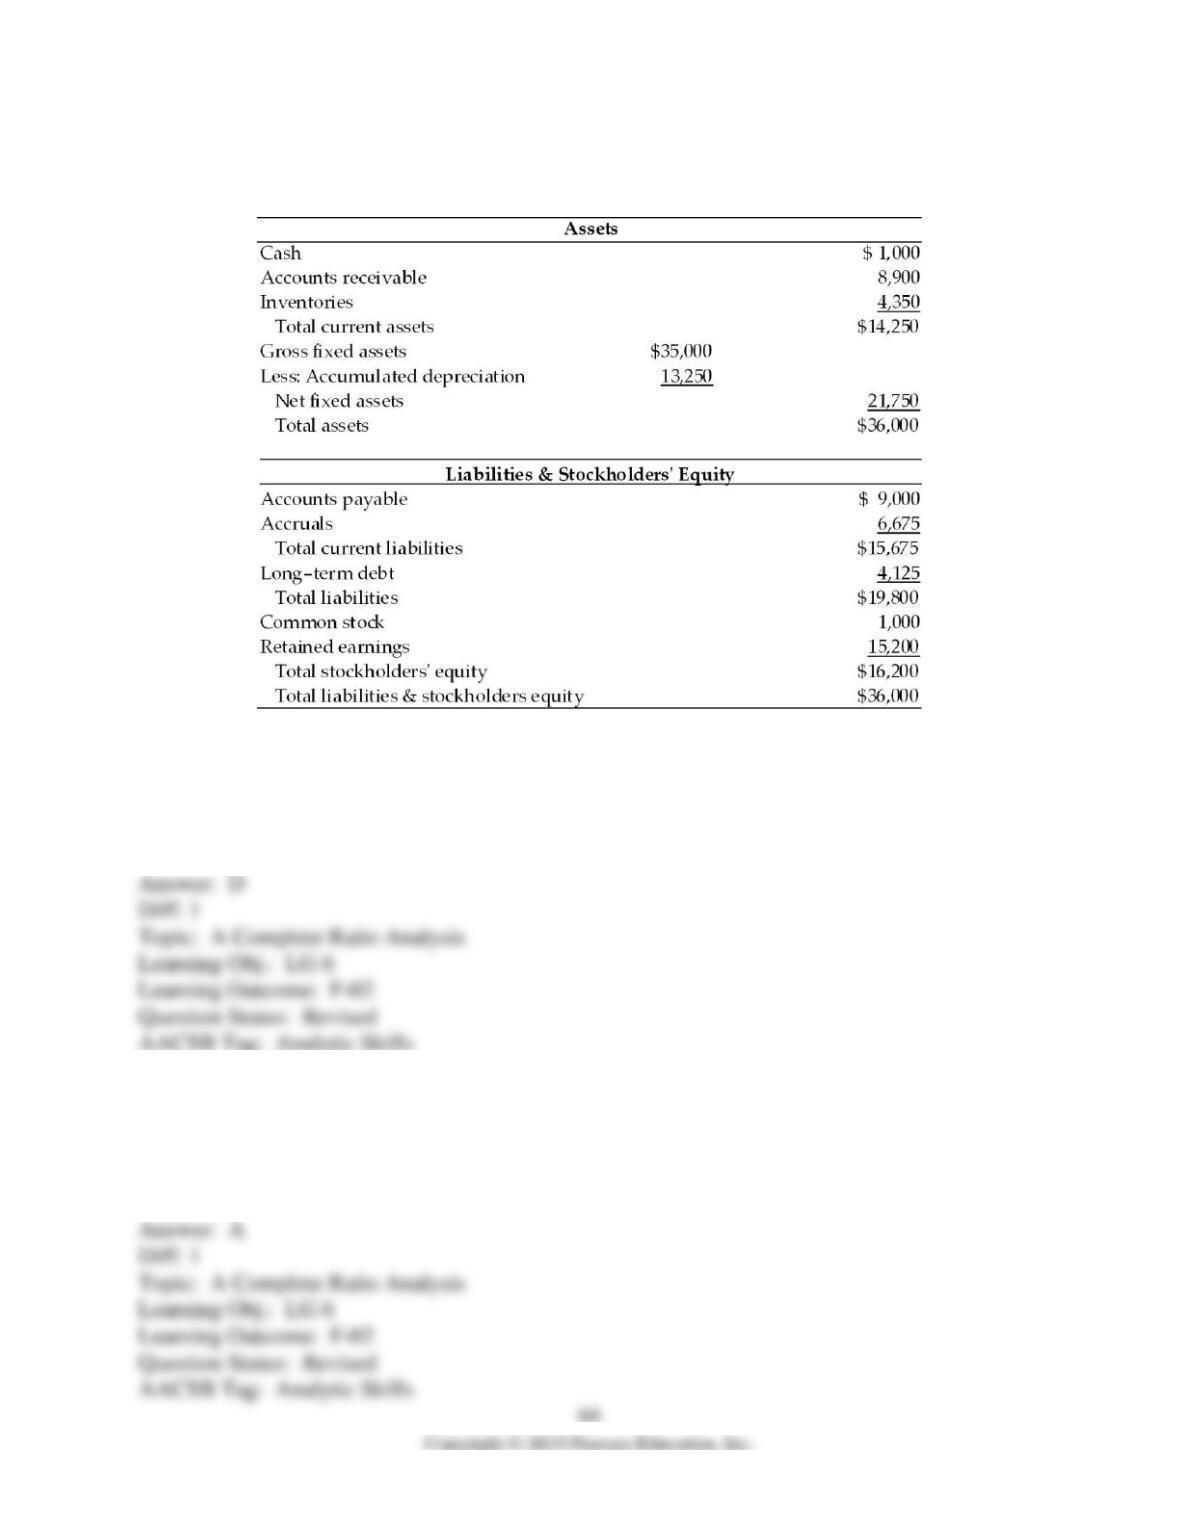
Balance Sheet
Dana Dairy Products
December 31, 2013
16) The current ratio for Dana Dairy Products in 2013 was ________. (See Table 3.2)
A) 1.58
B) 0.63
C) 1.10
D) 0.91
17) Since 2012, the liquidity of Dana Dairy Products ________. (See Table 3.2)
A) has deteriorated
B) has remained the same
C) has improved
D) is not determinable
18) The net working capital for Dana Dairy Products in 2013 was ________. (See Table 3.2)
A) $10,325
B) -$10,325
C) -$1,425
D) $14,250
19) The inventory turnover for Dana Dairy Products in 2013 was ________. (See Table 3.2)
A) 43
B) 5
C) 20
D) 25
20) The inventory management at Dana Dairy Products ________ since 2012. (See Table 3.2)
A) has deteriorated
B) has remained the same
C) has improved slightly
D) cannot be determined
21) The average collection period for Dana Dairy Products in 2013 was ________. (See Table
3.2)
A) 32.5 days.
B) 11.8 days.
C) 25.3 days.
D) 35.9 days.
22) If Dana Dairy Products has credit terms which specify that accounts receivable should be
paid in 25 days, the average collection period ________ since 2012. (See Table 3.2)
A) has deteriorated
B) has remained the same
C) has improved
D) cannot be determined
23) Dana Dairy Products had a ________ degree of financial leverage than the industry standard,
resulting in ________. (See Table 3.2)
A) lower; lower return on total assets
B) lower; lower return on equity
C) higher; higher return on equity
D) higher; higher return on total assets
24) The debt ratio for Dana Dairy Products in 2013 was ________.(See Table 3.2)
A) 50 percent
B) 11 percent
C) 55 percent
D) 44 percent
25) Dana Dairy Products’ gross profit margin was inferior to the industry standard. This may
have resulted from ________. (See Table 3.2)
A) a high sales price
B) the high cost of goods sold
C) excessive selling and administrative expenses
D) excessive interest expense
26) The gross profit margin and net profit margin for Dana Dairy Products in 2013 were
________. (See Table 3.2)
A) 13 percent and 0.9 percent, respectively
B) 13 percent and 1.5 percent, respectively
C) 2 percent and 0.9 percent, respectively
D) 2 percent and 1.5 percent, respectively
27) The return on total assets for Dana Dairy Products for 2013 was ________. (See Table 3.2)
A) 0.9 percent
B) 5.5 percent
C) 25 percent
D) 2.5 percent
28) The return on equity for Dana Dairy Products for 2013 was ________. (See Table 3.2)
A) 0.6 percent
B) 5.6 percent
C) 0.9 percent
D) 50 percent
29) Using the modified DuPont formula allows the analyst to break Dana Dairy Products return
on equity into 3 components: the net profit margin, the total asset turnover, and a measure of
leverage (the financial leverage multiplier). Which of the following mathematical expressions
represents the modified DuPont formula relative to Dana Dairy Products’ 2013 performance?
(See Table 3.2)
A) 5.6(ROE) = 2.5(ROA) × 2.22(Financial leverage multiplier)
B) 5.6(ROE) = 3.3(ROA) × 1.70(Financial leverage multiplier)
C) 4.0(ROE) = 2.5(ROA) × 2.00(Financial leverage multiplier)
D) 2.5(ROE) = 5.6(ROA) × 2.22(Financial leverage multiplier)
30) As the financial leverage multiplier increases, this may result in ________.
A) an increase in the net profit margin and return on investment, due to the decrease in interest
expense as debt decreases
B) an increase in the net profit margin and return on investment, due to the increase in interest
expense as debt increases
C) a decrease in the net profit margin and return on investment, due to the increase in interest
expense as debt increases
D) a decrease in the net profit margin and return on investment, due to the decrease in interest
expense as debt decreases
31) In an effort to analyze Clockwork Company finances, Jim realized that he was missing the
company’s net profits after taxes for the current year. Find the company’s net profits after taxes
using the following information.
Return on total assets = 2%
Total asset turnover = 0.5
Cost of goods sold = $105,000
Gross profit margin = 0.30
70
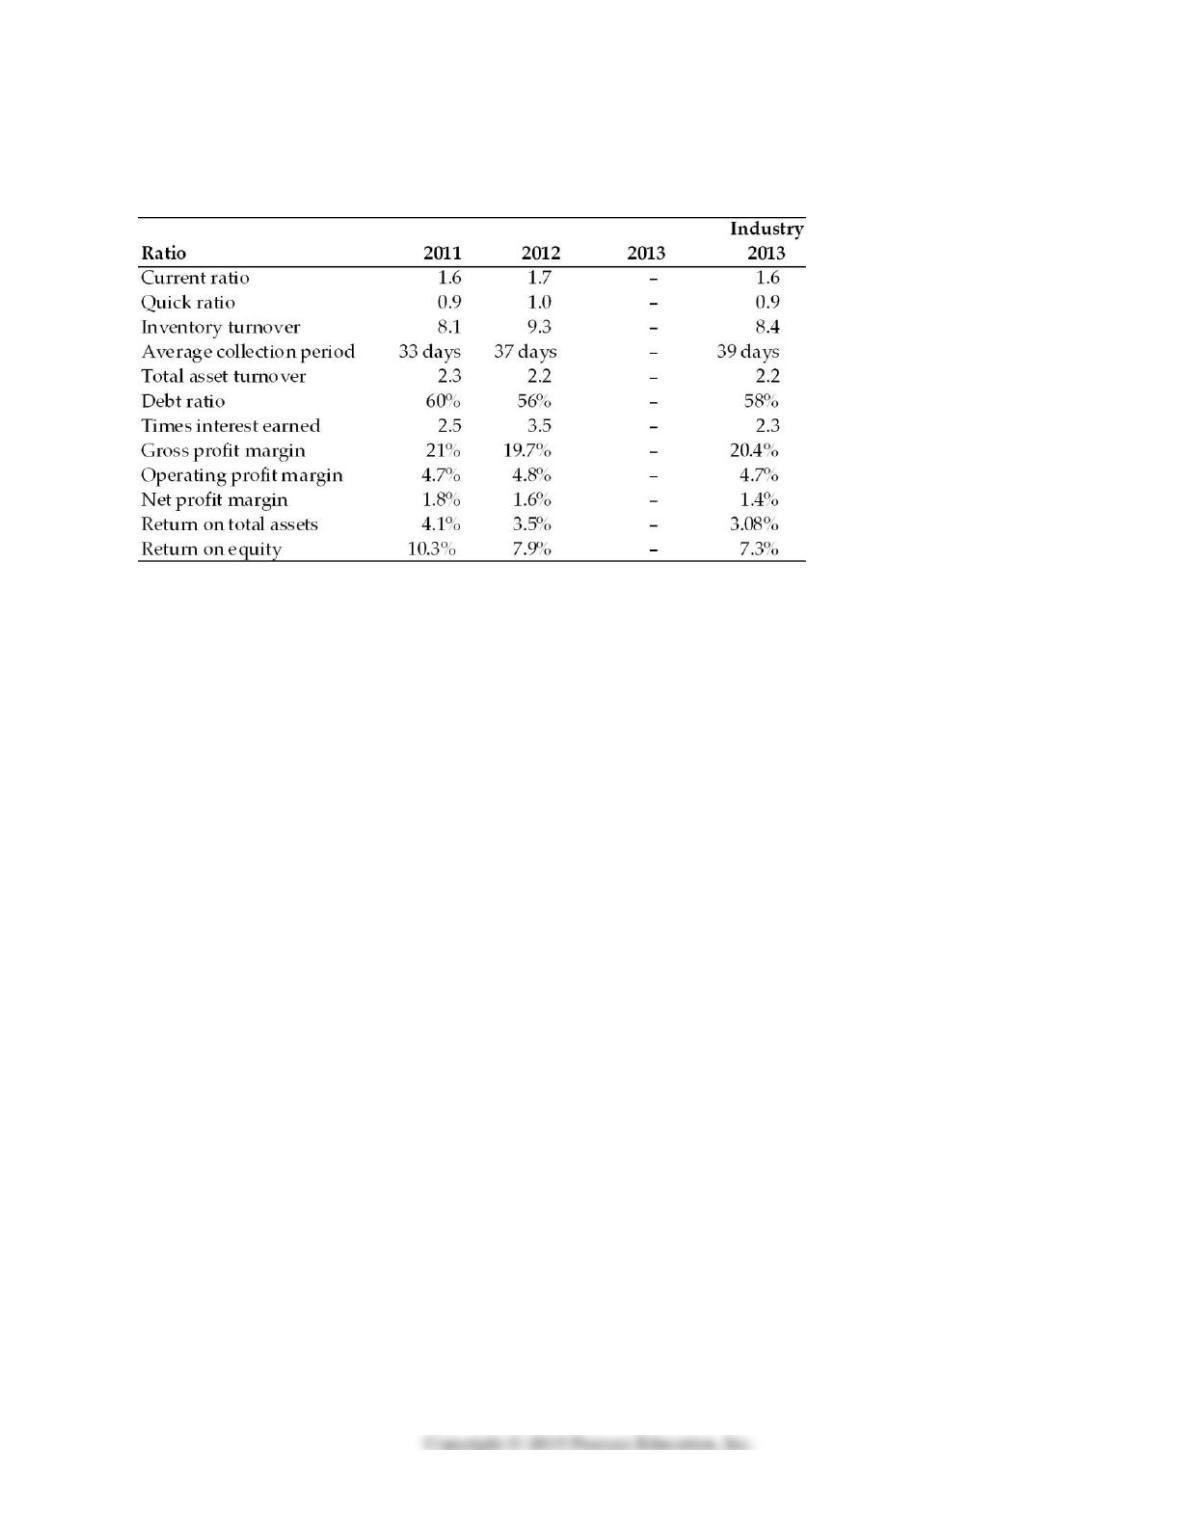
32) Given the following balance sheet, income statement, historical ratios and industry averages,
calculate the Pulp, Paper, and Paperboard, Inc. financial ratios for the most recent year. Analyze
its overall financial situation for the most recent year. Analyze its overall financial situation from
both a cross-sectional and time-series viewpoint. Break your analysis into an evaluation of the
firm’s liquidity, activity, debt, and profitability.
Income Statement
Pulp, Paper, and Paperboard, Inc.
For the Year Ended December 31, 2013
Balance Sheet
Pulp, Paper, and Paperboard, Inc.
December 31, 2013
71
Historical and Industry Average Ratios
Pulp, Paper and Paperboard, Inc.
73
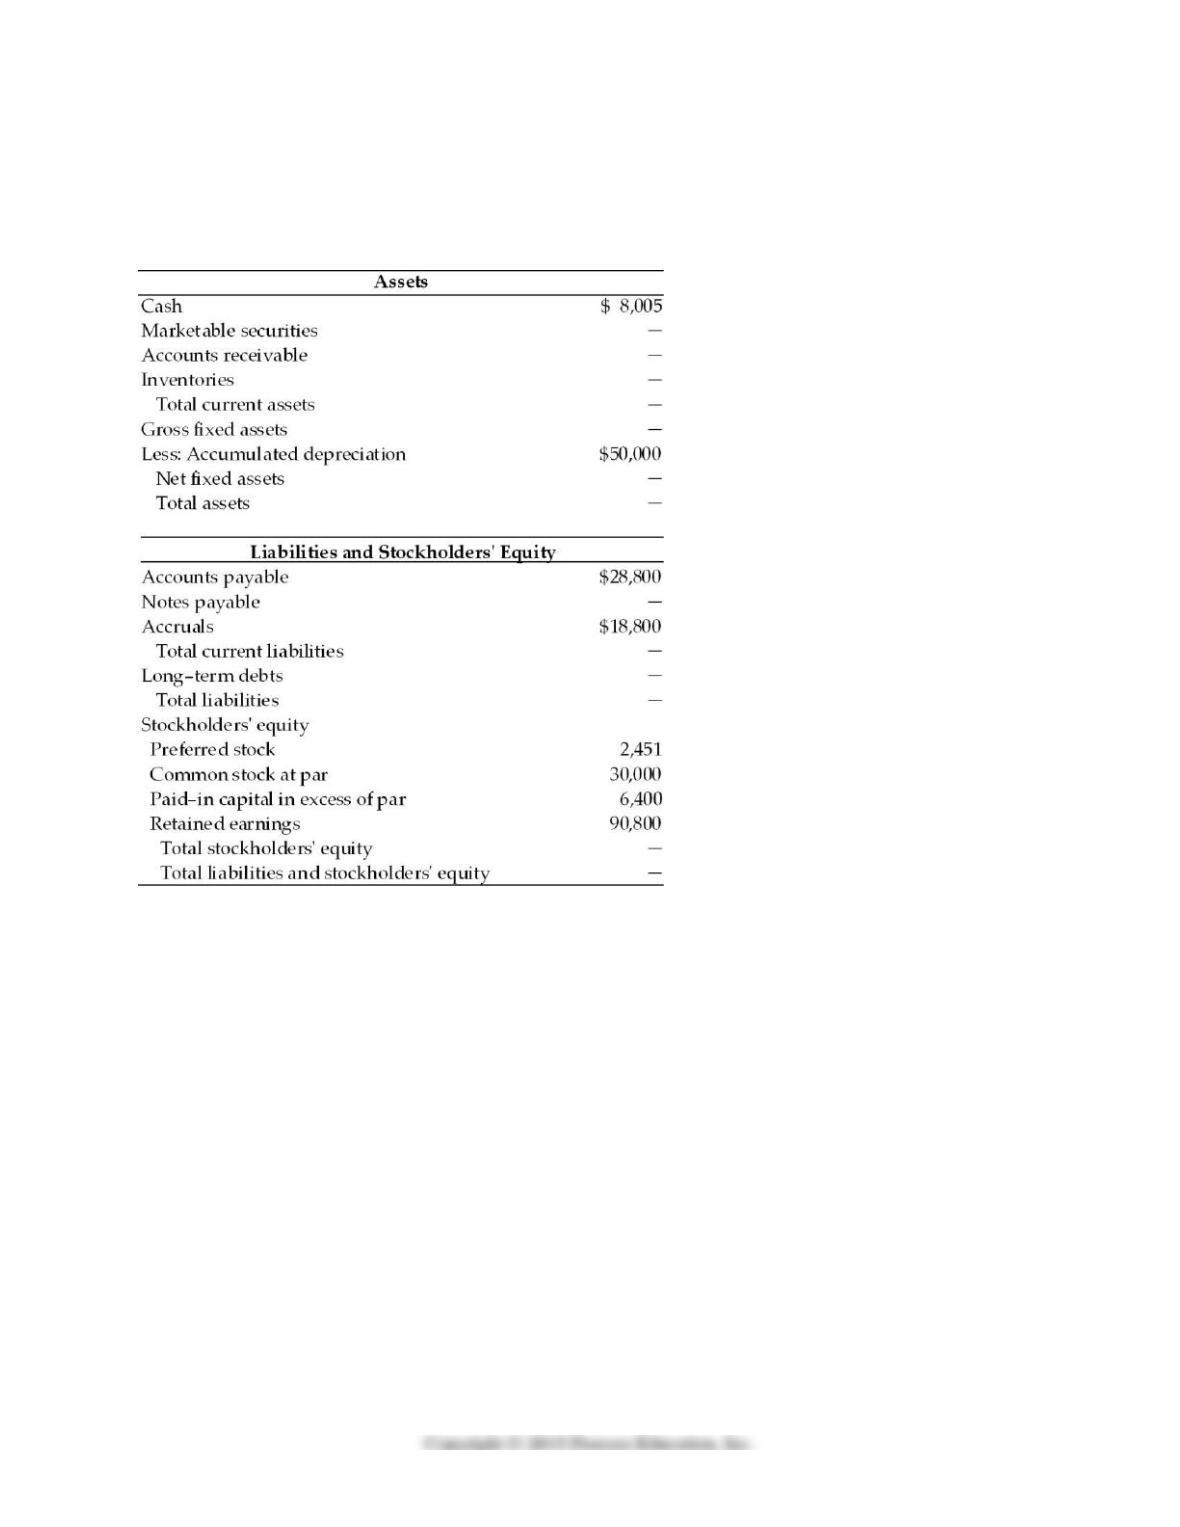
33) Complete the balance sheet for General Aviation, Inc. based on the following financial data.
Balance Sheet
General Aviation, Inc.
December 31, 2013
Key Financial Data (2005)
1. Sales totaled $720,000.
2. The gross profit margin was 38.7 percent.
3. Inventory turned 6 times.
4. There are 360 days in a year.
5. The average collection period was 31 days.
6. The current ratio was 2.35.
7. The total asset turnover was 2.81.
8. The debt ratio was 49.4 percent.
9. Total current assets equal $159,565.
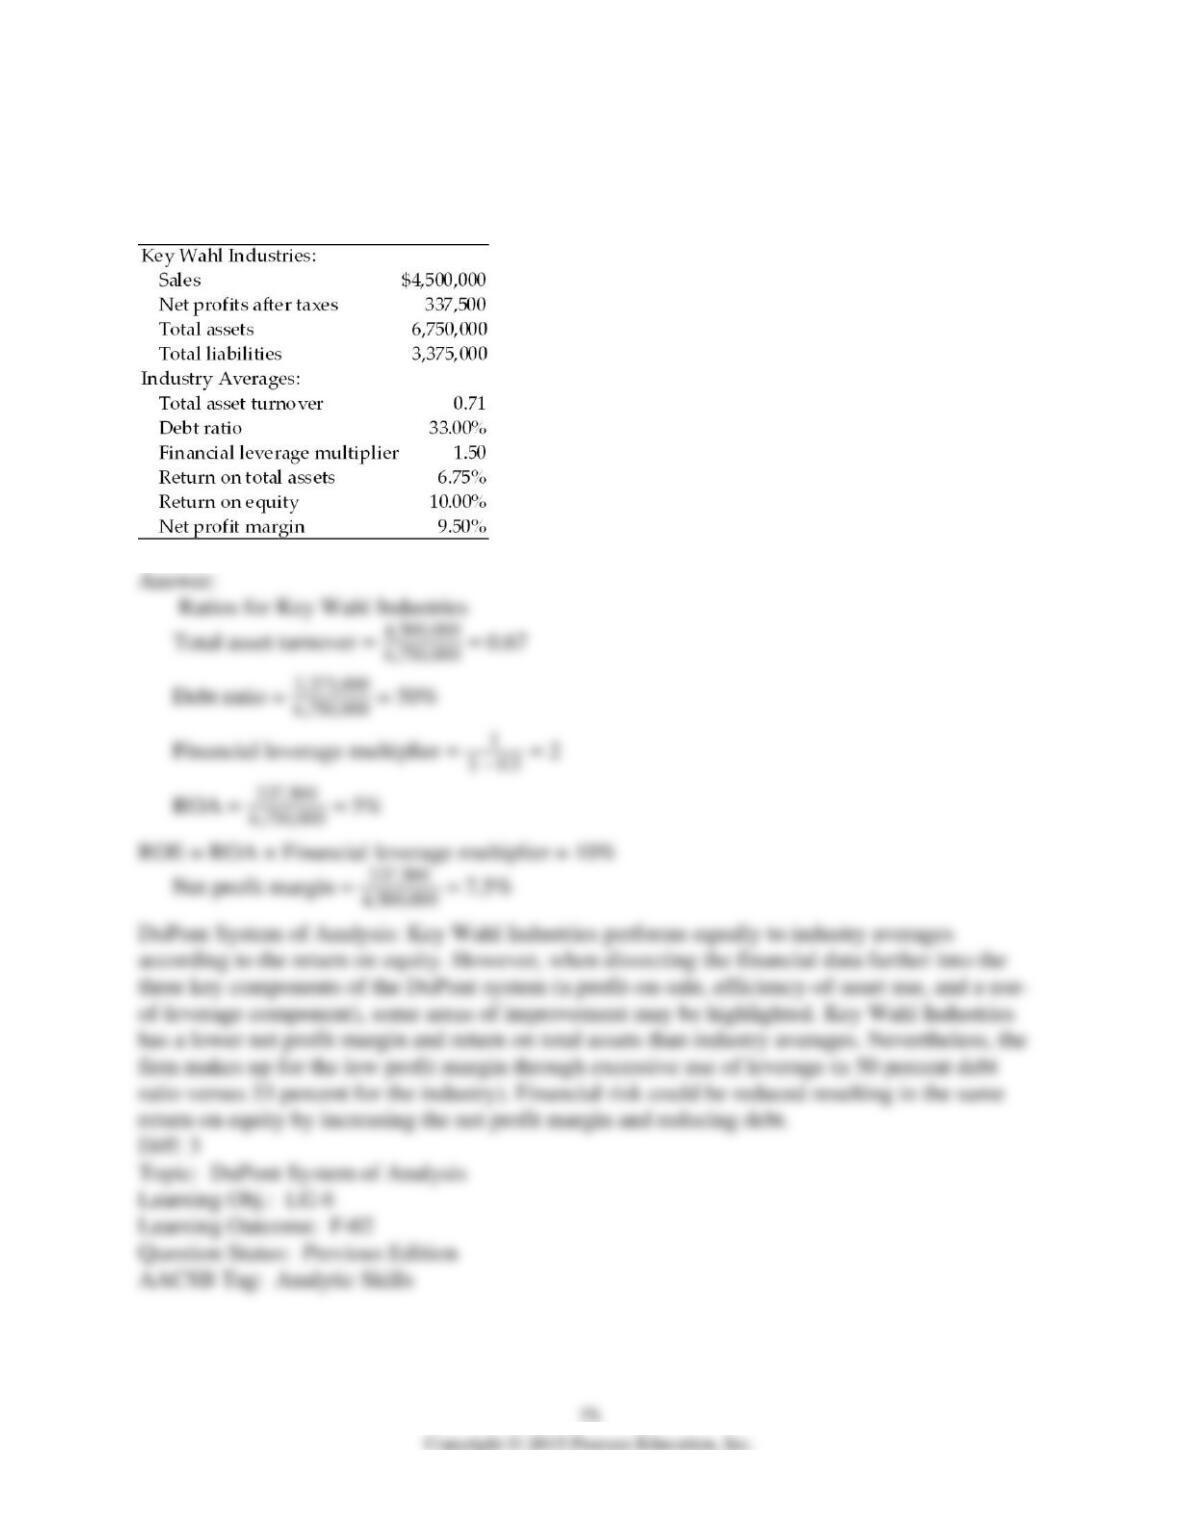
34) Construct the DuPont system of analysis using the following financial data for Key Wahl
Industries and determine which areas of the firm need further analysis.
Key Financial Data