Unlock document.
This document is partially blurred.
Unlock all pages and 1 million more documents.
Get Access
Ch 25 Portfolio Theory and Asset Pricing Models
22. Suppose that (1) investors expect a 4.0% rate of inflation in the future, (2) the real risk-free rate is 3.0%, (3) the
market risk premium is 5.0%, (4) Talcott Inc.'s beta is 1.00, and (5) its realized rate of return has averaged 15.0% over the
last 5 years. Calculate the required rate of return for Talcot Inc.
a.
10.29%
b.
10.83%
c.
11.40%
d.
12.00%
e.
12.60%
23. A stock you are holding has a beta of 2.0 and the stock is currently in equilibrium. The required rate of return on the
stock is 15% versus a required return on an average stock of 10%. Now the required return on an average stock increases
by 30.0% (not percentage points). The risk-free rate is unchanged. By what percentage (not percentage points) would the
required return on your stock increase as a result of this event?
a.
36.10%
b.
38.00%
c.
40.00%
d.
42.00%
e.
44.10%
Ch 25 Portfolio Theory and Asset Pricing Models
24. Calculate the required rate of return for the Wagner Assets Management Group, which holds 4 stocks. The market's
required rate of return is 15.0%, the risk-free rate is 7.0%, and the Fund's assets are as follows:
Stock
Investment
Beta
A
$ 200,000
1.50
B
300,000
−0.50
C
500,000
1.25
D
1,000,000
0.75
a.
10.67%
b.
11.23%
c.
11.82%
d.
12.45%
e.
13.10%
rM:
15.0%
Ch 25 Portfolio Theory and Asset Pricing Models
25. Consider the information below for Postman Builders Inc. Suppose that the expected inflation rate and thus the
inflation premium increase by 2.0 percentage points, and Postman acquires risky assets that increase its beta by the
indicated percentage. What is the firm's new required rate of return?
Beta:
1.50
Required return (rs)
10.20%
RPM:
6.00%
Percentage increase in beta:
20%
a.
14.00%
b.
14.70%
c.
15.44%
d.
16.21%
e.
17.02%
Ch 25 Portfolio Theory and Asset Pricing Models
26. Assume that the market is in equilibrium and that stock betas can be estimated with historical data. The returns on the
market, the returns on United Fund (UF), the risk-free rate, and the required return on the United Fund are shown below.
Based on this information, what is the required return on the market, rM?
Year
Market
UF
2011
−9%
−14%
2012
11%
16%
2013
15%
22%
2014
5%
7%
2015
−1%
−2%
rRF: 7.00%;
rUnited: 15.00%
a.
10.57%
b.
11.13%
c.
11.72%
d.
12.33%
e.
12.95%
Ch 25 Portfolio Theory and Asset Pricing Models
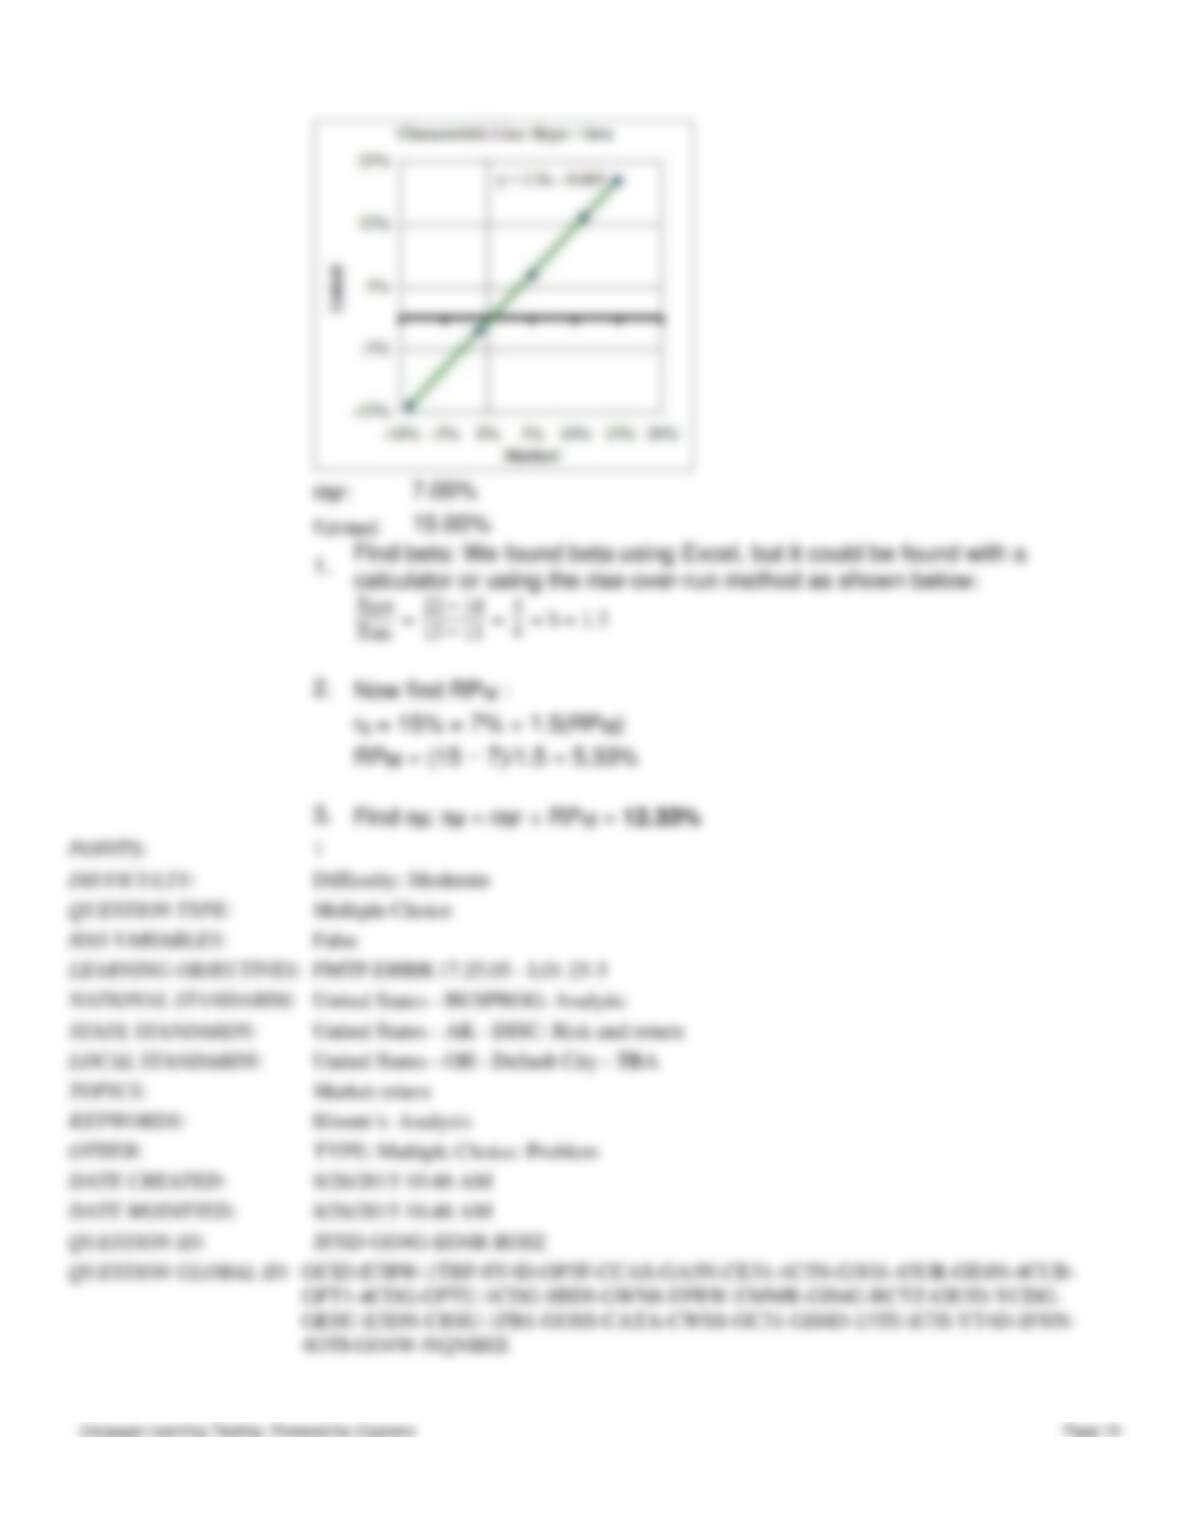
27. You are given the following returns on "the market" and Stock F during the last three years. We could calculate beta
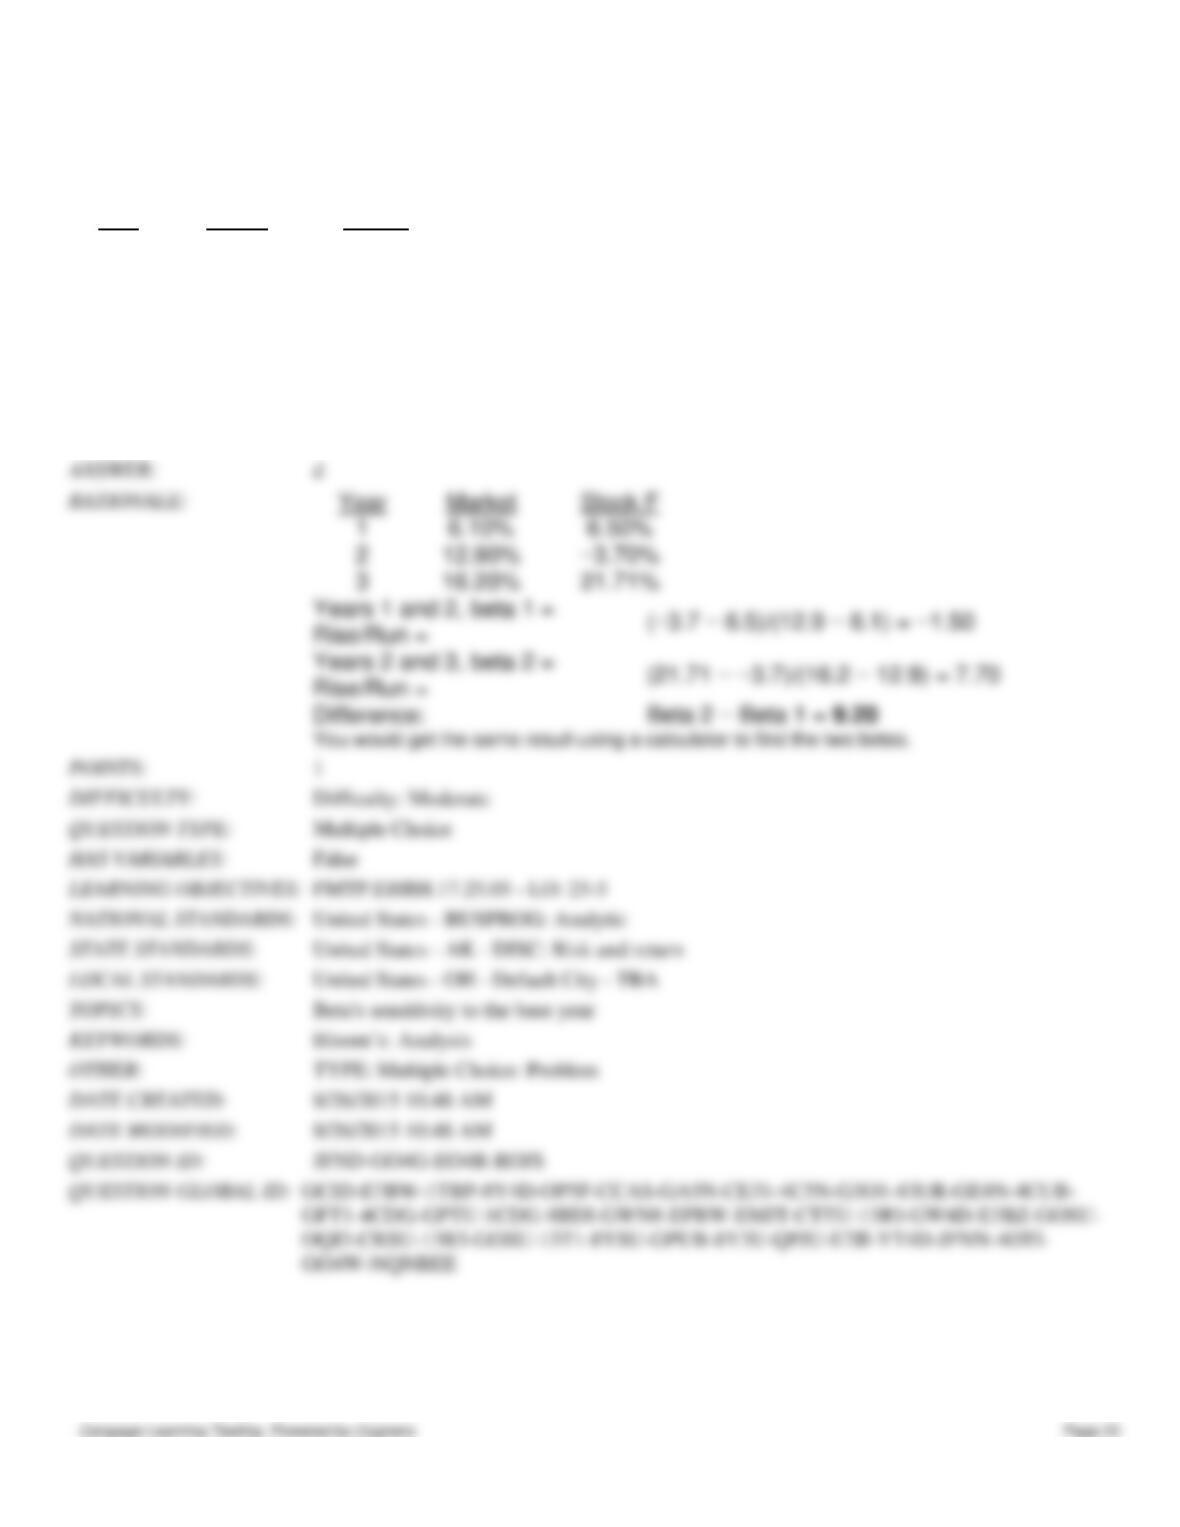
Ch 25 Portfolio Theory and Asset Pricing Models
using data for Years 1 and 2 and then, after Year 3, calculate a new beta for Years 2 and 3. How different are those two
betas, i.e., what's the value of beta 2 − beta 1? (Hint: You can find betas using the Rise-Over-Run method, or using your
calculator's regression function.)
Year
Market
Stock F
1
6.10%
6.50%
2
12.90%
−3.70%
3
16.20%
21.71%
a.
7.89
b.
8.30
c.
8.74
d.
9.20
e.
9.66
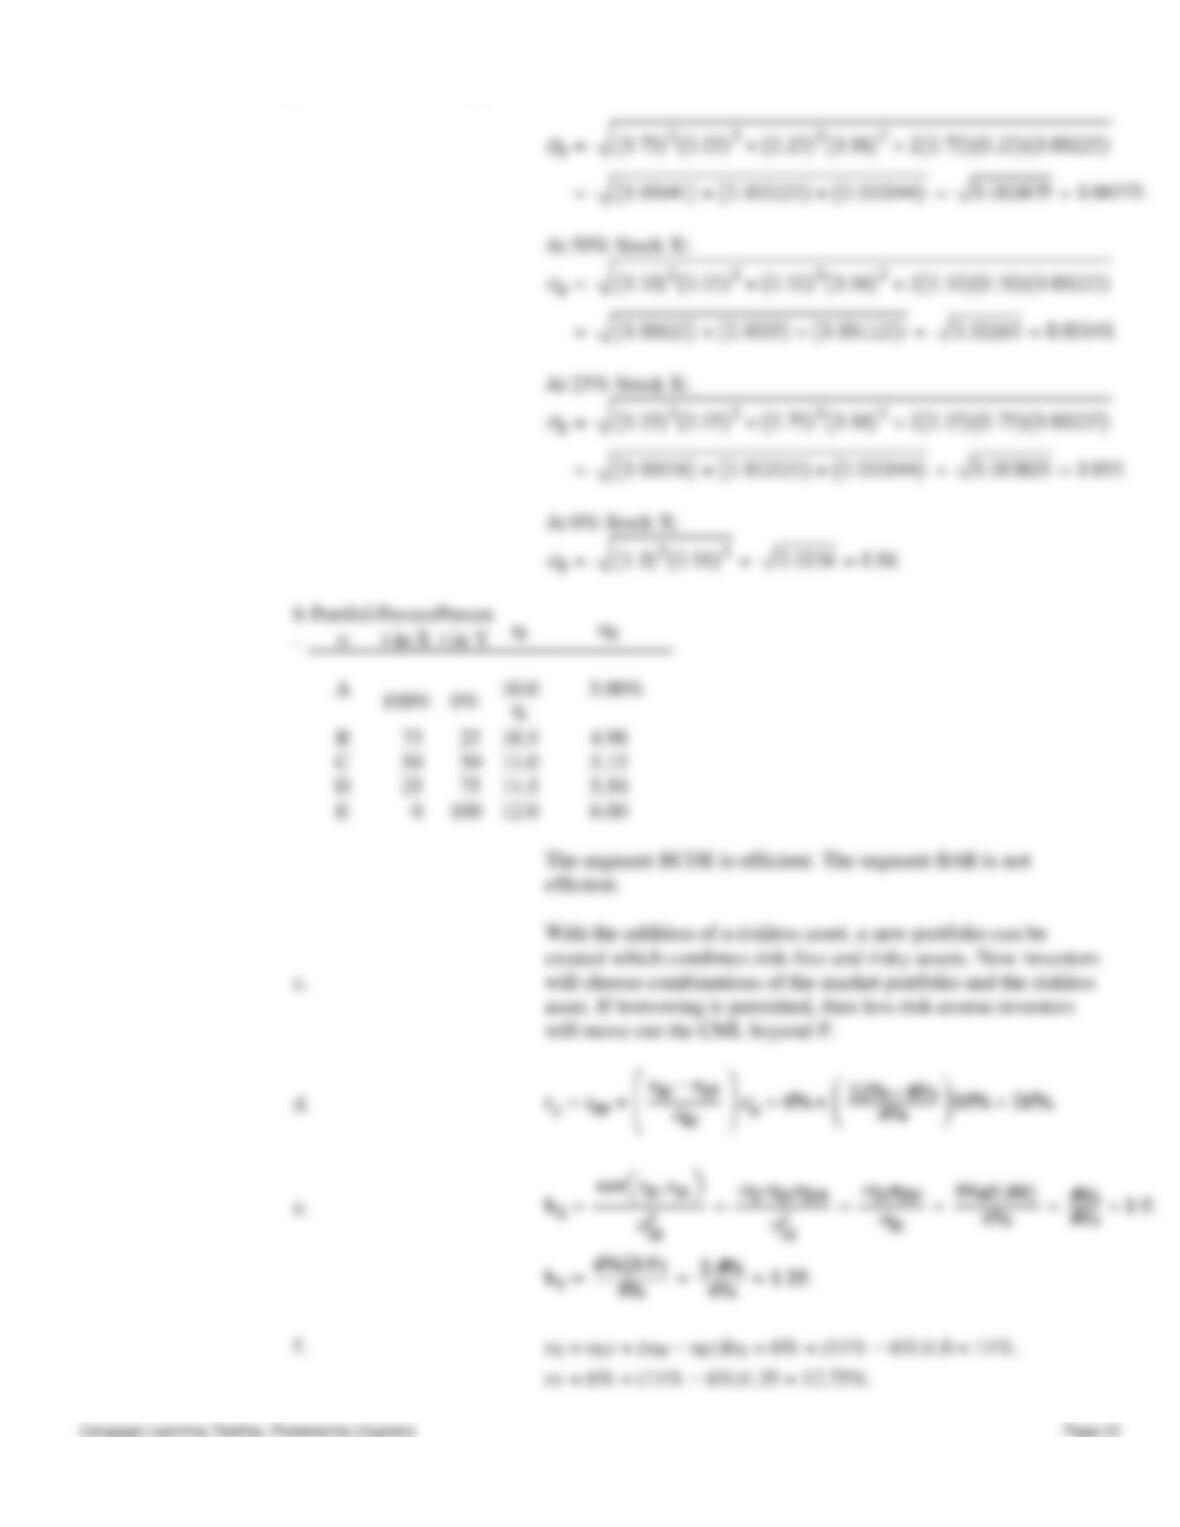
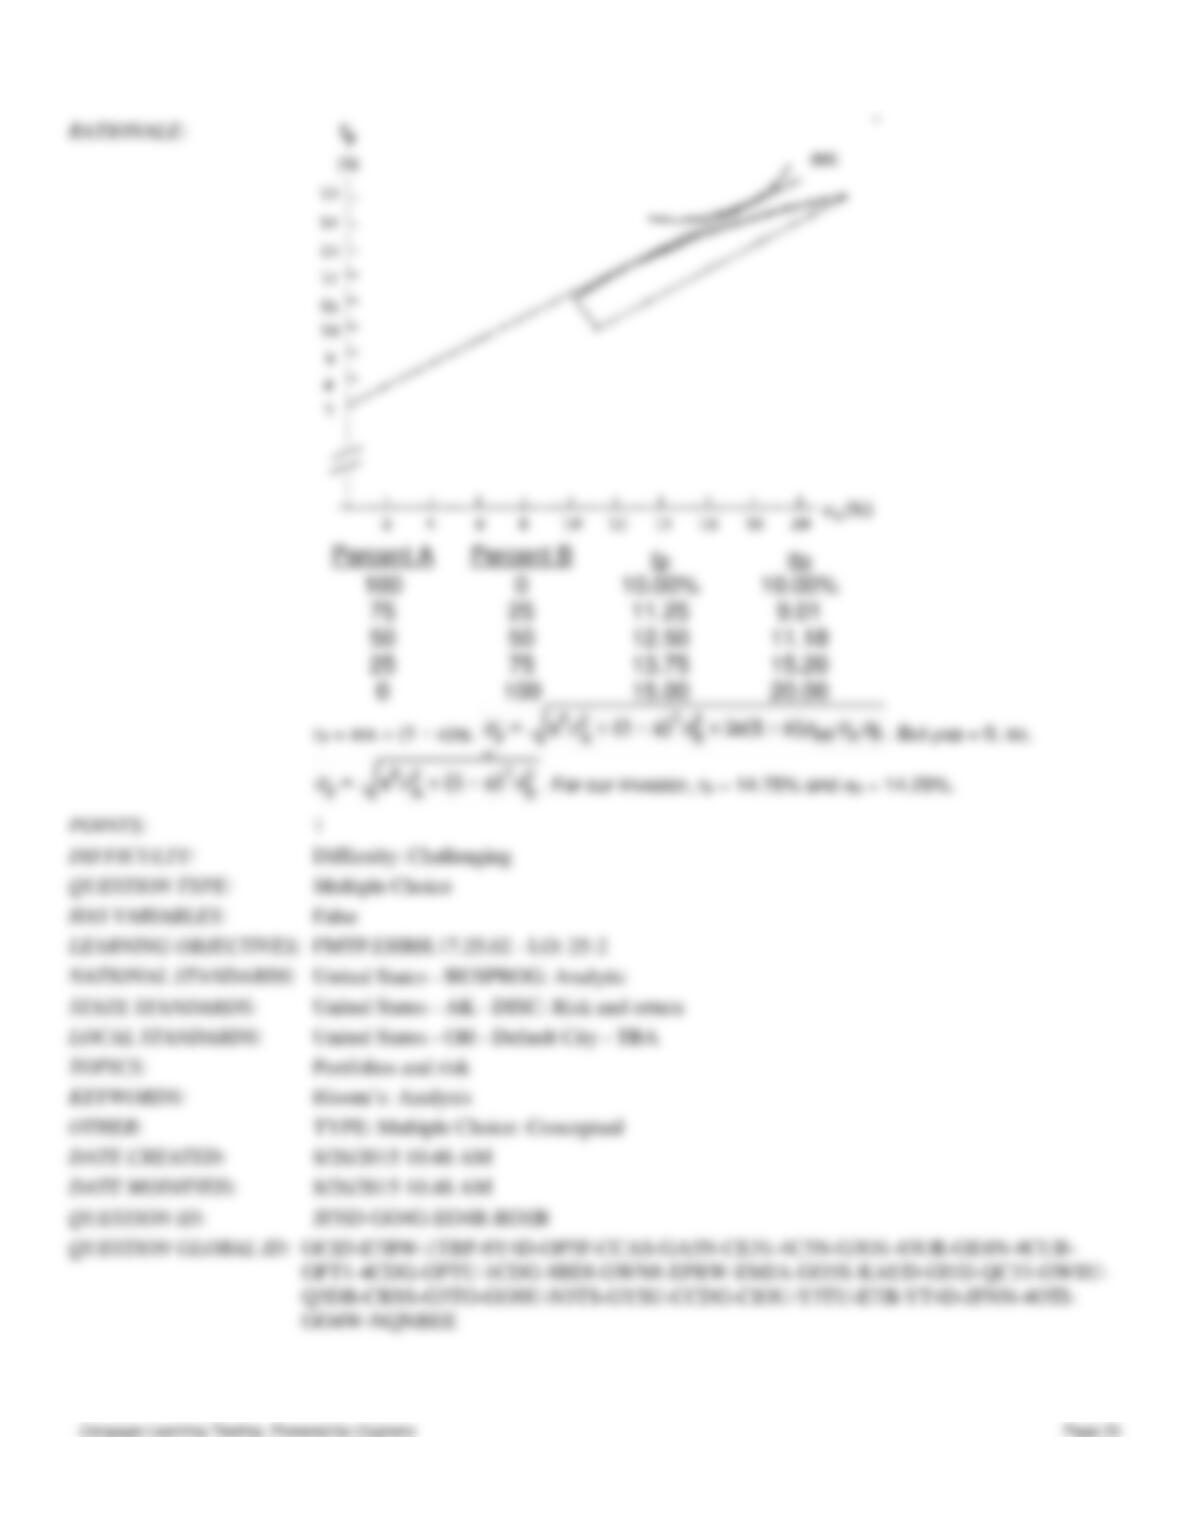
28. You plan to invest in Stock X, Stock Y, or some combination of the two. The expected return for X is 10% and σX =
5%. The expected return for Y is 12% and σY = 6%. The correlation coefficient, rXY, is 0.75.
a.
Calculate rp and σp for 100%, 75%, 50%, 25%, and 0% in Stock X.
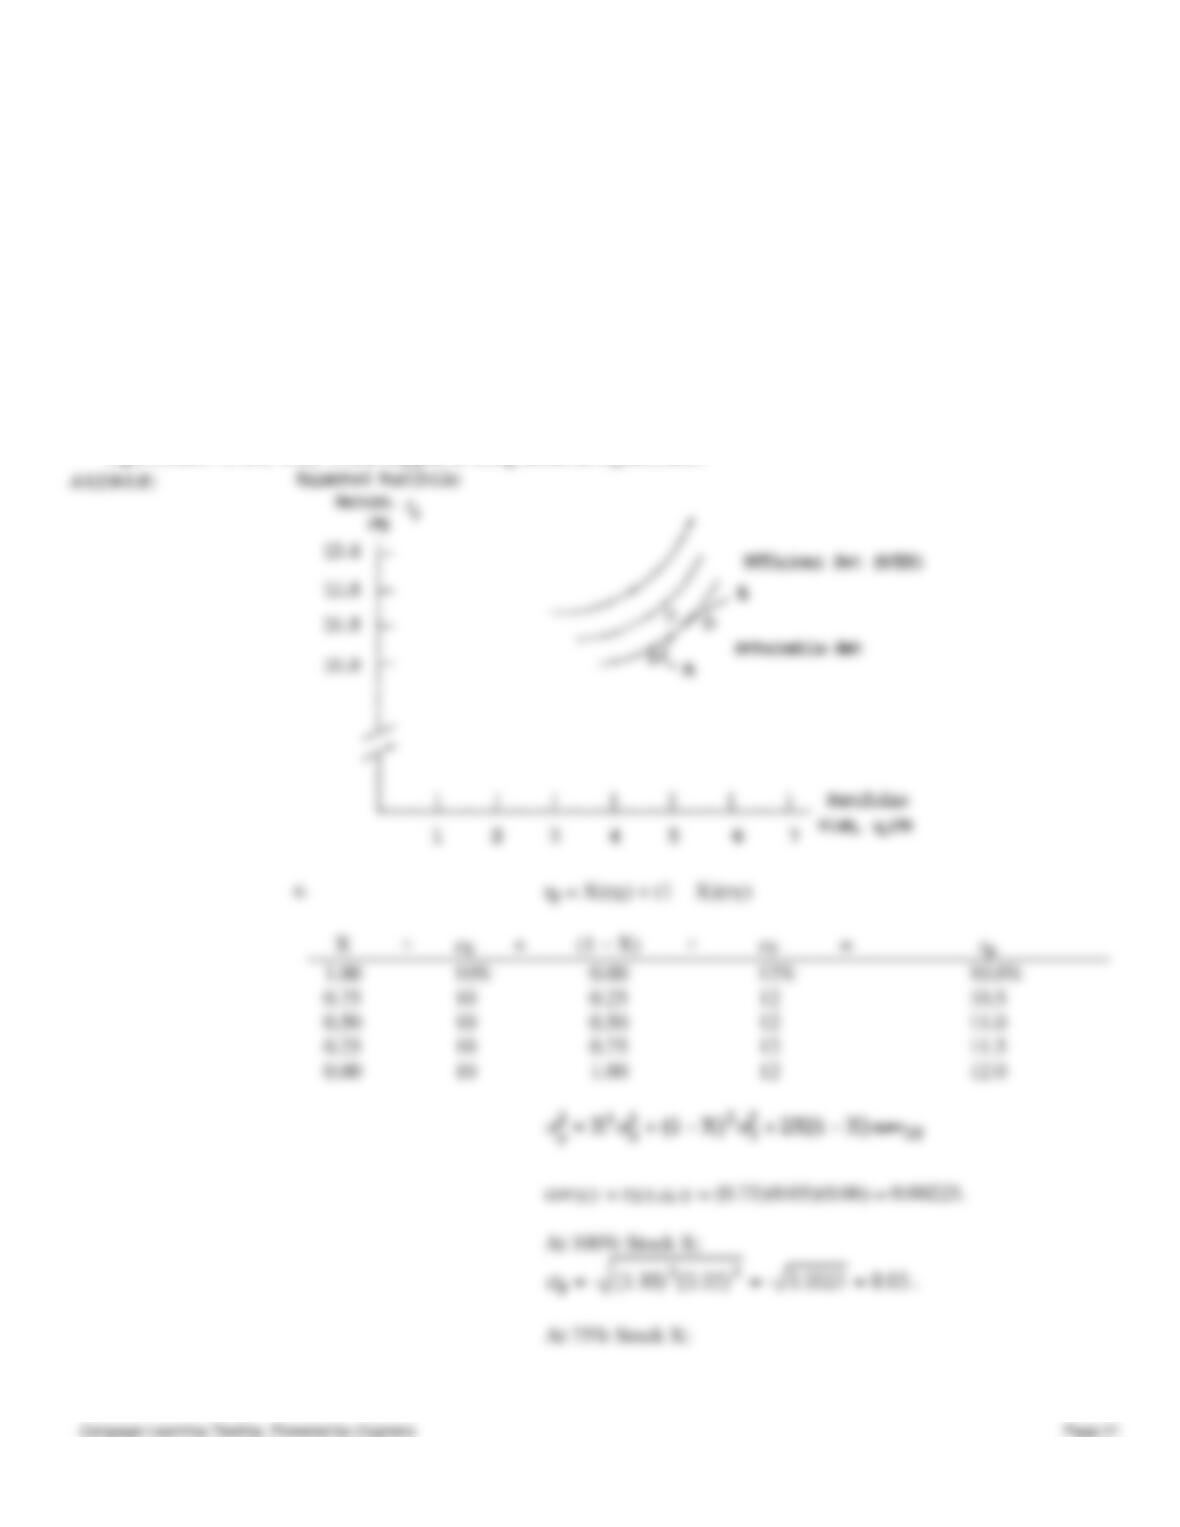
Ch 25 Portfolio Theory and Asset Pricing Models
b.
Use the values you calculated for rp and σp to graph the attainable set of portfolios. Which
part of the attainable set is efficient? Also, draw in a set of hypothetical indifference curves
to show how an investor might select a portfolio comprised of Stocks X and Y. Let an
indifference curve be tangent to the efficient set at the point where rp = 11%.
c.
Now suppose we add a riskless asset to the investment possibilities. What effects will this
have on the construction of portfolios?
d.
Suppose rM = 12%, σM = 4%, and rRF = 6%. What would be the required and expected
return on a portfolio with σP = 10%?
e.
Suppose the correlation of Stock X with the market, rXM, is 0.8, while rYM = 0.9. Use this
information, along with data given previously, to determine Stock X's and Stock Y's beta
coefficients.
f.
What is the required rate of return on Stocks X and Y? Do these stocks appear to be in
equilibrium? If not, what would happen to bring about an equilibrium?
Ch 25 Portfolio Theory and Asset Pricing Models
Ch 25 Portfolio Theory and Asset Pricing Models
29. If investors are risk averse and hold only one stock, we can conclude that the required rate of return on a stock whose
standard deviation is 0.21 will be greater than the required return on a stock whose standard deviation is 0.10. However, if
stocks are held in portfolios, it is possible that the required return could be higher on the low standard deviation stock.
a.
True
b.
False
Ch 25 Portfolio Theory and Asset Pricing Models
30. For markets to be in equilibrium (that is, for there to be no strong pressure for prices to depart from their current
levels),
a.
The past realized rate of return must be equal to the expected rate of return; that is, .
b.
The required rate of return must equal the realized rate of return; that is, r = .
c.
All companies must pay dividends.
d.
No companies can be in danger of declaring bankruptcy.
e.
The expected rate of return must be equal to the required rate of return; that is, = r.
31. Assume an economy in which there are three securities: Stock A with rA = 10% and σA = 10%; Stock B with rB =
15% and σB = 20%; and a riskless asset with rRF = 7%. Stocks A and B are uncorrelated (rAB = 0). Which of the
following statements is most CORRECT?
a.
The expected return on the investor's portfolio will probably have an expected return that is somewhat below
10% and a standard deviation (SD) of approximately 10%.
b.
The expected return on the investor's portfolio will probably have an expected return that is somewhat below
15% and a standard deviation (SD) that is between 10% and 20%.
c.
The investor's risk/return indifference curve will be tangent to the CML at a point where the expected return is
in the range of 7% to 10%.
d.
Since the two stocks have a zero correlation coefficient, the investor can form a riskless portfolio whose
expected return is in the range of 10% to 15%.
e.
The expected return on the investor's portfolio will probably have an expected return that is somewhat above
15% and a standard deviation (SD) of approximately 20%.
Ch 25 Portfolio Theory and Asset Pricing Models
32. Security A has an expected return of 12.4% with a standard deviation of 15%, and a correlation with the market of
0.85. Security B has an expected return of −0.73% with a standard deviation of 20%, and a correlation with the market of
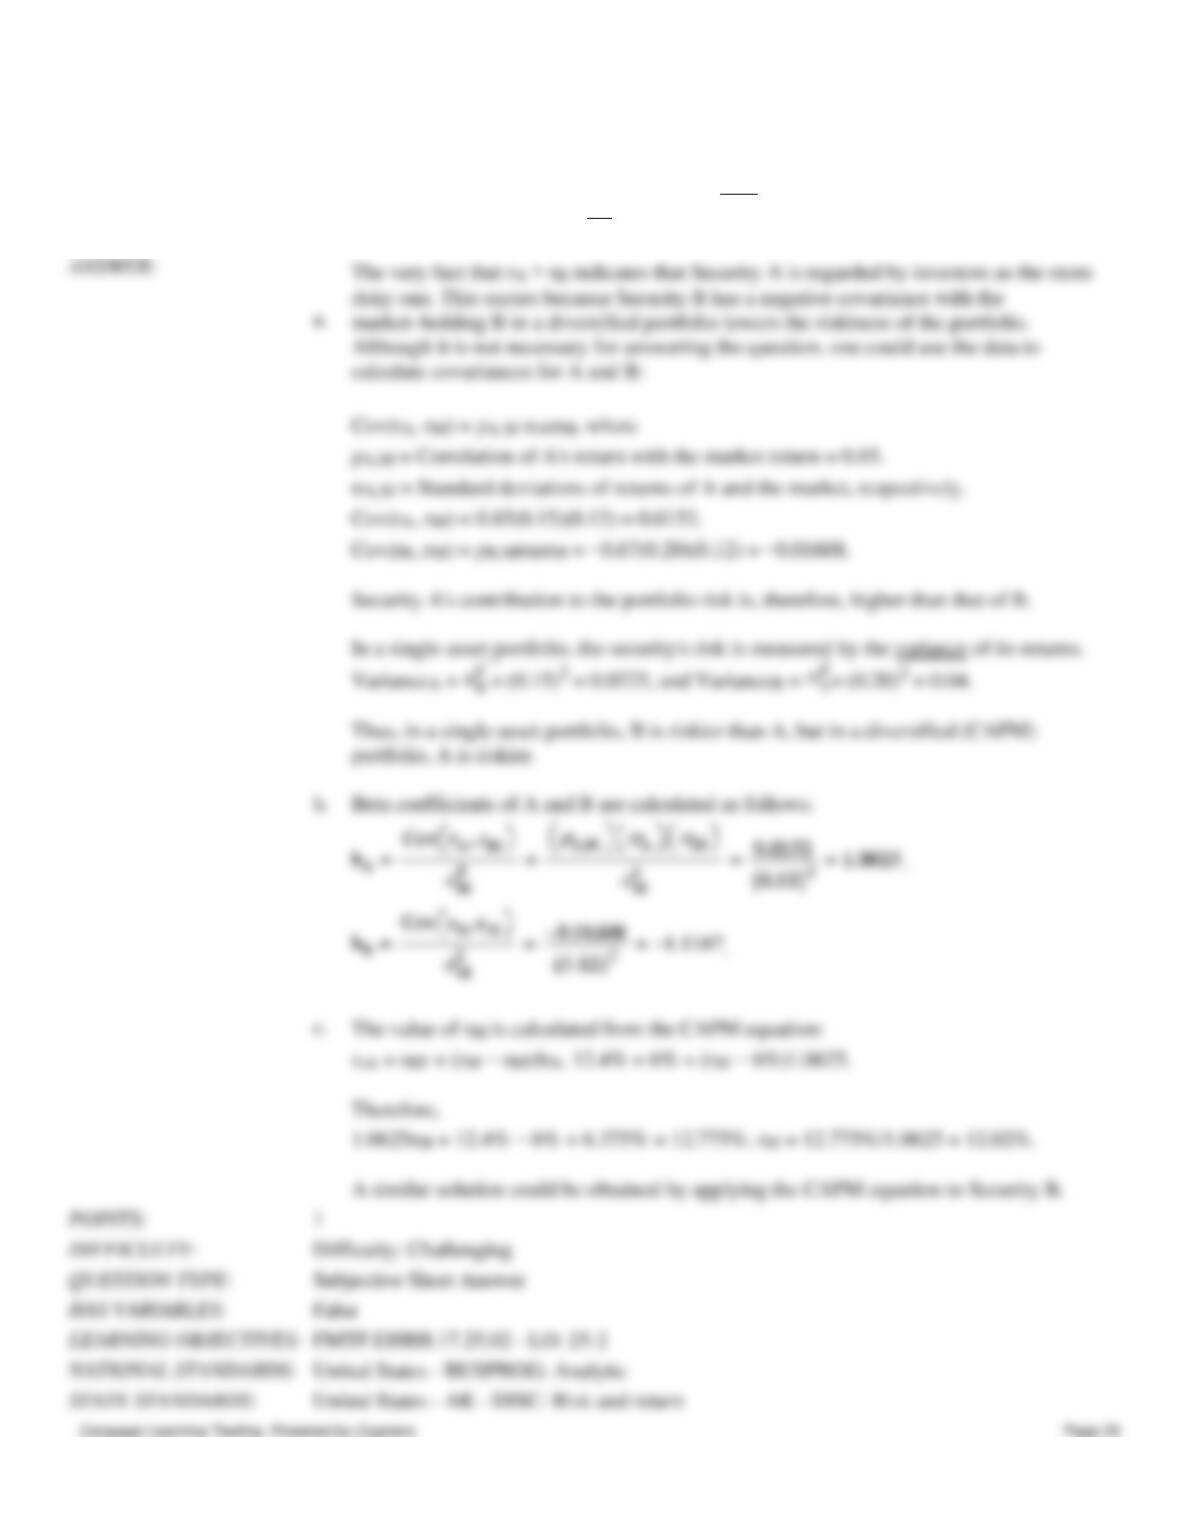
Ch 25 Portfolio Theory and Asset Pricing Models
−0.67. The standard deviation of rM is 12%.
a.
To someone who acts in accordance with the CAPM, which security is more risky, A or B?
Why? (Hint: No calculations are necessary to answer this question; it is easy.)
b.
What are the beta coefficients of A and B? Calculations are necessary.
c.
If the risk-free rate is 6%, what is the value of rM?
Ch 25 Portfolio Theory and Asset Pricing Models
33. The CAPM is a multi-period model which takes account of differences in securities' maturities, and it can be used to
determine the required rate of return for any given level of systematic risk.
a.
True
b.
False
34. Arbitrage pricing theory is based on the premise that more than one factor affects stock returns, and the factors are
specified to be (1) market returns, (2) dividend yields, and (3) changes in inflation.
a.
True
b.
False
Ch 25 Portfolio Theory and Asset Pricing Models
35. Which of the following statements is CORRECT?
a.
Richard Roll has argued that it is possible to test the CAPM to see if it is correct.
b.
Tests have shown that the risk/return relationship appears to be linear, but the slope of the relationship is
greater than that predicted by the CAPM.
c.
Tests have shown that the betas of individual stocks are stable over time, but that the betas of large portfolios
are much less stable.
d.
The most widely cited study of the validity of the CAPM is one performed by Modigliani and Miller.
e.
Tests have shown that the betas of individual stocks are unstable over time, but that the betas of large
portfolios are reasonably stable over time.


