Test Bank for Accounting: Tools for Business Decision Making, Fifth Edition
FOR INSTRUCTOR USE ONLY
2-60
Solution 220 (25 min.)
Ex. 221
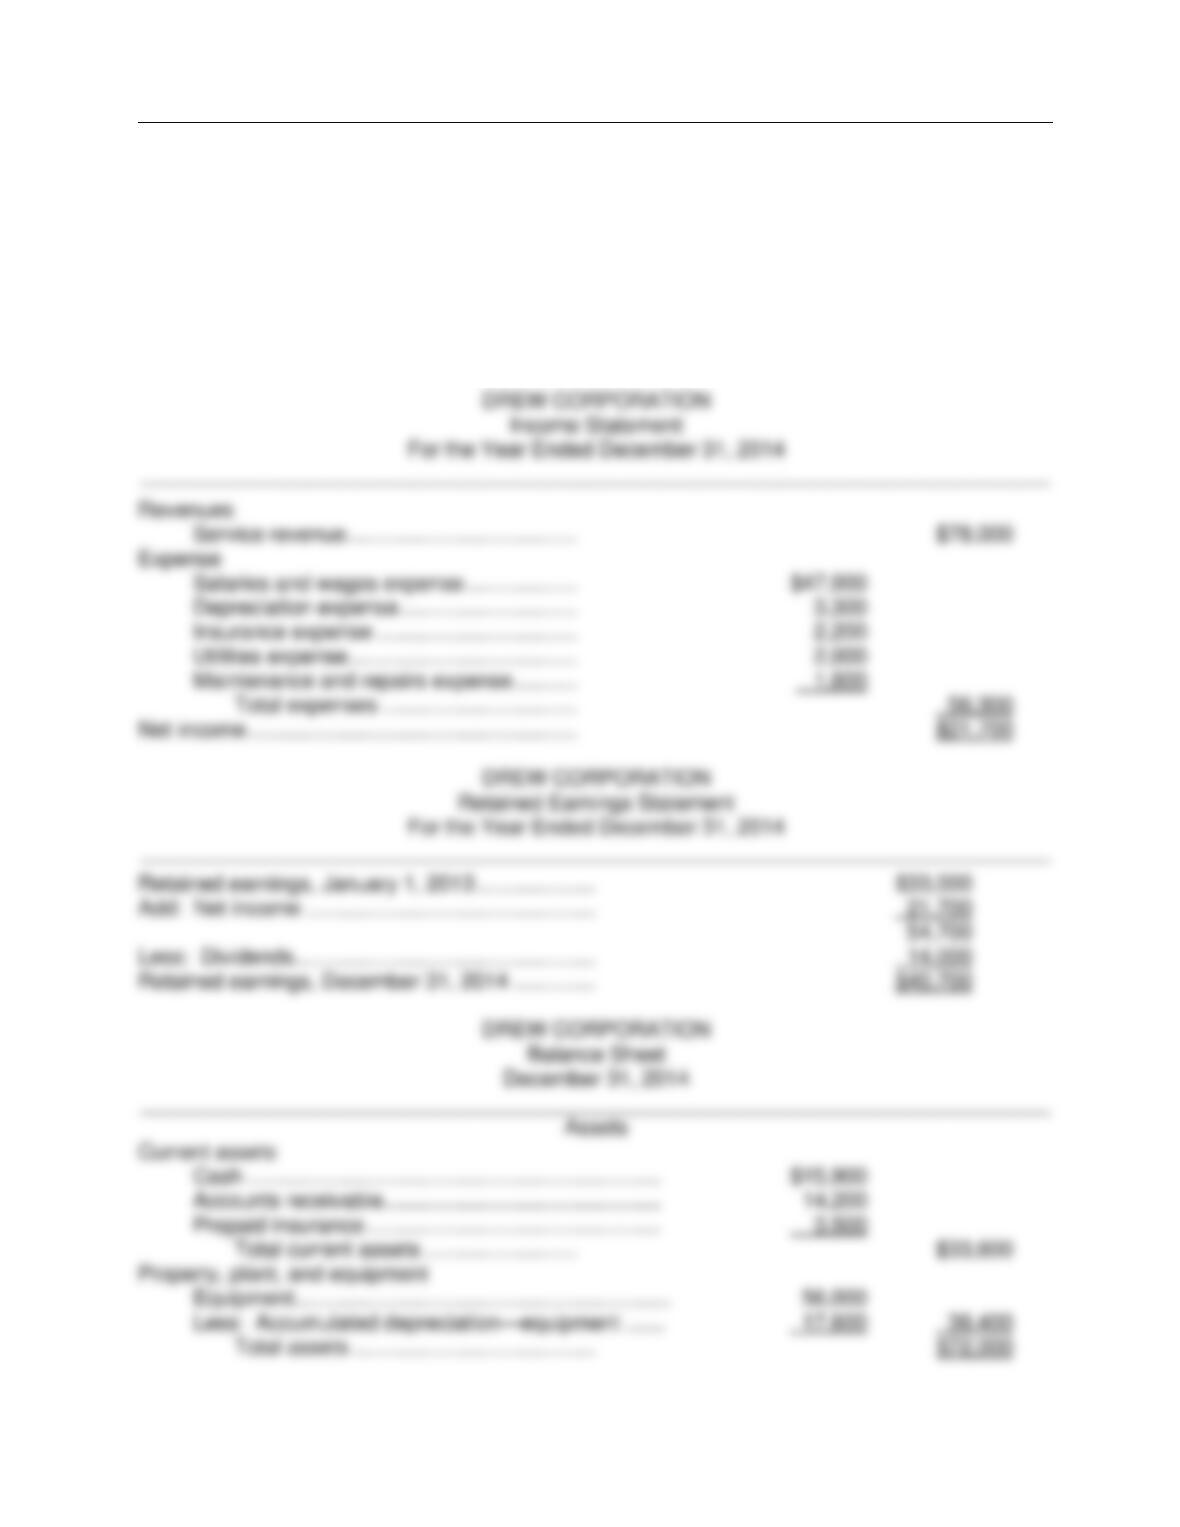
These items are taken from the financial statements of Drew Corporation for 2014.
Retained earnings (beginning of year) $33,000
Utilities expense 2,000
Equipment 56,000
Accounts payable 15,300
Cash 15,900
Salaries and wages payable 3,000
Common stock 13,000
Dividends 14,000
Service revenue 78,000
Prepaid insurance 3,500
Maintenance and repairs expense 1,800
Depreciation expense 3,300
Accounts receivable 14,200
Insurance expense 2,200
Salaries and wages expense 47,000
Accumulated depreciation—equipment 17,600
A Further Look at Financial Statements
FOR INSTRUCTOR USE ONLY
2-61
Ex. 221 (Cont.)
Instructions
Prepare an income statement and a retained earnings statement for the year ended December 31,
2014 and a classified balance sheet as of December 31, 2014.
Ans: N/A, LO: 1, 3, Bloom: AP, Difficulty: Medium, Min: 25, AACSB: Analytic, AICPA BB: Legal/Regulatory Perspective, AICPA FN: Reporting, AICPA
PC: Problem Solving, IMA: Reporting
Solution 221 (25 min.)
Test Bank for Accounting: Tools for Business Decision Making, Fifth Edition
FOR INSTRUCTOR USE ONLY
2-62
Solution 221 (Cont.)
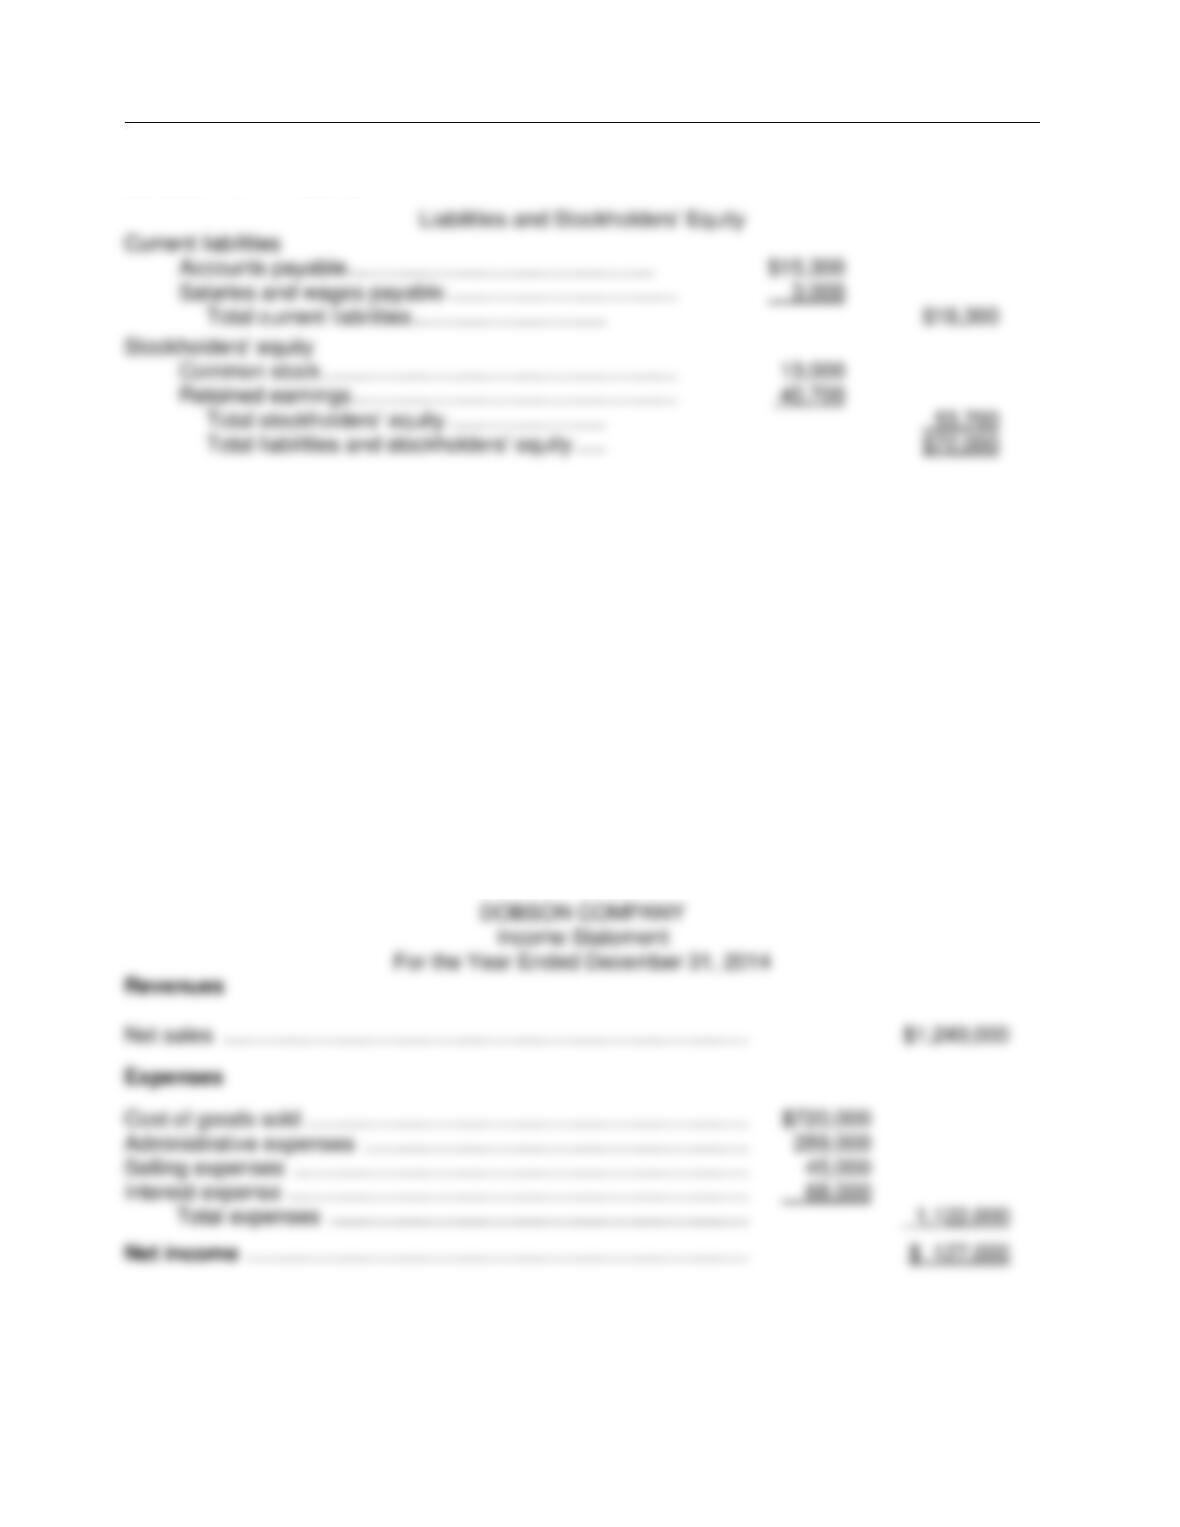
Ex. 222
The Dobson Company gathered the following condensed data for the year ended December 31,
2014:
Cost of goods sold $ 720,000
Net sales 1,249,000
Administrative expenses 289,000
Interest expense 68,000
Dividends paid 38,000
Selling expenses 45,000
Instructions
Prepare an income statement for the year ended December 31, 2014.
Ans: N/A, LO: 2, Bloom: AP, Difficulty: Medium, Min: 10, AACSB: Analytic, AICPA BB: Legal/Regulatory Perspective, AICPA FN: Reporting, AICPA PC:
Problem Solving, IMA: Reporting
Solution 222 (10 min.)
A Further Look at Financial Statements
FOR INSTRUCTOR USE ONLY
2-63
Ex. 223
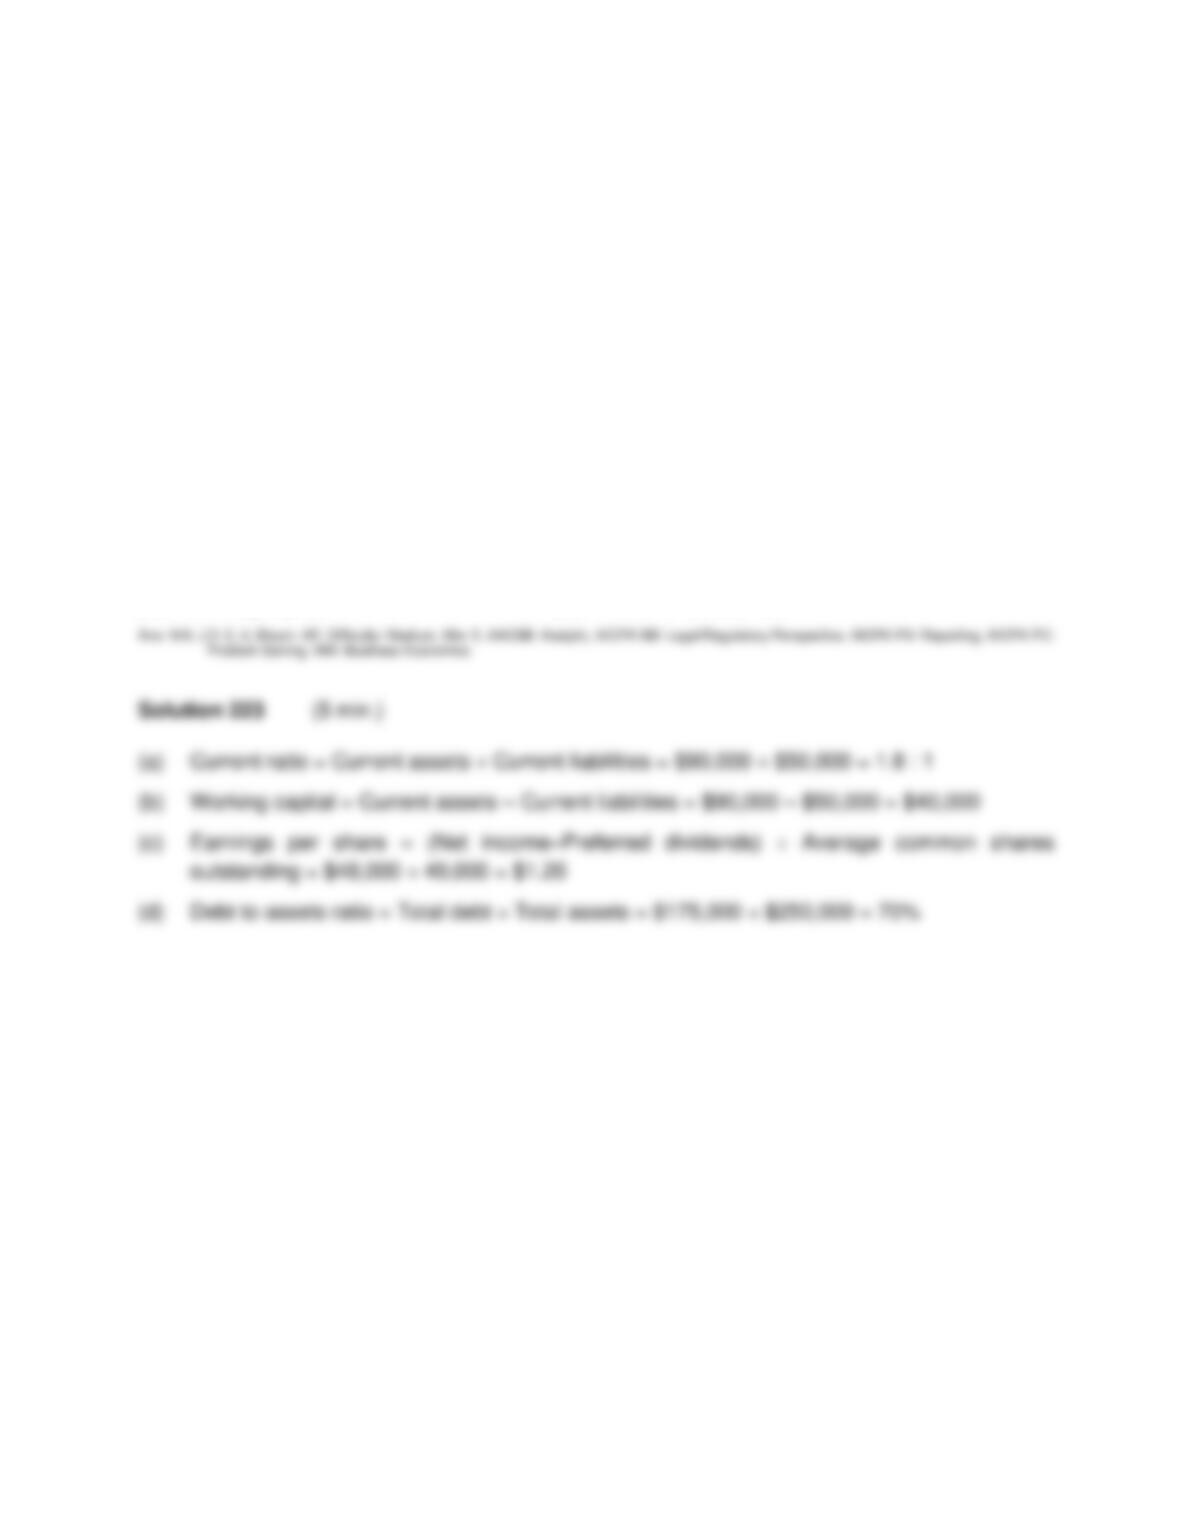
The following data are taken from the financial statements of Rosen, Inc. as of the end of the year
2014. The data are in alphabetical order.
Accounts payable $ 28,000 Net income $ 48,000
Accounts receivable 66,000 Other current liabilities 17,000
Cash 24,000 Salaries and wages payable 5,000
Gross profit 160,000 Total assets 250,000
Income before income taxes 54,000 Total liabilities 175,000
Additional information: The average common shares outstanding during the year was 40,000.
Instructions
Compute the following:
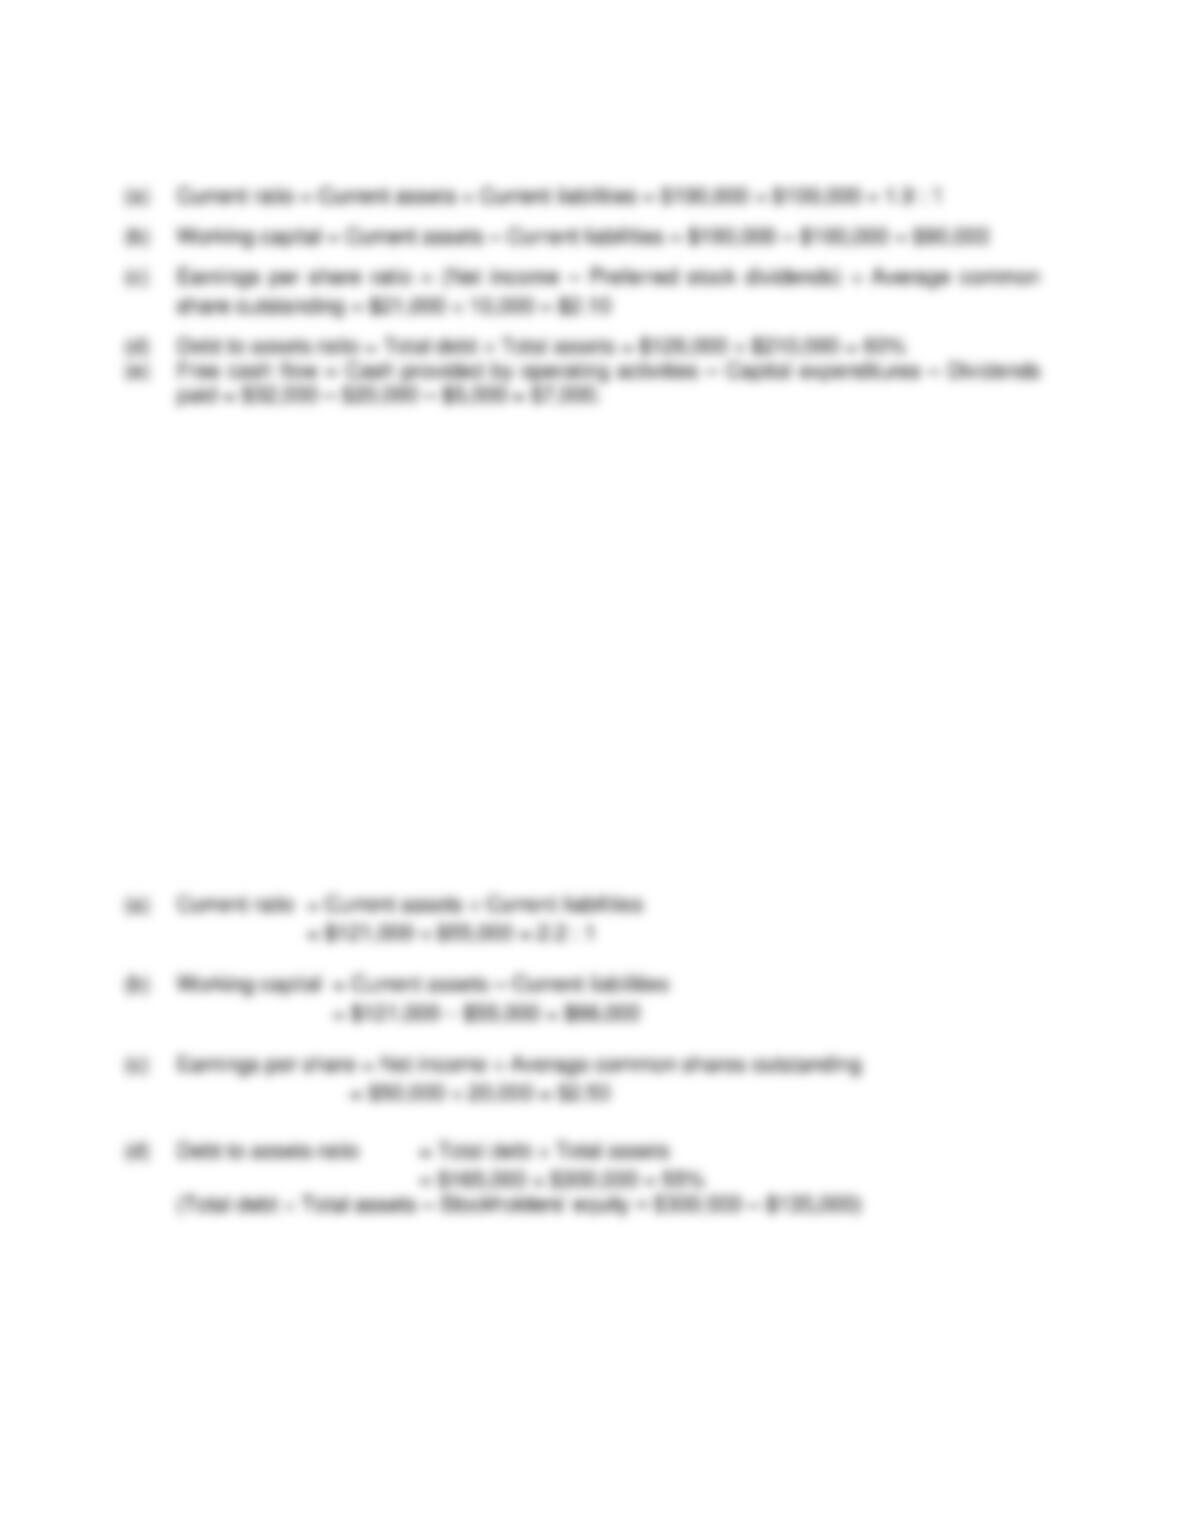
(a) Current ratio. (c) Earnings per share.
(b) Working capital. (d) Debts to assets ratio.
Ex. 224
Use the following data to calculate the liquidity and profitability ratios listed below.
Average common shares outstanding 10,000 Current liabilities $100,000
Capital expenditures $20,000 Net income 21,000
Cash provided by operating activities 32,000 Net sales 150,000
Dividends paid 5,000 Total liabilities 126,000
Current assets 190,000 Total assets 210,000
Instructions
Compute the following:
(a) Current ratio. (d) Debt to assets ratio.
(b) Working capital. (e) Free cash flow.
(c) Earnings per share.
Ans: N/A, LO: 2, 4, 5 Bloom: AP, Difficulty: Medium, Min: 15, AACSB: Analytic, AICPA BB: Legal/Regulatory Perspective, AICPA FN: Reporting, AICPA
PC: Problem Solving, IMA: Business Economics
Test Bank for Accounting: Tools for Business Decision Making, Fifth Edition
FOR INSTRUCTOR USE ONLY
2-64
Solution 224 (15 min.)
Ex. 225
The following data are taken from the financial statements of Edington Company. The data
are in alphabetical order.
Accounts payable $ 28,000 Net sales 500,000
Accounts receivable 65,000 Other current liabilities 20,000
Average common shares out. 20,000 Salaries and wages payable 7,000
Cash 56,000 Stockholders’ equity 135,000
Gross profit 190,000 Total assets 300,000
Net income 50,000
Instructions
Compute the following:
(a) Current ratio. (c) Earnings per share.
(b) Working capital. (d) Debt to assets ratio.
Ans: N/A, LO: 2, 4, Bloom: AP, Difficulty: Medium, Min: 10, AACSB: Analytic, AICPA BB: Legal/Regulatory Perspective, AICPA FN: Reporting, AICPA
PC: Problem Solving, IMA: Business Economics
Solution 225 (10 min.)
A Further Look at Financial Statements
FOR INSTRUCTOR USE ONLY
2-65
Ex. 226
Comparative financial statement data for Arthur Corporation and Lancelot Corporation, two
competitors, appear below. All balance sheet data are as of December 31, 2014.
Arthur Corporation Lancelot Corporation
2014 2014
Net sales $1,850,000 $620,000
Cost of goods sold 1,225,000 365,000
Operating expenses 303,000 98,000
Interest expense 9,000 3,800
Income tax expense 85,000 36,800
Current assets 427,200 130,336
Plant assets (net) 532,000 139,728
Current liabilities 66,325 35,348
Long-term liabilities 148,500 29,620
Additional Information:
Cash from operating activities $153,000 $44,000
Capital expenditures $90,000 $20,000
Dividends paid $36,000 $15,000
Average number of shares outstanding 100,000 50,000
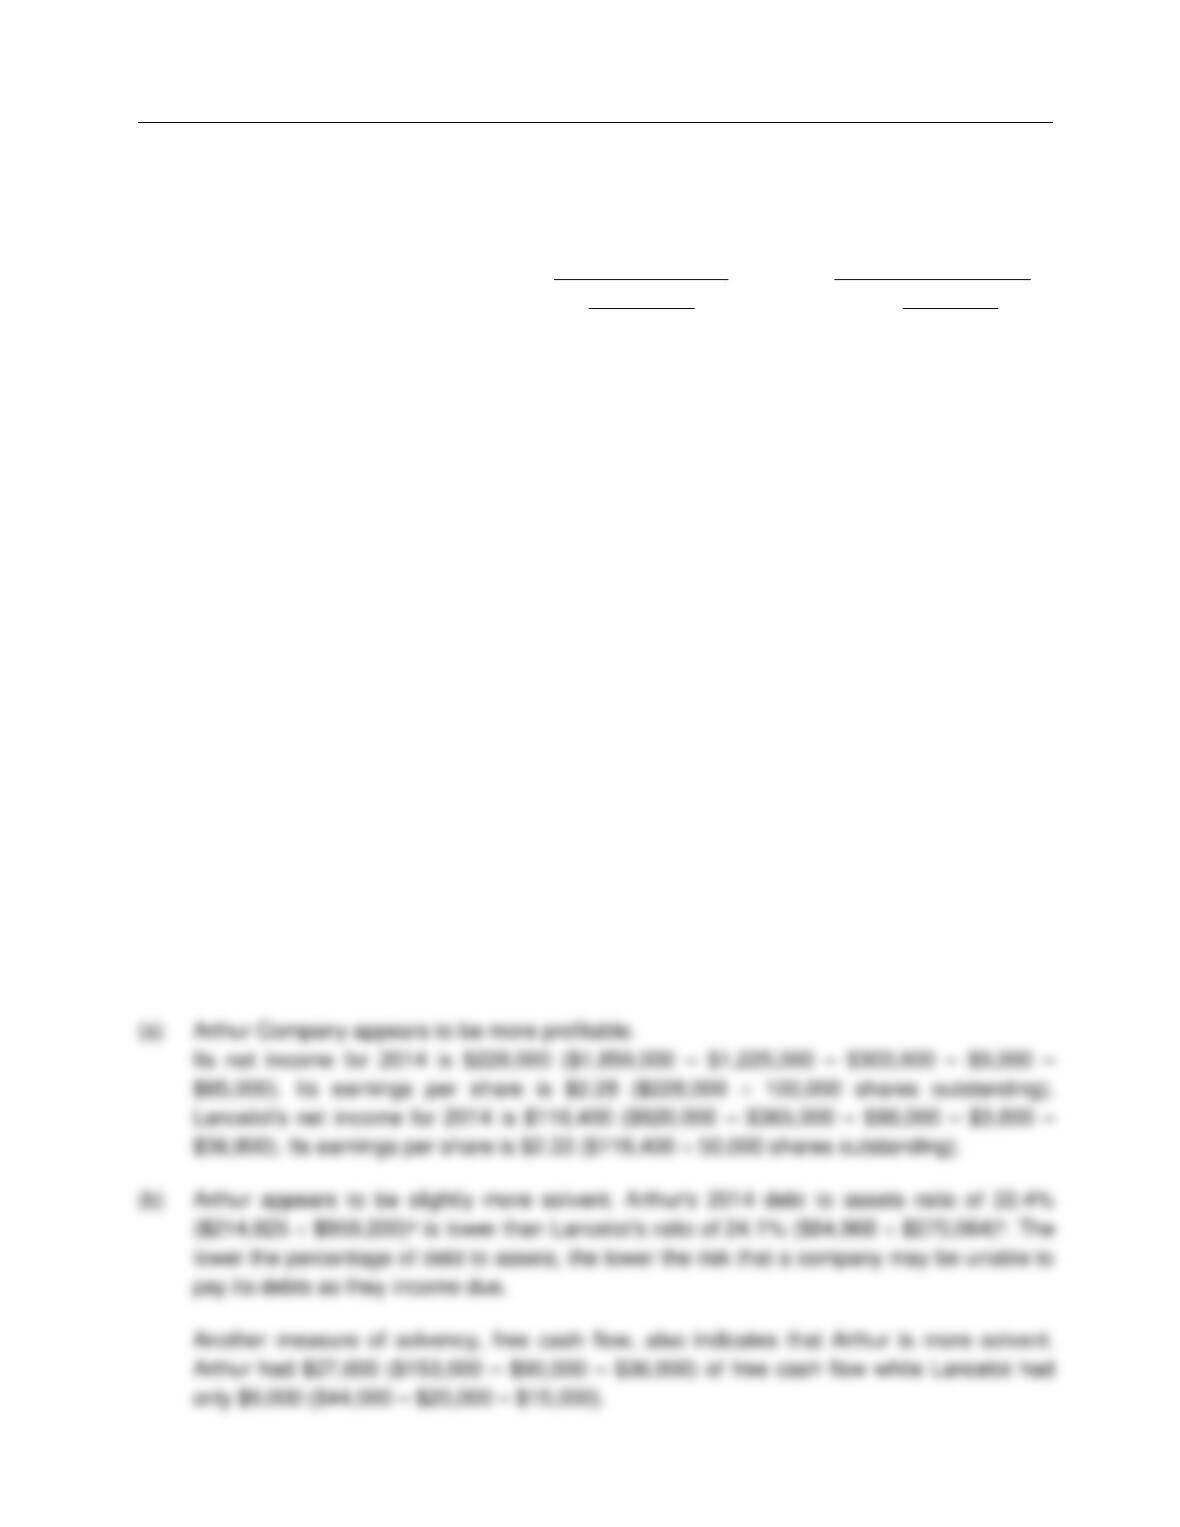
Instructions
(a) Comment on the relative profitability of the companies by computing the net income and
earnings per share for each company for 2014.
(b) Comment on the relative solvency of the companies by computing the debt to assets ratio
and the free cash flow for each company for 2014.
Ans: N/A, LO: 2, 4, 5, Bloom: AN, Difficulty: Medium, Min: 15, AACSB: Analytic, AICPA BB: Legal/Regulatory Perspective, AICPA FN: Reporting, AICPA
PC: Problem Solving, IMA: Business Economics
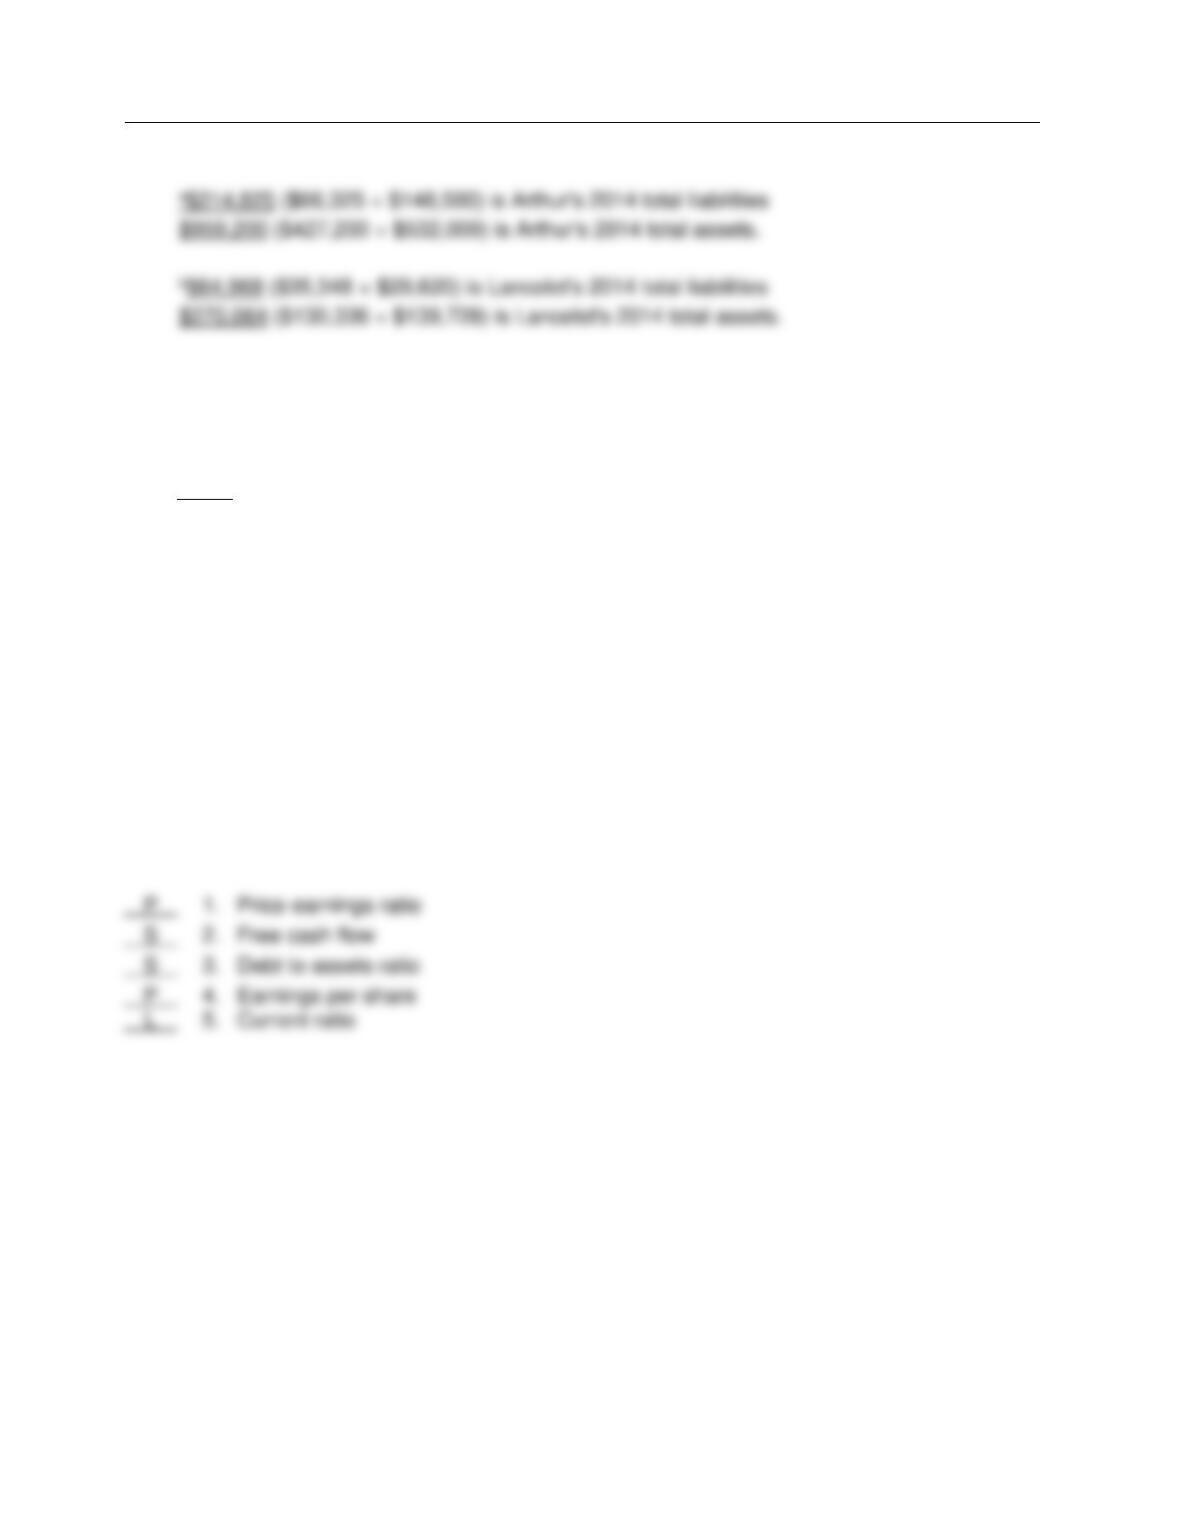
Solution 226 (15 min.)
Test Bank for Accounting: Tools for Business Decision Making, Fifth Edition
FOR INSTRUCTOR USE ONLY
2-66
Solution 226 (Cont.)
Ex. 227
For each of the ratios listed below, indicate by the appropriate code letter, whether it is a liquidity
ratio, a profitability ratio, or a solvency ratio.
Code:
L = Liquidity ratio
P = Profitability ratio
S = Solvency ratio
____ 1. Price-earnings ratio
____ 2. Free cash flow
____ 3. Debt to assets ratio
____ 4. Earnings per share
____ 5. Current ratio
Ans: N/A, LO: 2, 4, 5, Bloom: K, Difficulty: Medium, Min: 5, AACSB: Analytic, AICPA BB: Legal/Regulatory Perspective, AICPA FN: Reporting, AICPA PC:
Problem Solving, IMA: Business Economics
Solution 227 (5 min.)
A Further Look at Financial Statements
FOR INSTRUCTOR USE ONLY
2-67
Ex. 228
The following information is available from the annual reports of Marin Company and Nance
Company.
(amounts in millions)
Marin Nance
Sales $26,510 $34,512
Gross profit 6,610 8,887
Net income 565 1,221
Current assets 13,712 28,447
Beginning total assets 17,102 33,130
Ending total assets 22,088 36,167
Current liabilities 7,966 13,950
Total liabilities 16,136 29,222
Average common shares outstanding 250 480
Preferred stock dividends paid -0- -0-
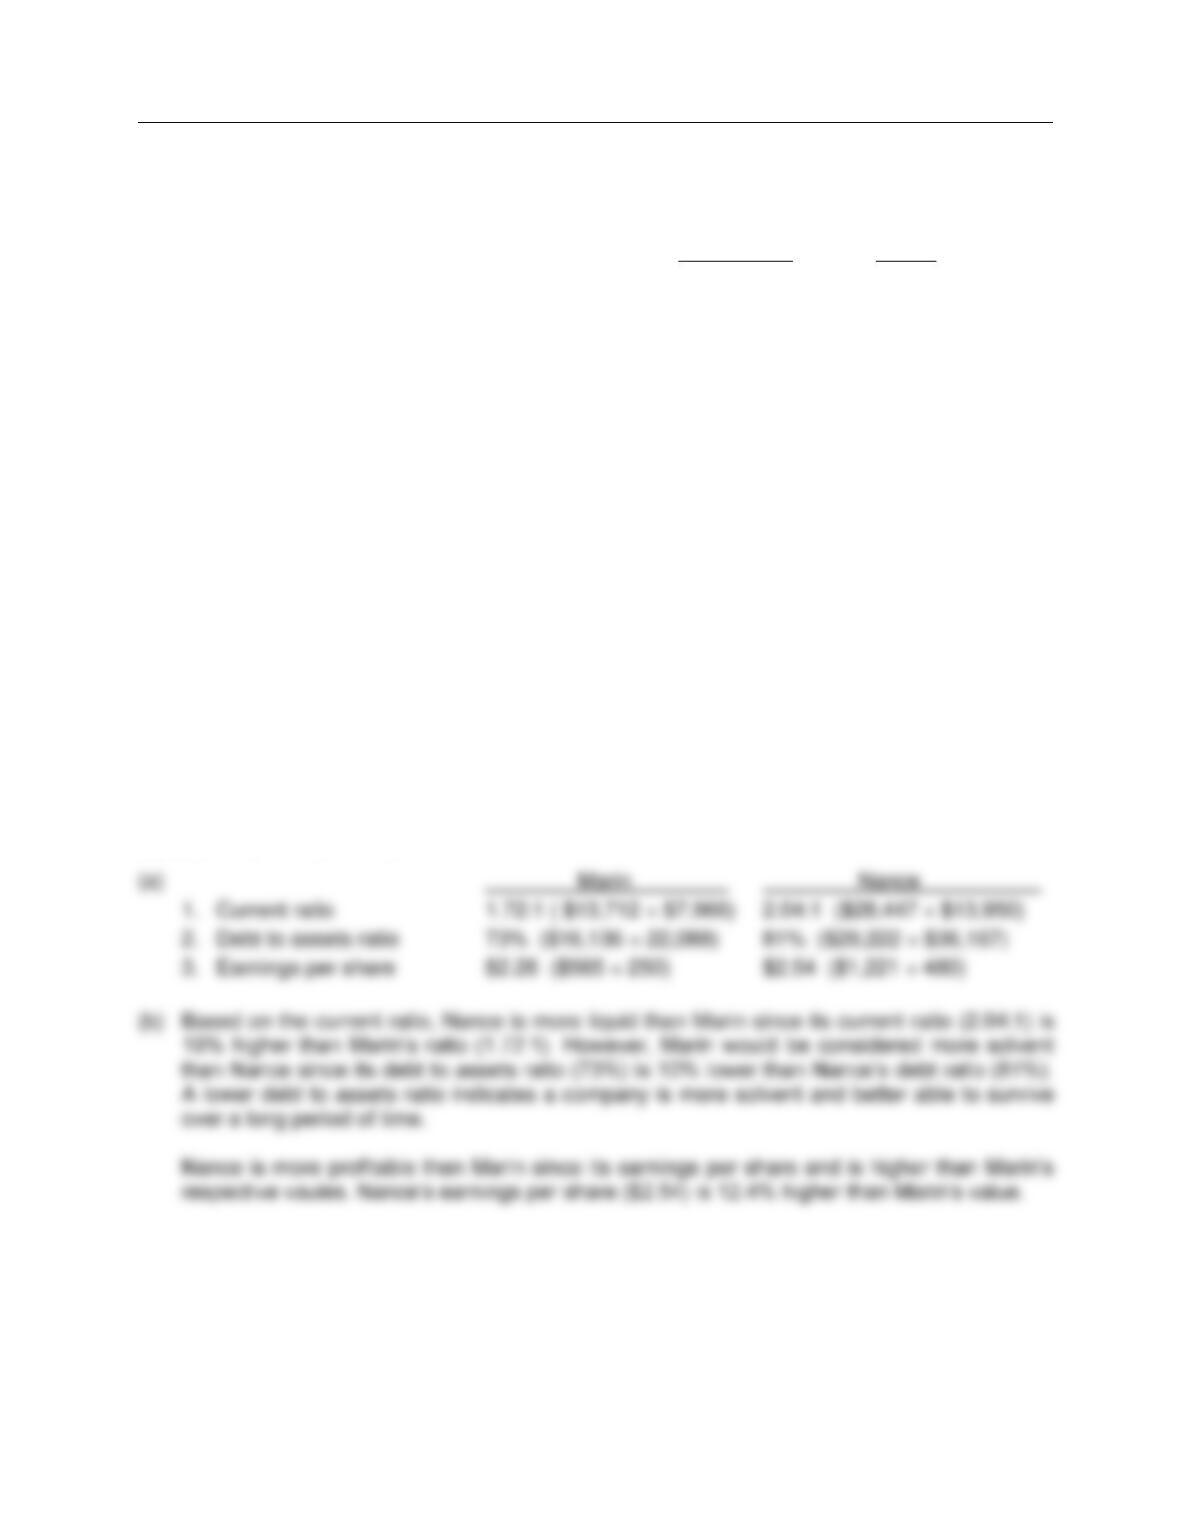
Instructions
(a) For each company, compute the following ratios:
1. Current ratio
2. Debt to assets ratio
3. Earnings per share
(b) Based on your calculations, discuss the relative liquidity, solvency, and profitability of the two
companies.
Ans: N/A, LO: 2, 4, Bloom: AP, Difficulty: Medium, Min: 12, AACSB: Analytic, AICPA BB: Legal/Regulatory Perspective, AICPA FN: Reporting, AICPA
PC: Problem Solving, IMA: Business Economics
Solution 228 (12 min.)
Test Bank for Accounting: Tools for Business Decision Making, Fifth Edition
2-68
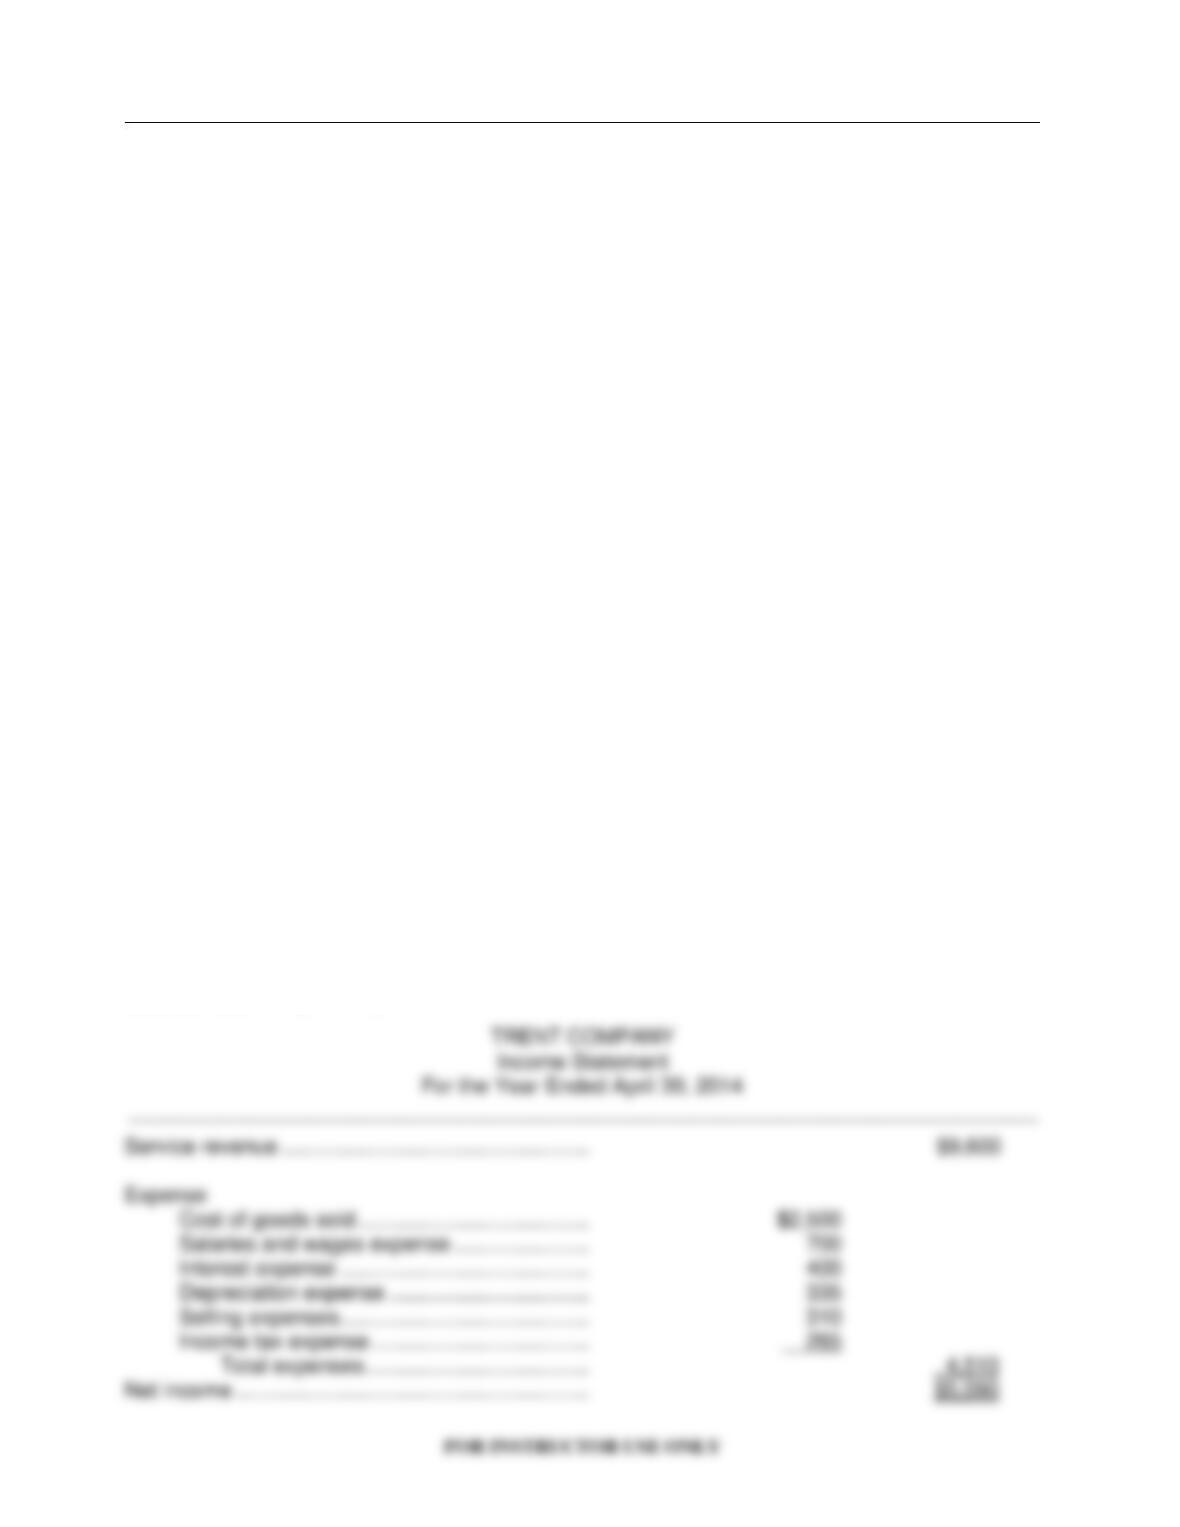
Ex. 229
You are provide with the following information for Trent Company, effective as of its April 30,
2014, year-end.
Accounts payable $ 834
Accounts receivable 810
Buildings, net of accumulated depreciation 3,537
Cash 770
Common stock 900
Cost of goods sold 2,500
Current portion of long-term debt 450
Depreciation expense 335
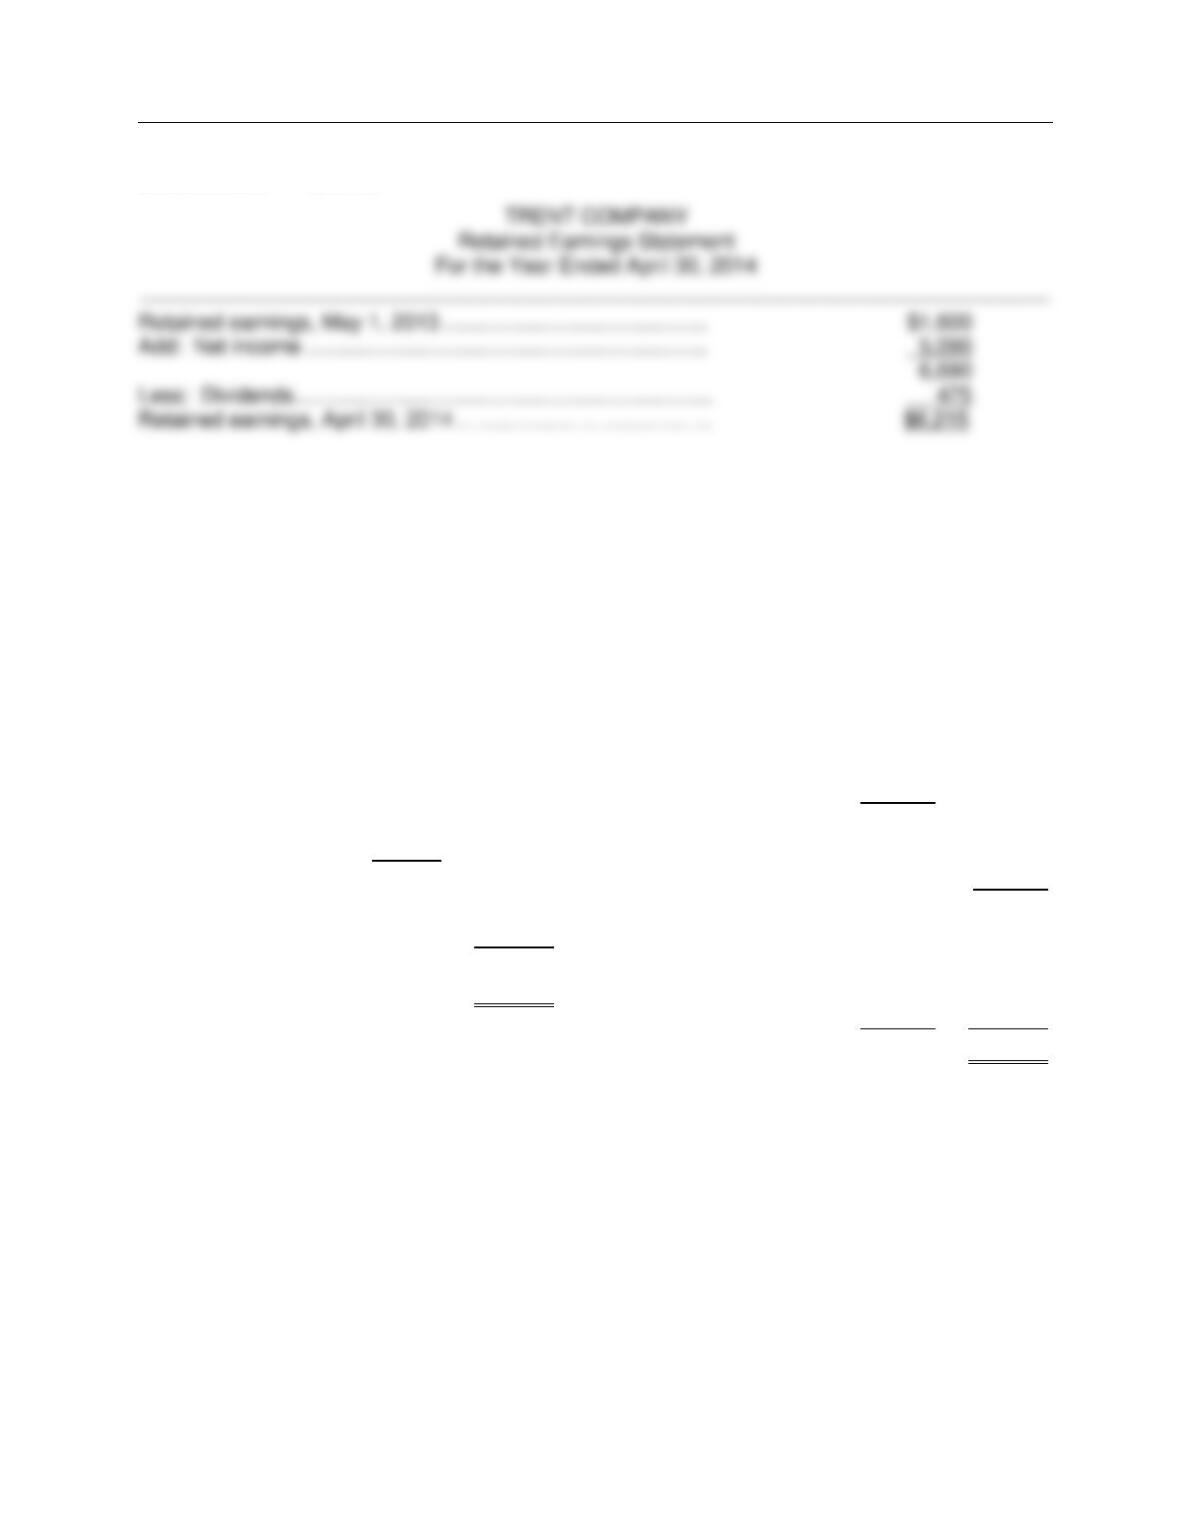
Dividends paid during the year 475
Equipment, net of accumulated depreciation 1,220
Income tax expense 265
Income taxes payable 265
Interest expense 400
Inventory 967
Land 1,600
Long-term debt 3,500
Prepaid expenses 12
Retained earnings, beginning 1,600
Service revenue 9,600
Selling expenses 310
Debt investments 1,200
Salaries and wages expense 700
Salaries and wages payable 222
Instructions
Prepare an income statement and a retained earnings statement for Trent Company for the year
ended April 30, 2014.
Ans: N/A, LO: 3, Bloom: AP, Difficulty: Medium, Min: 15, AACSB: Analytic, AICPA BB: Legal/Regulatory Perspective, AICPA FN: Reporting, AICPA PC:
Problem Solving, IMA: Reporting
Solution 229 (15 min.)
A Further Look at Financial Statements
FOR INSTRUCTOR USE ONLY
2-69
Solution 229 (Cont.)
Ex. 230
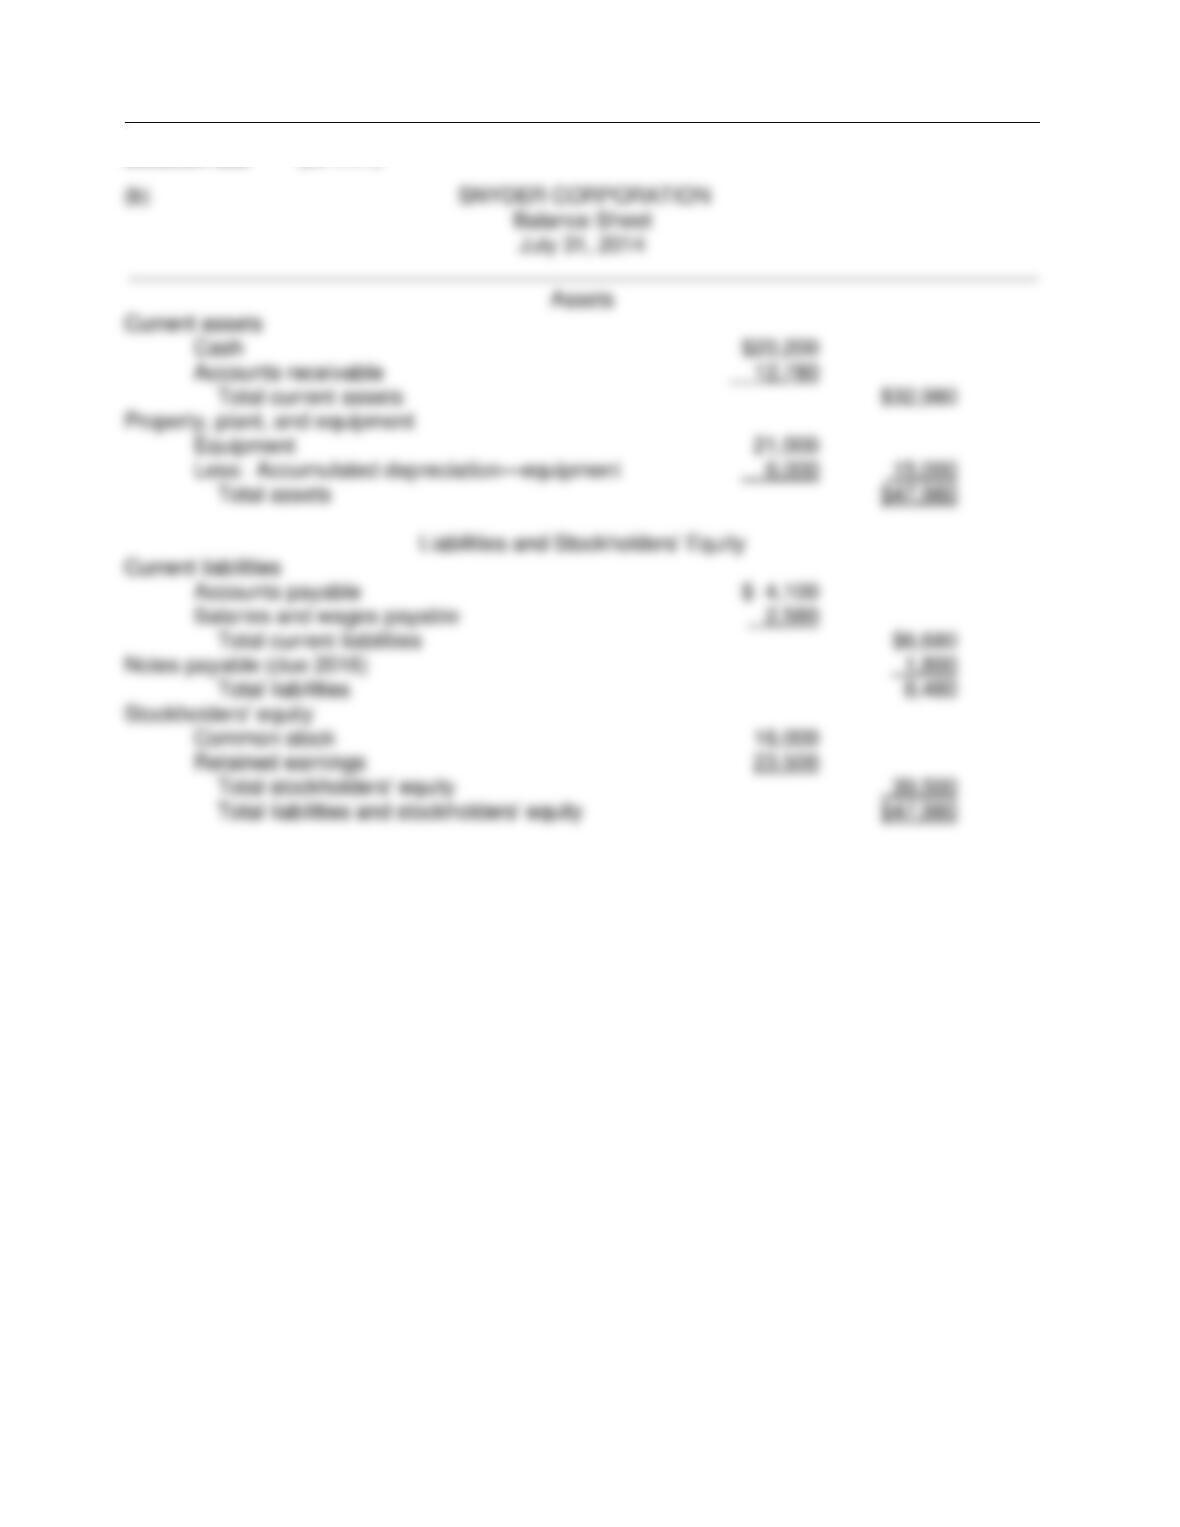
The chief financial officer (CFO) of SuperClean Corporation requested that the accounting
department prepare a preliminary balance sheet on December 30, 2014, so that the CFO could
get an idea of how the company stood. He knows that certain debt agreements with its creditors
require the company to maintain a current ration of at least 2:1. The preliminary balance sheet is
as follows.
SUPERCLEAN CORPORATION
Balance Sheet
December 30, 2014
Current assets
Current liabilities
Cash
$25,000
Accounts payable
$ 20,000
Accounts receivable
20,000
Salaries and wages
payable
10,000
$ 40,000
Prepaid insurance
15,000
$ 60,000
Long-term liabilities
Notes payable
90,000
Total liabilities
130,000
Property, plant, and equipment
(net)
210,000
Stockholders’ equity
Total assets
$270,000
Common stock
100,000
Retained earnings
40,000
140,000
Total liabilities and
stockholders equity
$270,000
Instructions
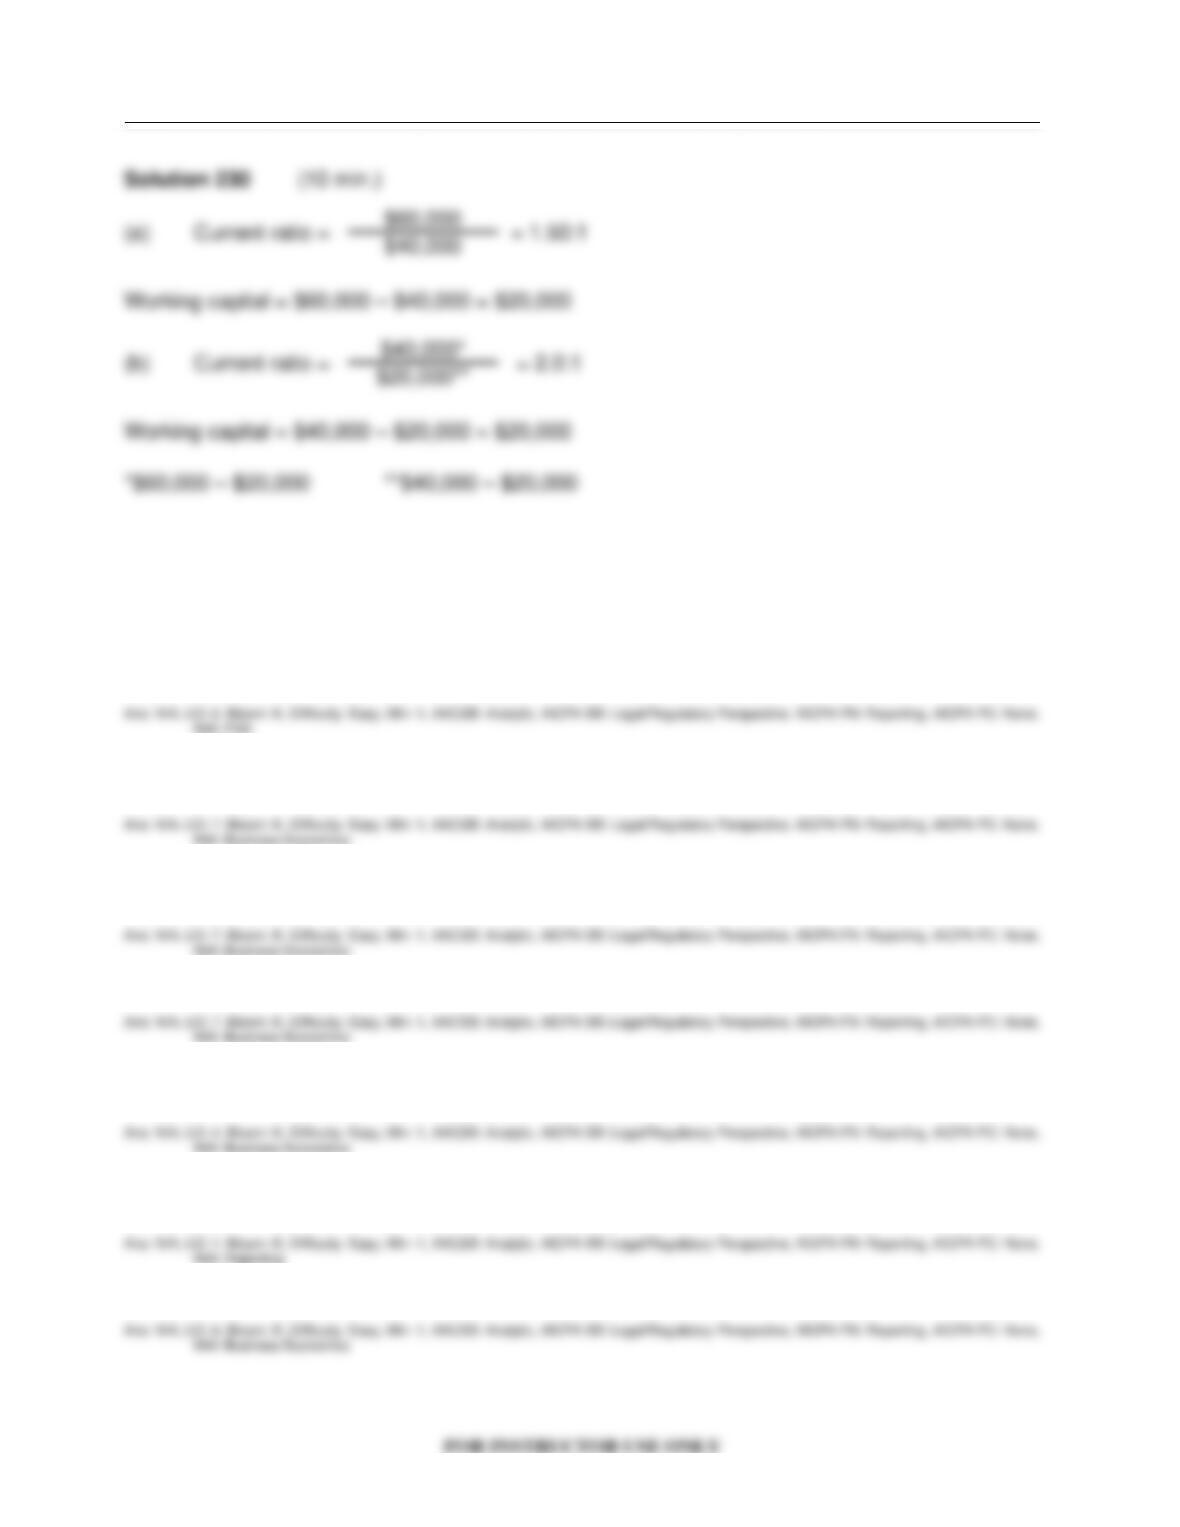
(a) Calculate the current ratio and working capital based on the preliminary balance sheet.
(b) Based in the results in (a), the CFO requested that $20,000 of cash be used to pay off the
balance of the accounts payable account on December 31, 2014. Calculate the new current
ratio and working capital after the company takes these actions.
Ans: N/A, LO: 4, Bloom: AN, Difficulty: Medium, Min: 10, AACSB: Analytic, AICPA BB: Legal/Regulatory Perspective, AICPA FN: Reporting, AICPA PC:
Problem Solving, IMA: Business Economics
Test Bank for Accounting: Tools for Business Decision Making, Fifth Edition
2-70
COMPLETION STATEMENTS
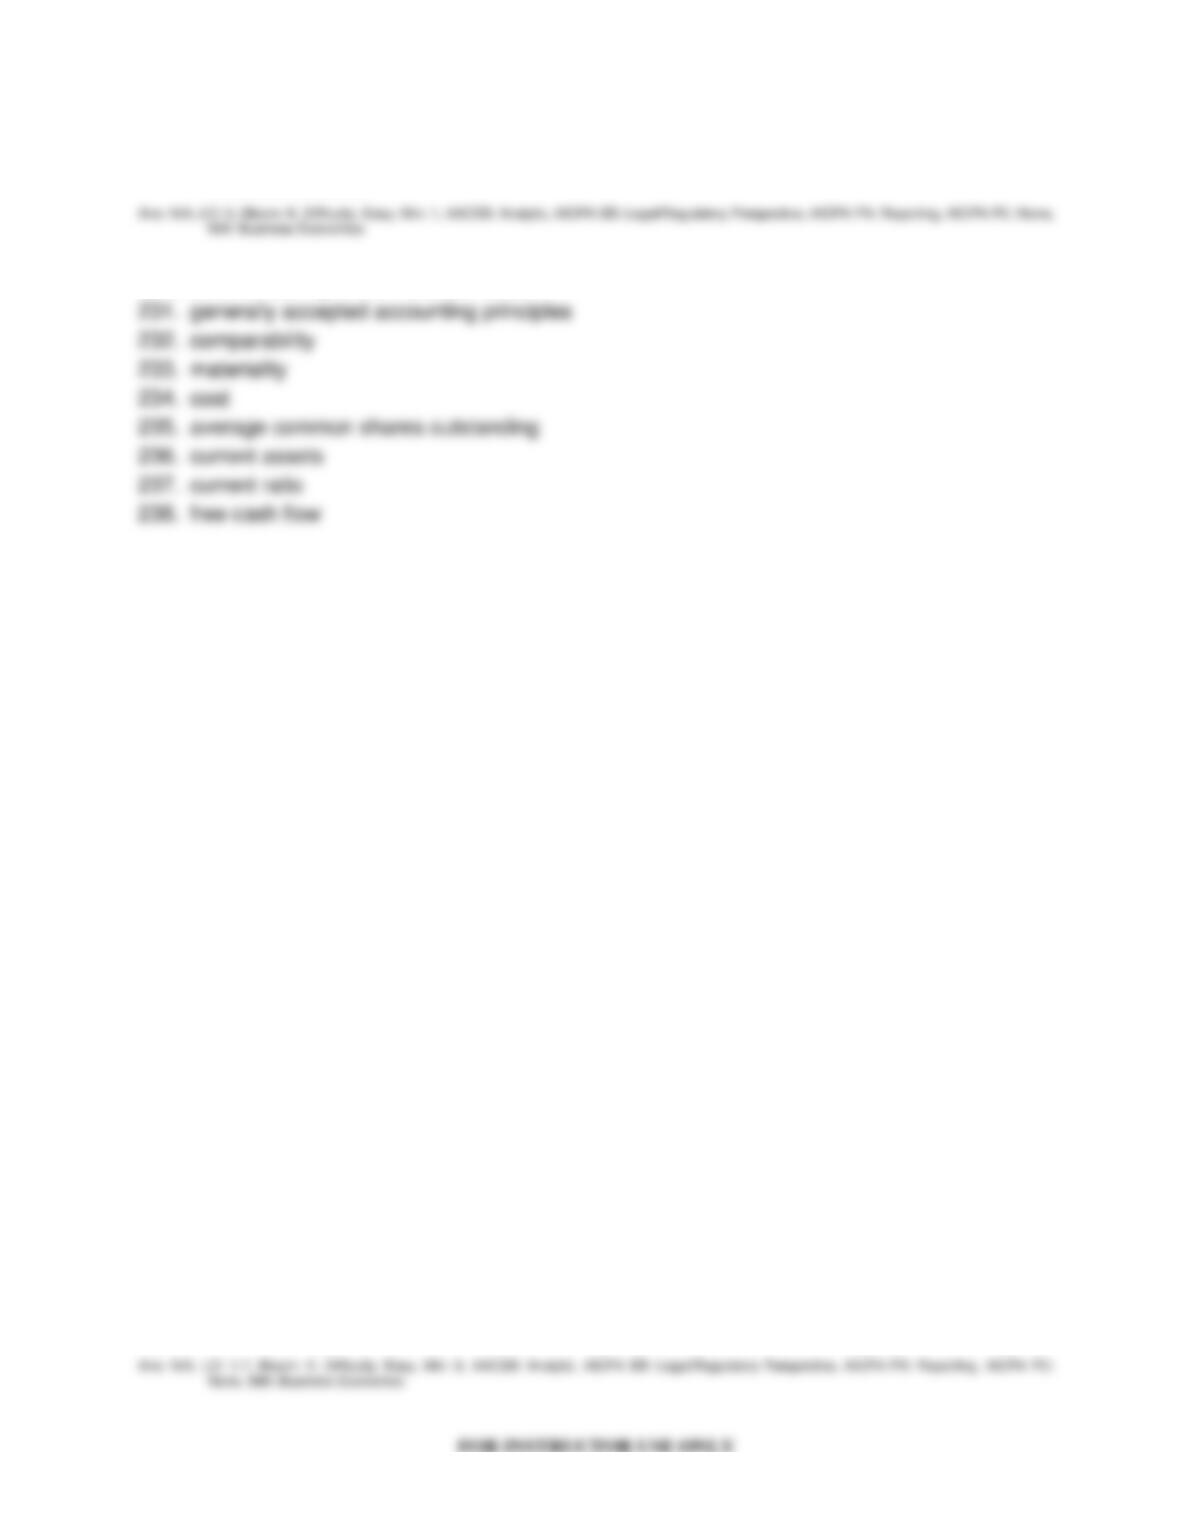
231. The rules and practices that are recognized as general guides for financial reporting are
called ______________ _____________ _______________.
232. In accounting, ____________ results when different companies use the same accounting
principles.
233. _______________ is a company-specific aspect of relevance where size is likely to
influence the decision of an investor or creditor.
234. The _______________ constraint relates to the fact that providing information is costly.
235. The earnings per share value is calculated by dividing net income – preferred stock
dividends by _______________ ______________ ______________.
236. Assets that are expected to be converted to cash or used in the business within a relatively
short period of time are called ______________.
237. The ________________ is current assets divided by current liabilities.
A Further Look at Financial Statements
2-71
238. A measurement to provide additional insight regarding a company’s cash-generating ability
is _____________.
Answers to Completion Statements
MATCHING
239. Match the items below by entering the appropriate code letter in the space provided.
A. Relevance G. Working capital
B. Liquidity ratios H. Current ratio
C. Comparability I. Earnings per share
D. Consistency J. Solvency ratios
E. Intangible assets K. Economic entity assumption
F. Free cash flow L. Materiality
____ 1. Measures of the ability of the company to survive over a long period of time.
____ 2. Current assets divided by current liabilities.
____ 3. Information that has a bearing on a decision.
____ 4. Economic events can be identified with a particular unit of accountability.
____ 5. An item important enough to influence the decision of an investor or creditor.
____ 6. Same accounting principles and methods used from year to year within a company.
____ 7. Cash from operating activities less capital expenditures and cash dividends.
____ 8. Noncurrent assets that do not have physical substance.
____ 9. (Net income – preferred stock dividends) divided by average common shares
outstanding.
____ 10. Different companies using the same accounting principles.
____ 11. Measures of the short-term ability of the enterprise to pay its maturing obligations.
____ 12. The excess of current assets over current liabilities.
Test Bank for Accounting: Tools for Business Decision Making, Fifth Edition
FOR INSTRUCTOR USE ONLY
2-72
Answers to Matching
SHORT-ANSWER ESSAY QUESTIONS
S-A E 240
Identify the two parts of stockholders’ equity in a corporation and indicate the purpose of each.
Ans: N/A, LO: 1, Bloom: K, Difficulty: Medium, Min: 5, AACSB: Communication, AICPA BB: Legal/Regulatory Perspective, AICPA FN: Reporting, AICPA
PC: Communication, IMA: Reporting
Solution 240
S-A E 241
What do these classes of ratios measure?
(a) Liquidity ratios.
(b) Profitability ratios.
(c) Solvency ratios.
Ans: N/A, LO: 2,4, Bloom: K, Difficulty: Medium, Min: 5, AACSB: Communication, AICPA BB: Legal/Regulatory Perspective, AICPA FN: Reporting,
AICPA PC: Communication, IMA: Business Economics
Solution 241
S-A E 242
Give the definition of current assets, current liabilities and the current ratio.
Ans: N/A, LO: 1, 4, Bloom: K, Difficulty: Medium, Min: 5, AACSB: Communication, AICPA BB: Legal/Regulatory Perspective, AICPA FN: Reporting,
AICPA PC: Communication, IMA: Business Economics
A Further Look at Financial Statements
FOR INSTRUCTOR USE ONLY
2-73
Solution 242
S-A E 243
Are short-term creditors, long-term creditors, and stockholders primarily interested in the same
characteristics of a company? Explain.
Ans: N/A, LO: 2, 4, Bloom: C, Difficulty: Medium, Min: 5, AACSB: Communication, AICPA BB: Legal/Regulatory Perspective, AICPA FN: Reporting,
AICPA PC: Communication, IMA: Business Economics
Solution 243
S-A E 244
Relevance and faithful representation are the fundamental qualities of useful information.
(a) Briefly define each term.
(b) Why are these characteristics important to users of financial statements?
Ans: N/A, LO: 7, Bloom: C, Difficulty: Medium, Min: 5, AACSB: Communication, AICPA BB: Legal/Regulatory Perspective, AICPA FN: Reporting, AICPA
PC: Communication, IMA: Reporting
Solution 244
Test Bank for Accounting: Tools for Business Decision Making, Fifth Edition
FOR INSTRUCTOR USE ONLY
2-74
S-A E 245
You and the CEO of your company are waiting on an elevator. You are going to the 25th floor and
the CEO is going to the 35th floor. The CEO says “What is the difference between consistency
and comparability?” You have two minutes to respond. What will you say?
Ans: N/A, LO: 7, Bloom: C, Difficulty: Medium, Min: 2, AACSB: Communication, AICPA BB: Legal/Regulatory Perspective, AICPA FN: Reporting, AICPA
PC: Communication, IMA: Reporting
Solution 245
S-A E 246
Comparability and consistency are enhancing qualities that make accounting information useful
for decision-making purposes. Briefly explain the difference between these two qualities and
explain how they are related to each other.
Ans: N/A, LO: 7, Bloom: C, Difficulty: Medium, Min: 5, AACSB: Communication, AICPA BB: Legal/Regulatory Perspective, AICPA FN: Reporting, AICPA
PC: Communication, IMA: Reporting
Solution 246
S-A E 247
Identify and briefly explain the two fundamental qualities of useful information.
Ans: N/A, LO: 7, Bloom: K, Difficulty: Medium, Min: 5, AACSB: Communication, AICPA BB: Legal/Regulatory Perspective, AICPA FN: Reporting, AICPA
PC: Communication, IMA: Reporting
Solution 247
A Further Look at Financial Statements
FOR INSTRUCTOR USE ONLY
2-75
S-A E 248
What are three of the five enhancing qualities of useful information.
Ans: N/A, LO: 7, Bloom: K, Difficulty: Medium, Min: 5, AACSB: Communication, AICPA BB: Legal/Regulatory Perspective, AICPA FN: Reporting, AICPA
PC: Communication, IMA: Reporting
Solution 248
S-A E 249 (Ethics)
Many bonus plans are based upon the attainment of some specified short-term goal. For
example, sales personnel at Metal Crafters are given a bonus of 5% of the amount by which their
sales exceed $100,000. Sometimes the attainment of these goals is achieved by methods
detrimental to the long-term needs of the company. Sales representative Sara Crown, for
example, finds herself tempted to court certain customers that place large orders, even though
she knows they may not be able to pay. She complains that the bonus system itself is unethical.
Required:
Is a bonus system like the one at Metal Crafters unethical? Explain.
Ans: N/A, LO: 4, Bloom: E, Difficulty: Medium, Min: 5, AACSB: Ethics, AICPA BB: Legal/Regulatory Perspective, AICPA FN: Decision Modeling, AICPA
PC: Communication, IMA: Performance Measurement
Solution 249
Test Bank for Accounting: Tools for Business Decision Making, Fifth Edition
FOR INSTRUCTOR USE ONLY
2-76
S-A E 250 (Communication)
Sunshine Sugar grows sugar cane in Florida, California, and Hawaii. Its investment in land to
grow sugar exceeds $2 million. Currently, land whose original cost was more than $300,000 in
Florida is threatened by plans to flood the Everglades to reclaim the wetlands. Sunshine plans to
fight vigorously to keep its land in production, particularly because most of the rest of its land is in
California, which is threatened by water shortages. The land in Florida is also significantly more
productive than that in California, and the wages paid to workers to process the sugar cane are
substantially less. Current plans include litigation to prevent government seizure of the land, an
extensive public education campaign, and intense lobbying efforts.
Required:
Sunshine has determined that a footnote disclosure should be made in the financial statements to
alert the investors of the threat to the land. Carefully consider how much of the above information
is appropriate for inclusion in the footnote. Write the footnote.
Ans: N/A, LO: 7, Bloom: E, Difficulty: Medium, Min: 5, AACSB: Communication, AICPA BB: Legal/Regulatory Perspective, AICPA FN: Reporting, AICPA
PC: Communication, IMA: Reporting
Solution 250
A Further Look at Financial Statements
2-77
IFRS Questions
1. The classified balance sheet is
a. required under GAAP but not under IFRS.
b. required under IFRS in the same format as under GAAP.
c. required under IFRS but not under GAAP.
d. required under IFRS with certain variations in format as compared to GAAP.
2. IFRS requires the use of
a. the term balance sheet.
b. the term statement of financial position.
c. neither balance sheet nor statement of financial position, but recommends use of the
term balance sheet.
d. neither balance sheet nor statement of financial position, but recommends use of the
term statement of financial position.
3. IFRS
a. requires a specific format for the balance sheet (statement of financial position) that is
identical to U.S. GAAP.
b. requires a specific format for the balance sheet (statement of financial position) that is
different from U.S. GAAP.
c. requires no specific format for the balance sheet (statement of financial position) but
most companies that follow IFRS prepare the statement identical to U.S. GAAP .
d. requires no specific format for the balance sheet (statement of financial position) but
most companies that follow IFRS prepare the statement in a different format from U.S.
GAAP.
4. Most companies that follow IFRS present balance sheet (statement of financial position)
information in this order.
a. current assets; investments; property; plant and equipment; intangible assets; current
liabilities; long term liabilities; owners’ equity.
b. intangible assets; property; plant and equipment; investments; current assets; current
liabilities; owners’ equity; long term liabilities.
c. current assets; noncurrent assets; current liabilities; noncurrent liabilities; equity.
d. noncurrent assets; current assets; equity; noncurrent liabilities; current liabilities.
5. Under IFRS and under GAAP, current assets are listed in
IFRS GAAP
a. order of liquidity order of liquidity
b. reverse order of liquidity order of liquidity
c. order of liquidity reverse order of liquidity
d. reverse order of liquidity reverse order of liquidity
Test Bank for Accounting: Tools for Business Decision Making, Fifth Edition
FOR INSTRUCTOR USE ONLY
2-78
6. The subtotal net assets is used in
a. both GAAP and IFRS.
b. GAAP but not IFRS.
c. IFRS but not GAAP.
d. neither IFRS nor GAAP.
7. Both IFRS and GAAP require disclosure about
a. accounting policies followed.
b. judgements that management has made in the process of applying the entity’s
accounting policies.
c. the key assumptions and estimation uncertainty.
d. all of the above.
8. Under IFRS
a. comparative prior-period information must be presented, but financial statements need
not be provided annually.
b. comparative prior-period information must be presented, and financial statements
must be provided annually.
c. comparative prior-period information is not required, but financial statements need not
be provided annually.
d. comparative prior-period information is not required, but financial statements must be
provided annually.
9. The use of fair value to report assets
a. is not allowed under GAAP or IFRS.
b. is required by GAAP and IFRS.
c. is increasing under GAAP and IFRS, but GAAP has adopted it more broadly.
d. is increasing under GAAP and IFRS, but IFRS has adopted it more broadly.
10 Under IFRS
a. companies can apply fair value to property, plant, and equipment and natural
resources.
b. companies can apply fair value to property, plant, and equipment but not to natural
resources.
c. companies can apply fair value to neither property, plant, and equipment nor natural
resources.
d. companies can apply fair value to natural resources but not to property, plant, and
equipment.