2-1
Chapter 2
Answers to Review Problems
Finance For Executives – 4th Edition
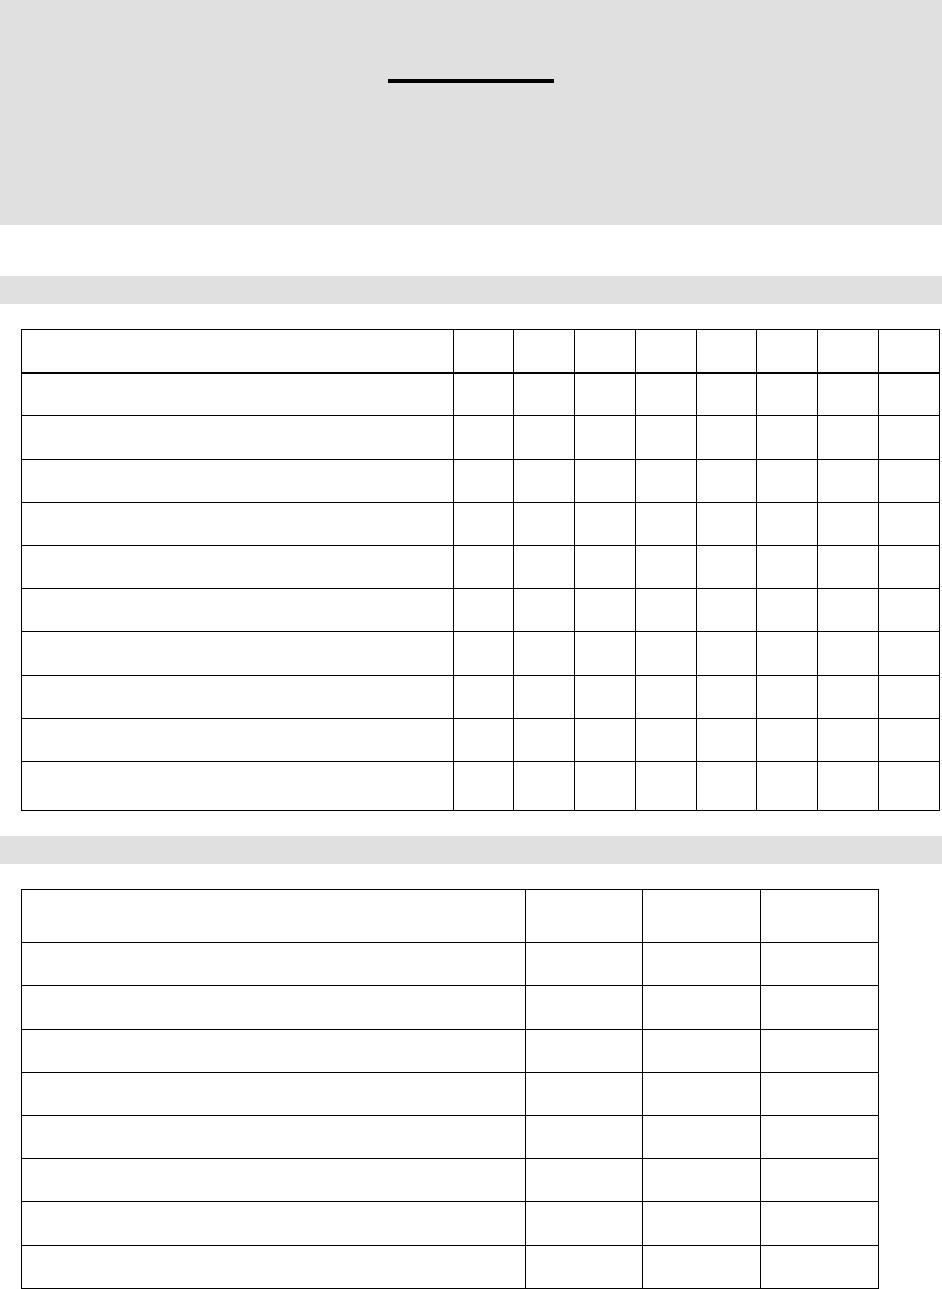
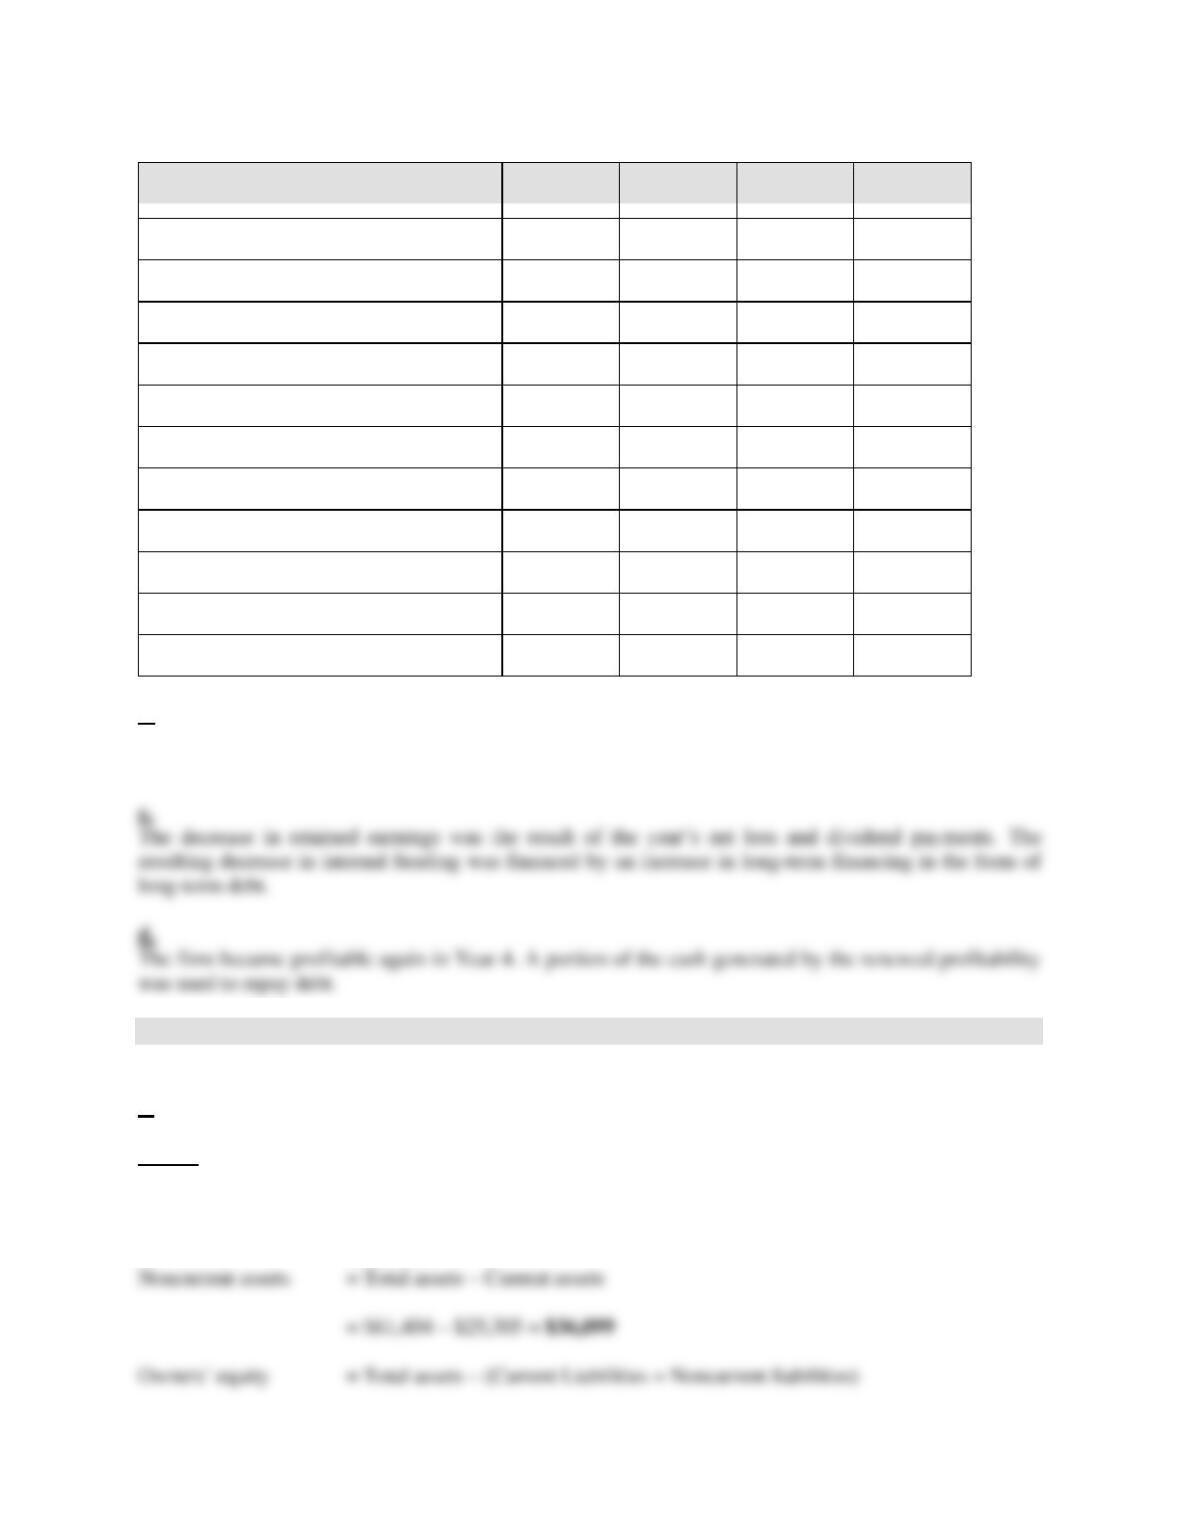
1. Accounting allocation of transactions.
CA
NCA
CL
NCL
OE
REV
EXP
RE
1. Factory equipment purchased for cash
✓
✓
2. Goodwill impairment loss
✓
✓
✓
✓
3. Interest income received
✓
✓
✓
✓
4. Dividend declared
✓
✓
✓
5. Shares repurchased
✓
✓
6. Sell merchandise on account
✓
✓
✓
✓
✓
7. Pay two months’ rent in advance
8. Purchase raw material on account
✓
✓
9. Receive cash advance from customer
✓
✓
10. Recognize salaries earned by employees
✓
✓
✓
✓
2. Missing accounts.
Firm 1
Firm 2
Firm 3
Assets, beginning of period
$1,000
$400
$1,500
Assets, end of period
1,100
500
1,500
Owner’s equity, beginning of period
500
200
900
Owners’ equity, end of period
600
260
1,000
Liabilities, beginning of period
500
200
600
Liabilities, end of period
500
240
500
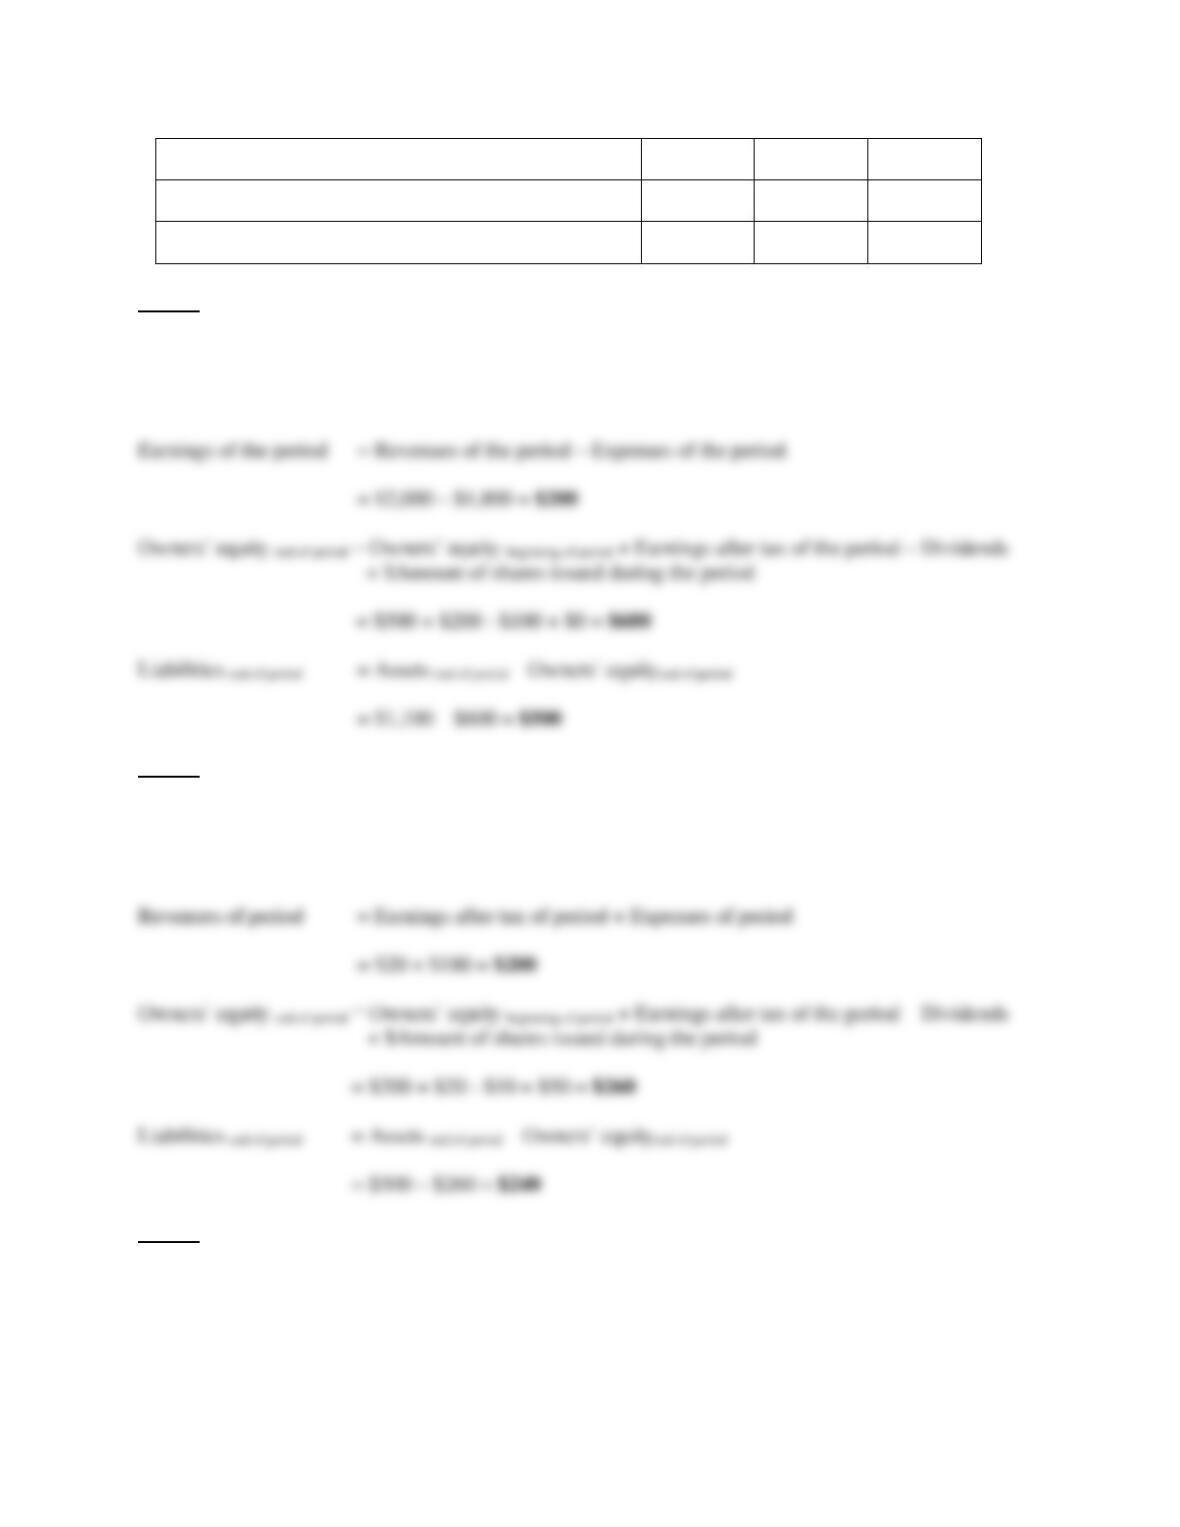
Revenues of the period
2,000
200
600
Expenses of the period
1,800
180
500
2-2
Earnings after tax of the period
200
20
100
Dividends (from earnings of the period)
100
10
0
Shares issued ($ amount) during the period
0
50
0
Firm 1
Liabilities beginning of period = Assets beginning of period – Owners’ equity beginning of period
= $1,000 – $500 = $500
Firm 2
Assets beginning of period = Liabilities beginning of period + Owners’ equity beginning of period
= $200 + $200 = $400
Firm 3
Owners’ equity beginning of period = Owners’ equity end of period – Earnings after tax of the period + Dividends
– $Amount of shares issued during the period
= $1,000 – $100 + $0 – $0 = $900
2-3
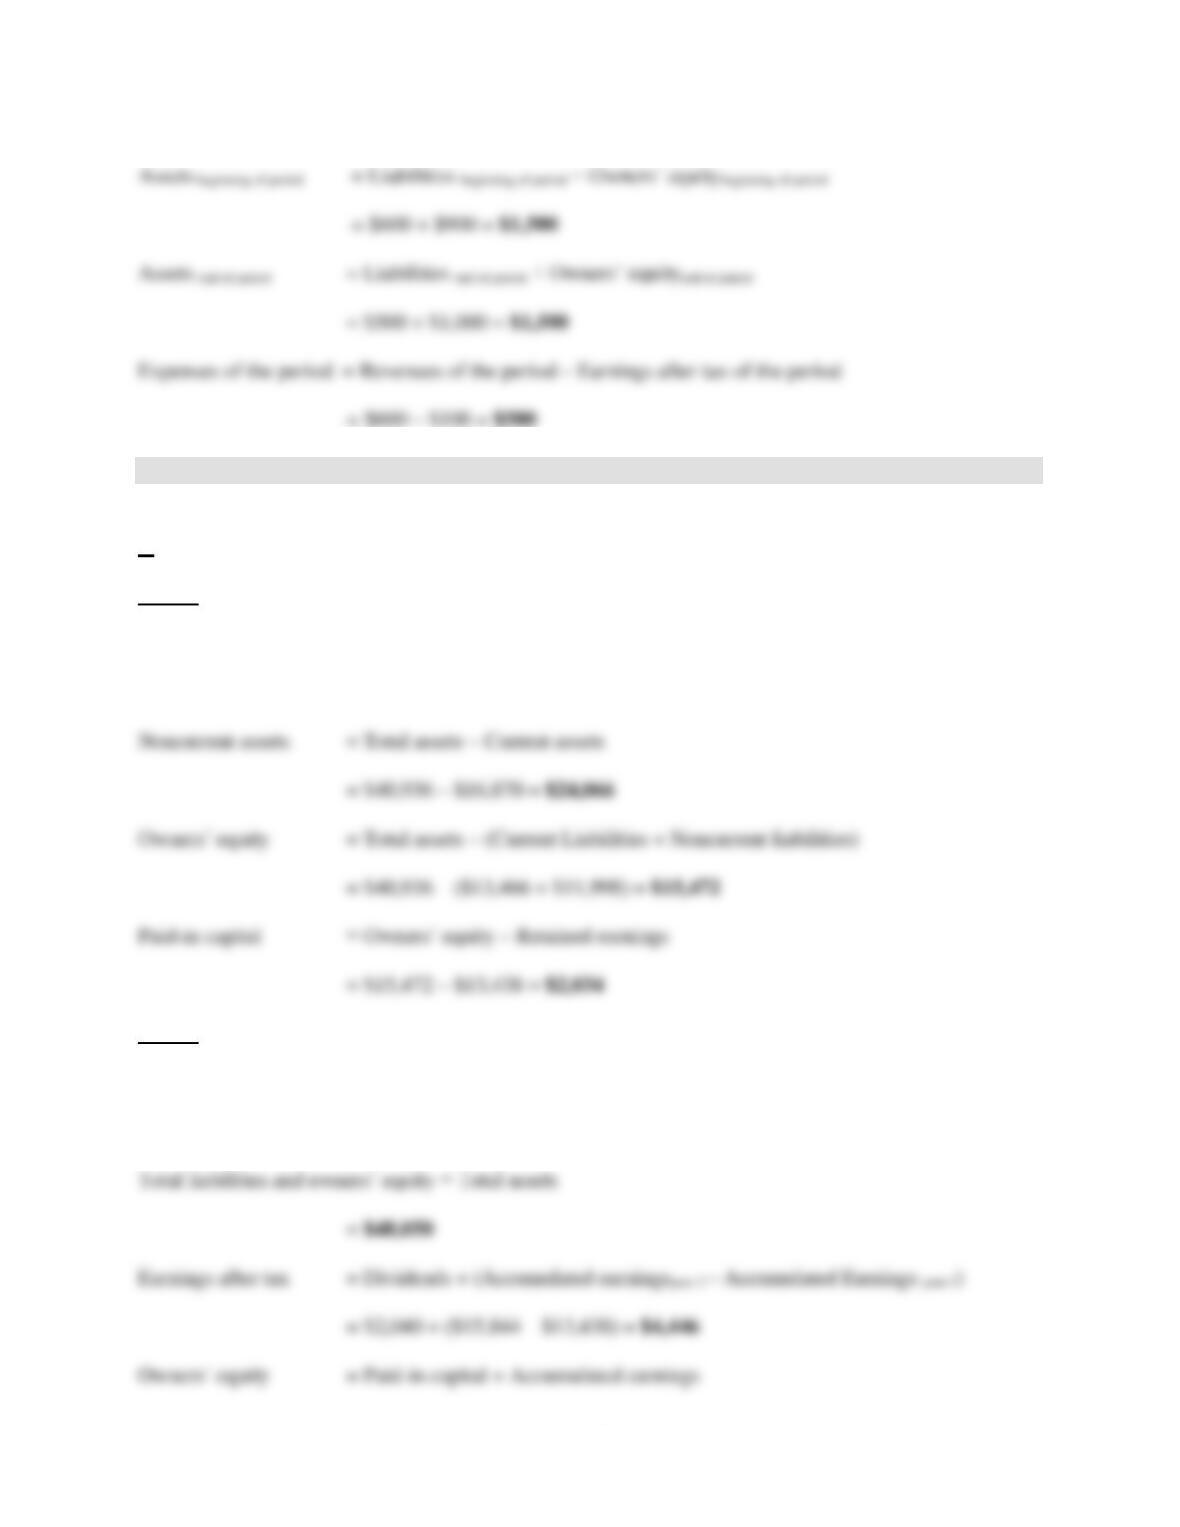
3. Balance sheet changes.
Figures in millions
a.
Year 1
Total assets = Total liabilities and Owners’ equity
= $40,936
Year 2
Noncurrent assets = Total assets – Current assets
= $48,050 – $18,732 = $29,318
2-4
Year 3
Total assets = Current assets + Noncurrent assets
= $19,950 + $29,920 = $49,870
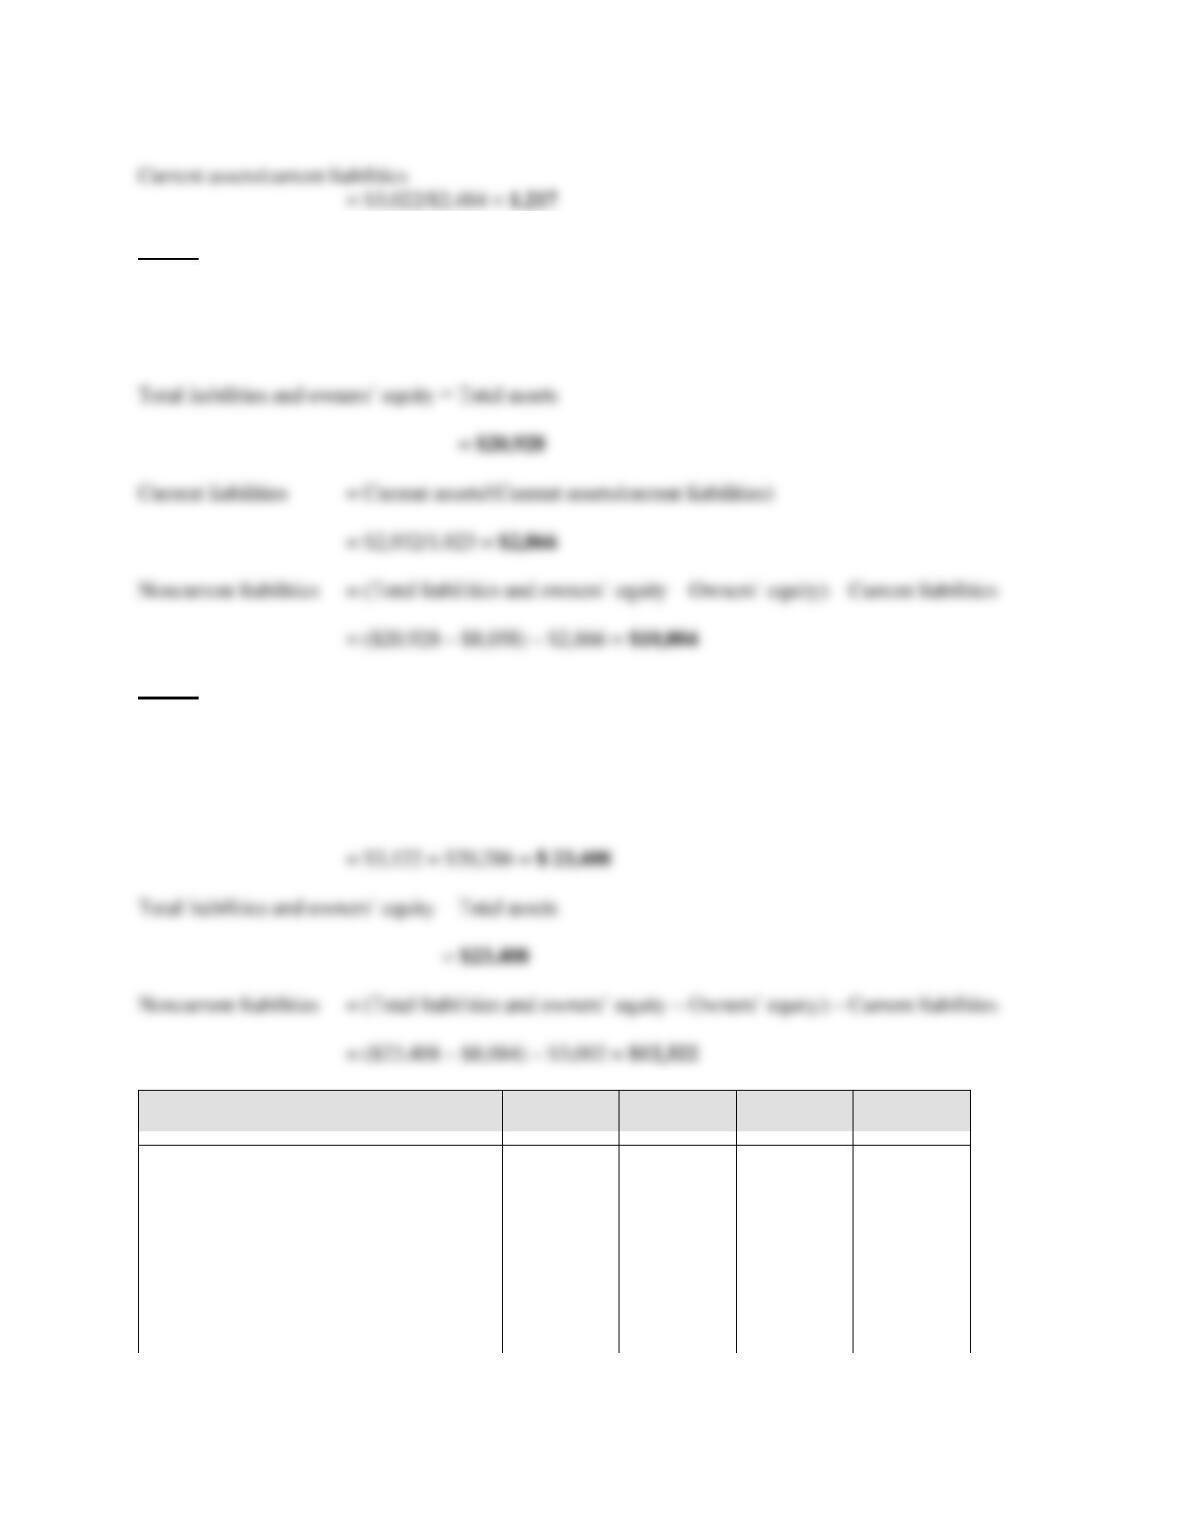
Total liabilities and owners’ equity = Total assets
Year 4
Noncurrent assets = Total liabilities and owners’ equity – Current assets
= $51,070 – $19,976 = $31,094
Total assets = Total liabilities and owners’ equity
= $51,070
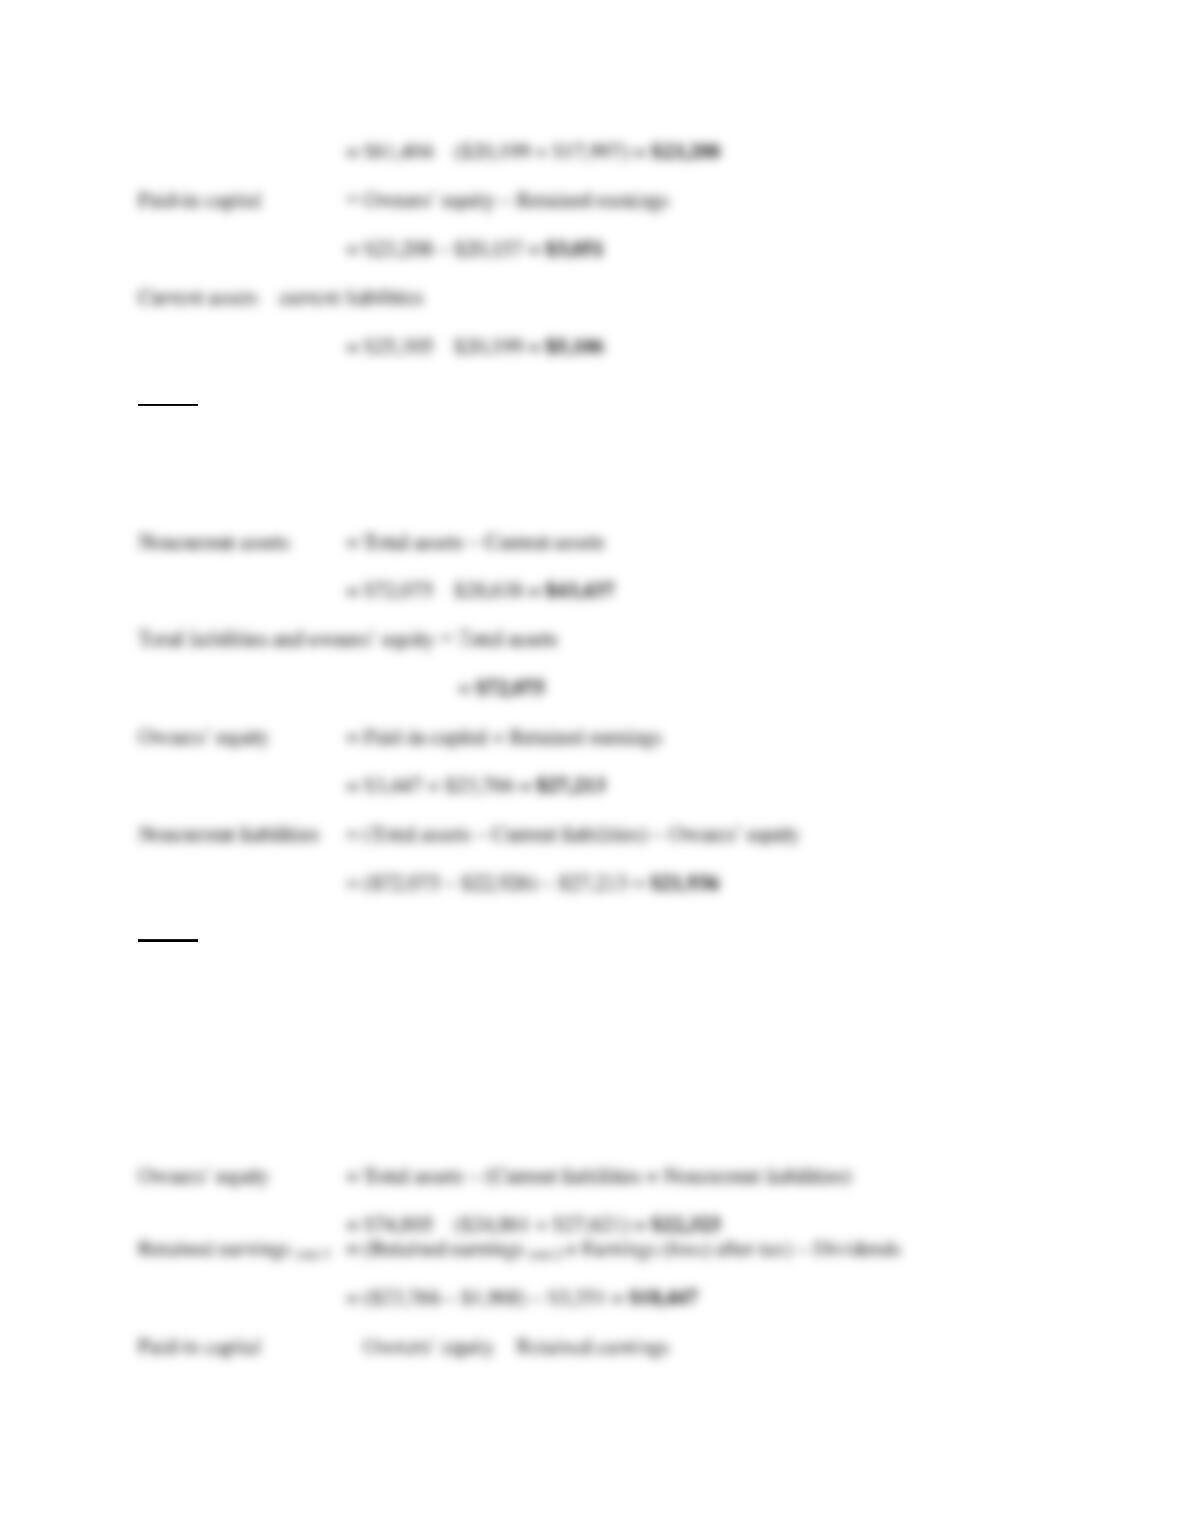
2-5
End-of-year for balance sheet items
Year 1
Year 2
Year 3
Year 4
Current assets
$16,870
$18,732
$19,950
$19,976
Noncurrent assets
24,066
29,318
29,920
31,094
Total assets
40,936
48,050
49,870
51,070
Current liabilities
13,466
15,284
16,574
16,080
Noncurrent liabilities
11,998
14,624
18,414
17,326
Paid-in capital
2,034
2,298
2,584
2,798
Retained earnings
13,438
15,844
12,298
14,866
Earnings (loss) after tax
2,014
4,446
(1,312)
5,048
Dividends
1,580
2.040
2,234
2,480
Owners’ equity
15,472
18,142
14,882
17,664
Total liabilities and owners’ equity
40,936
48,050
49,870
51,070
b.
A large investment (e.g., the acquisition of another firm) would explain the increase in total assets
between years 1 and 2. A mix of debt and equity financing was used to finance the investment.
4. Balance sheet changes.
Figures in millions
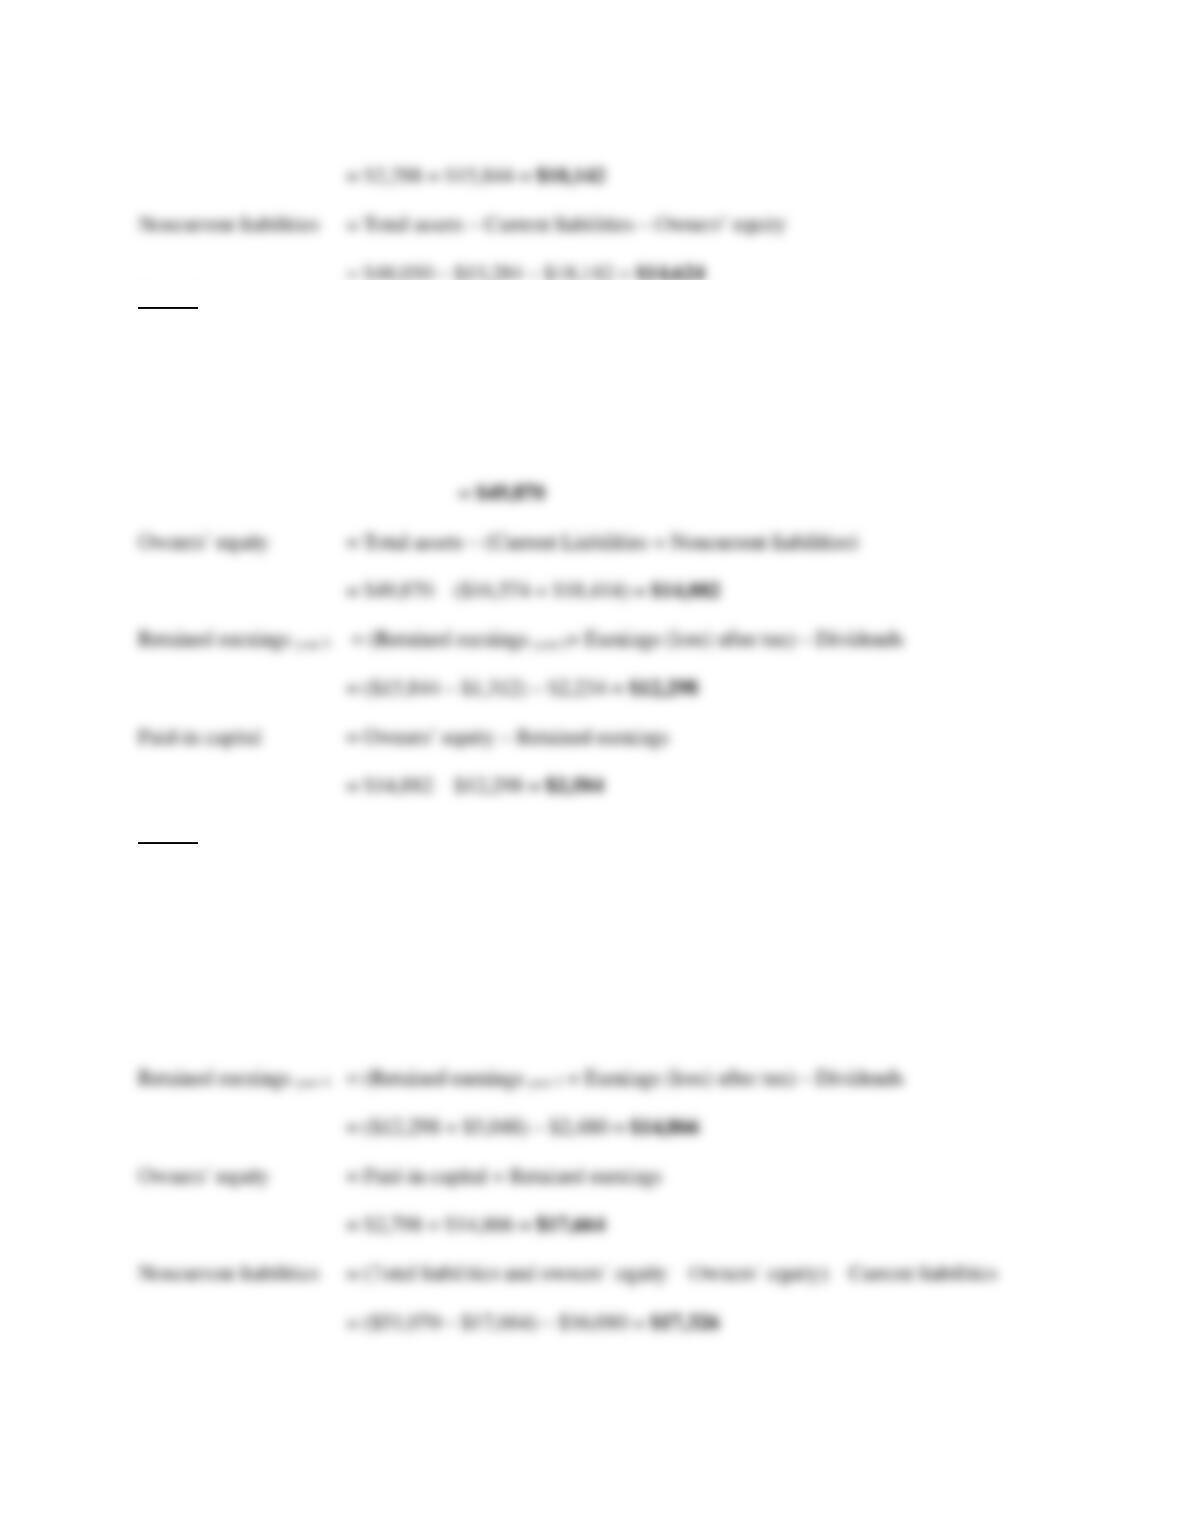
a.
Year 1
Total assets = Total liabilities and Owners’ equity
= $61,404
2-6
Year 2
Current assets = (Current assets – current liabilities) + Current liabilities
= $5,712 + $22,926 = $28,638
Year 3
Total assets = Current assets + Noncurrent assets
= $29,925 + $44,880 = $74,805
Total liabilities and owners’ equity = Total assets
= $74,805
2-7
Year 4
Total assets = Total liabilities and owners’ equity
= $76,605
Noncurrent assets = Total assets – Current assets
= $76,605 – $29,964 = $46,641
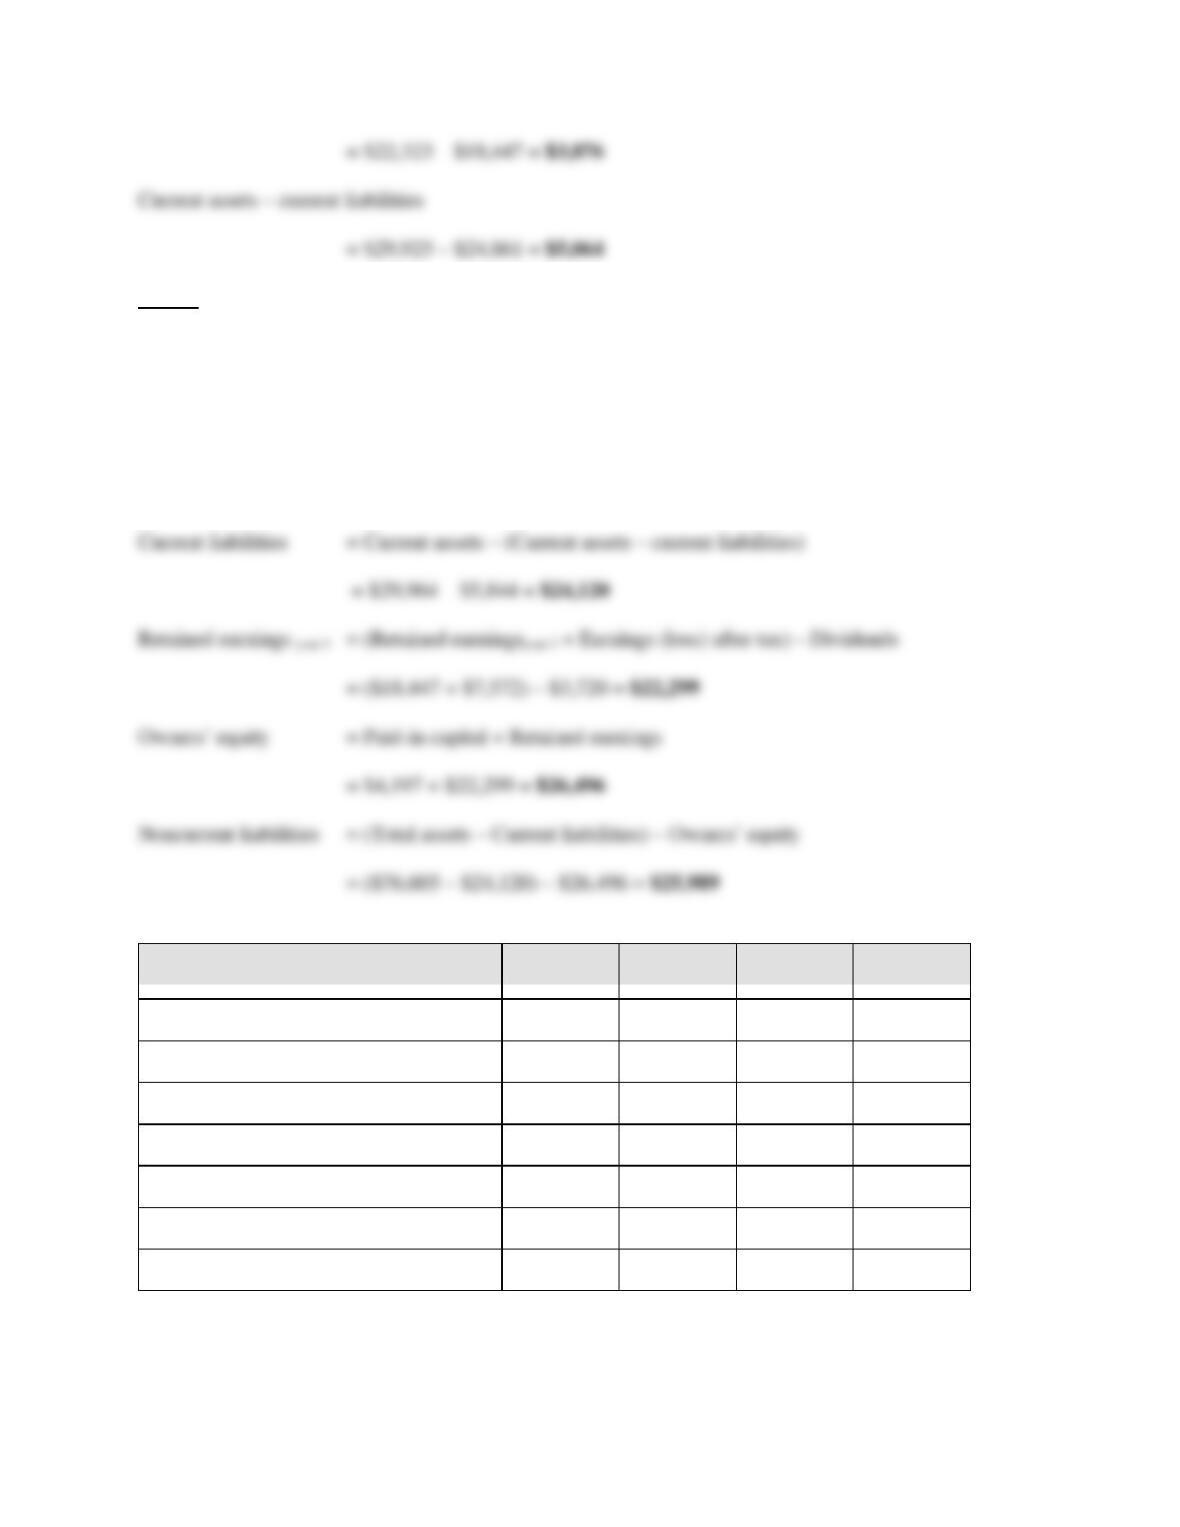
End-of-year for balance sheet items
Year 1
Year 2
Year 3
Year 4
Current assets
$25,305
$28,638
$29,925
$29,964
Noncurrent assets
36,099
43,437
44,880
46,641
Total assets
61,404
72,075
74,805
76,605
Current liabilities
20,199
22,926
24,861
24,120
Current assets – current liabilities
5,106
5,712
5,064
5,844
Noncurrent liabilities
17,997
21,936
27,621
25,989
Paid-in capital
3,051
3,447
3,876
4,197
2-8
Retained earnings
20,157
23,766
18,447
22,299
Earnings (loss) after tax
n. a.
n. a.
(1,968)
7,572
Dividends
n. a.
n. a.
3,351
3,720
Total liabilities and owners’ equity
61,404
72,075
74,805
76,605
b.
A large investment (e.g., the acquisition of another firm) would explain the increase in total assets
between years 1 and 2. A mix of debt and equity financing was used to finance the investment.
5. Balance sheet changes.
Figures in millions
a.
Year 1
Noncurrent assets = Total assets – Current assets
= $21,094 – $3,092 = $18,002
Year 2
Total assets = Total liabilities and owners’ equity
= $21,182
2-9
Year 3
Total assets = Current assets + Noncurrent assets
= $2,932 + $17,996 = $20,928
Year 4
Current assets = Current liabilities × (Current assets/current liabilities)
= $3,002 × 1.04 = $3,122
Total assets = Current assets + Noncurrent liabilities
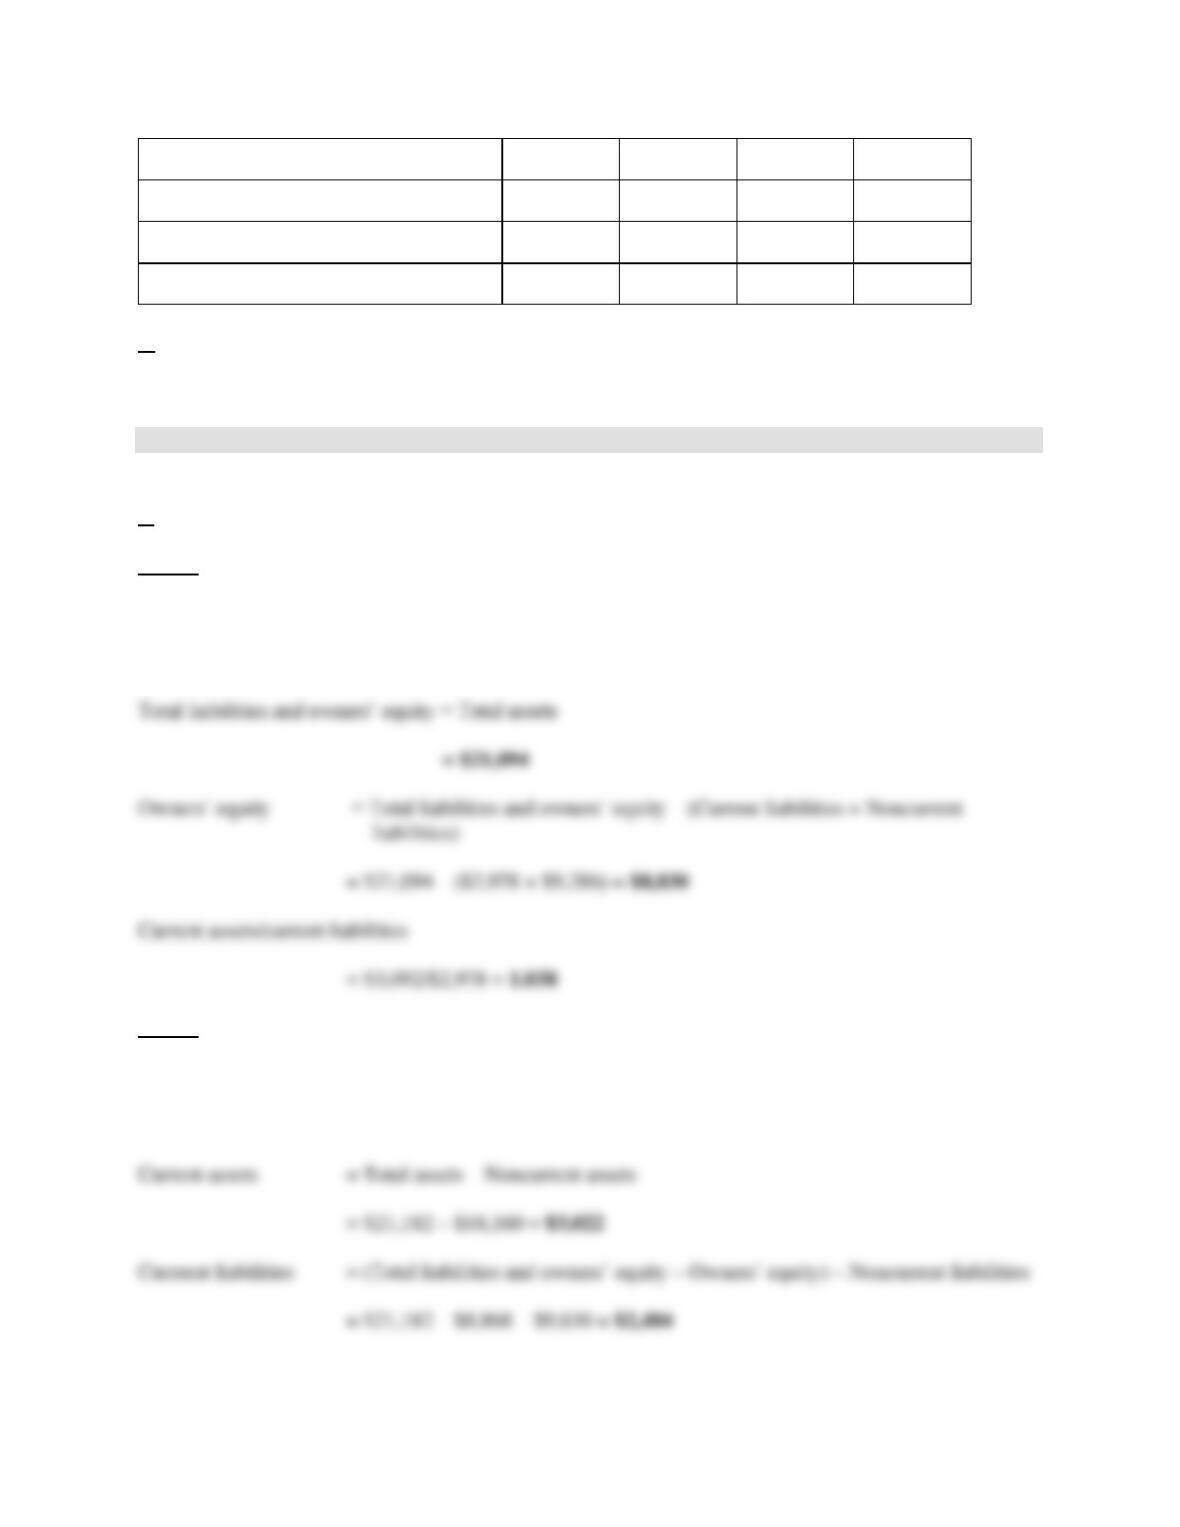
End-of-year for balance sheet items
Year 1
Year 2
Year 3
Year 4
Current assets
$ 3,092
$ 3,022
$ 2,932
$ 3,122
Noncurrent assets
18,002
18,160
17,996
20,286
Total assets
21,094
21,182
20,928
23,408
Current assets/current liabilities
1.038
1.217
1.023
1.04
Current liabilities
2,978
2,484
2,866
3,002
2-10
Noncurrent liabilities
9,286
9,830
10,004
12,322
Owners’ equity
8,830
8,868
8,058
8,084
Total liabilities and owners’ equity
21,094
21,182
20,928
23,408
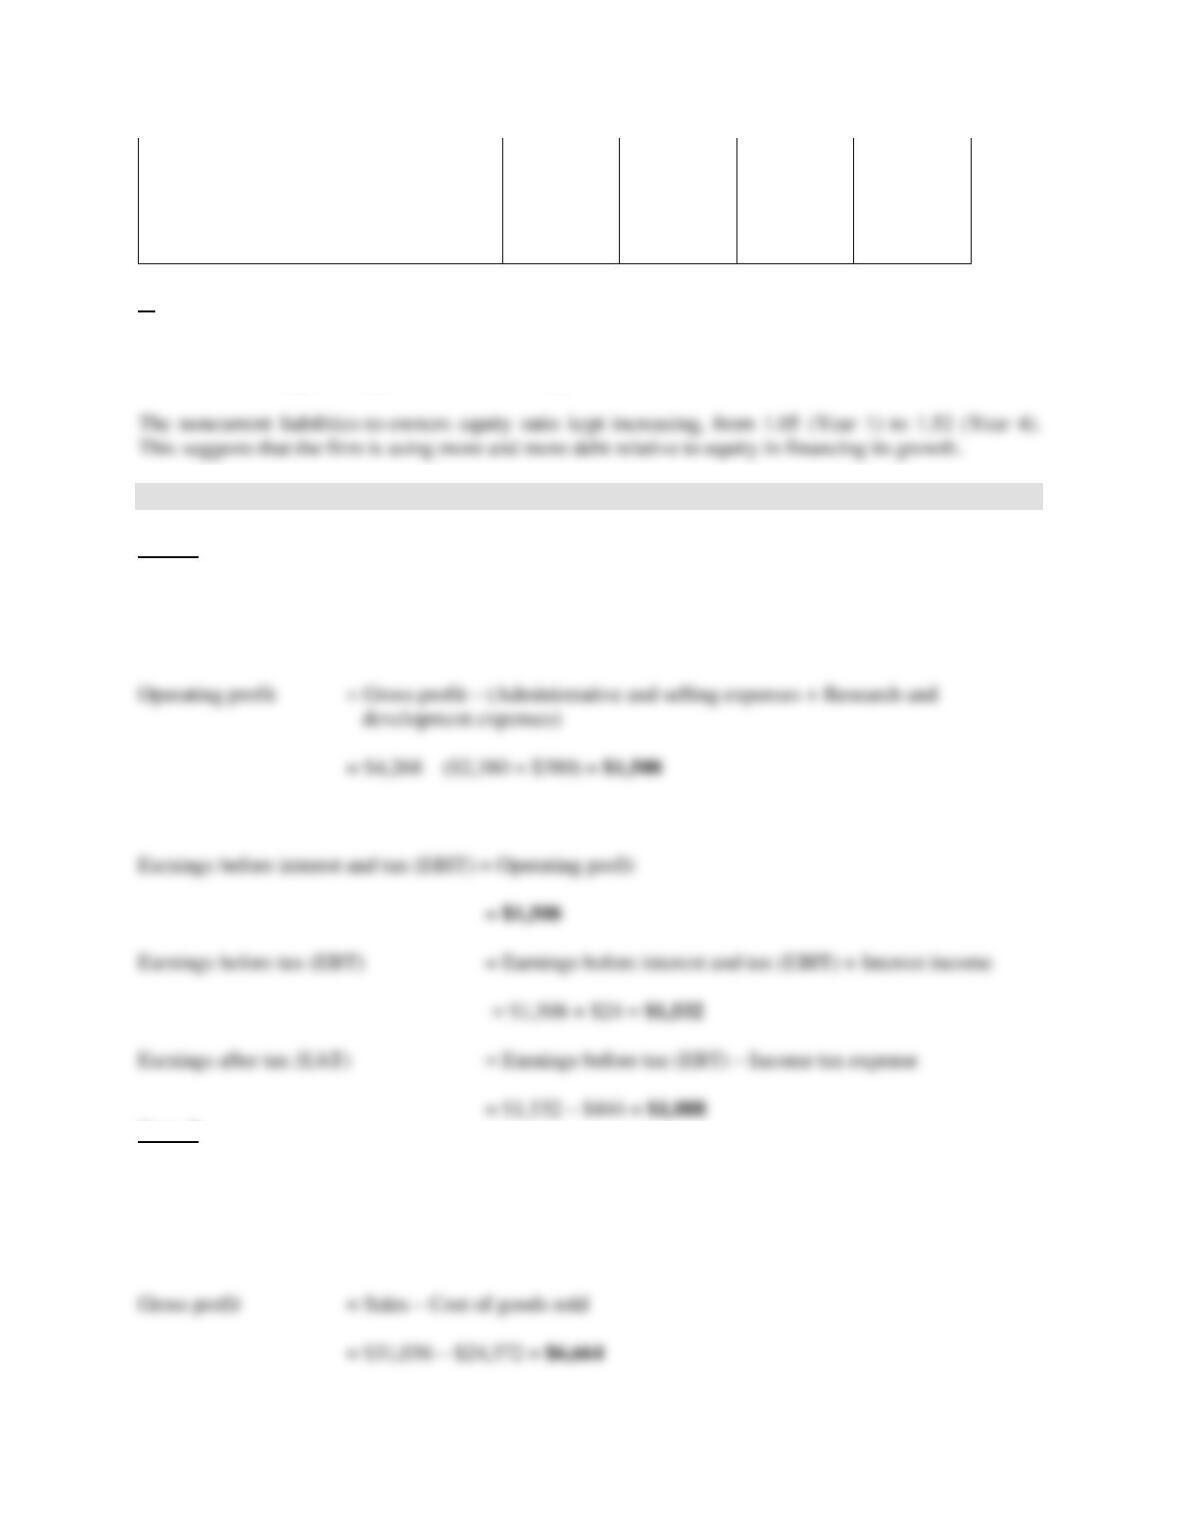
b.
The noncurrent assets (fixed assets)-to-current assets ratio stayed remarkably constant over the four-year
period, varying between 5.8 (Years 1, 2, and 3) and 6.5 (Year 4). The large value of this ratio indicates
that the firm belongs to a capital intensive industry.
6. Reconstructing an income statement.
Year 1
Gross profit = Sales – Cost of goods sold
= $21,184 – $16,916 = $4,268
Year 2
Sales = Earnings after tax + Income tax expense – Interest income + Research and development
expenses + Administrative and selling expenses + Cost of goods sold
= $2,124 + $864 – $132 + $504 + $3,304 + $24,372 = $31,036
2-11
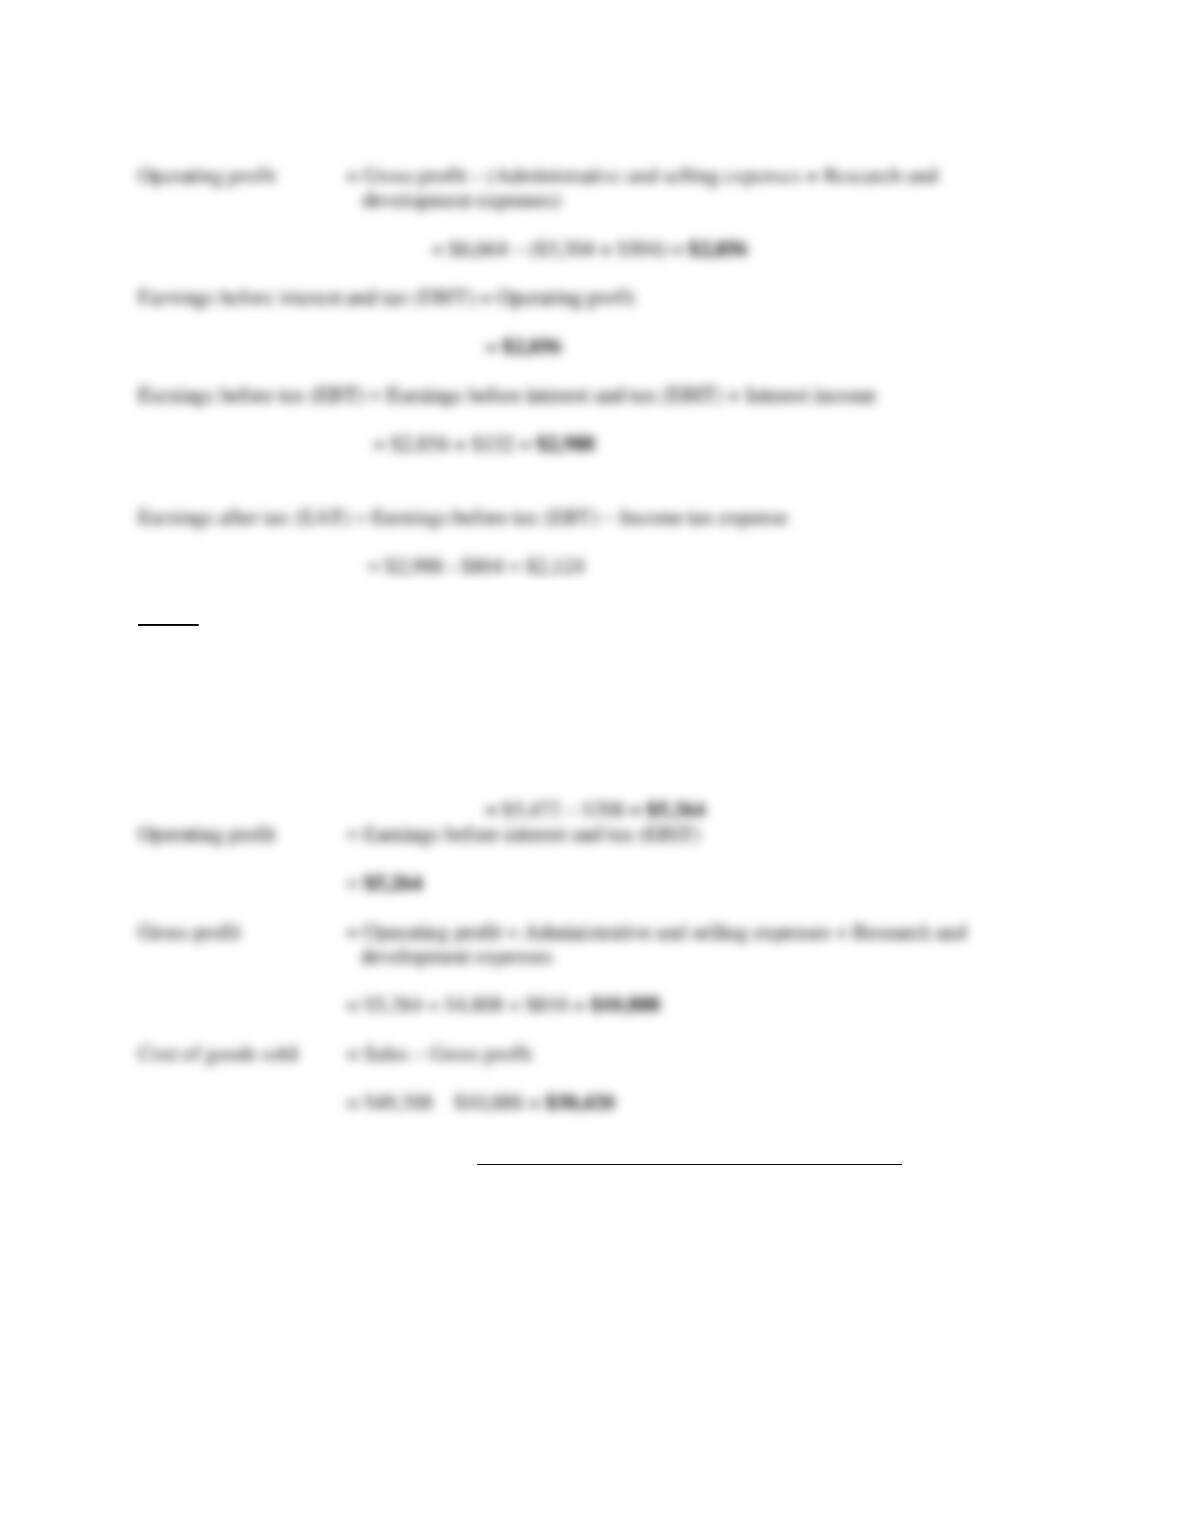
Year 3
Earnings before tax (EBT) = Earnings after tax (EAT) + Income tax expense
= $3,776 + $1,696 = $5,472
Earnings before interest and tax (EBIT) = Earnings before tax (EBT) – Interest income
Year 1 Year 2 Year 3
Sales $21,184 $31,036 $49,308
Cost of goods sold 16,916 24,372 38,420
Gross profit 4,268 6,664 10,888
Administrative and selling
expenses 2,380 3,304 4,808
2-12
7. Reconstructing an income statement.
Year 1
Gross profit = Sales – Cost of goods sold
= $21,087 – $16,182 = $4,905
Year 2
Earnings before tax (EBT) = Earnings after tax (EAT) + Income tax expense
= $408 + $252 = $660
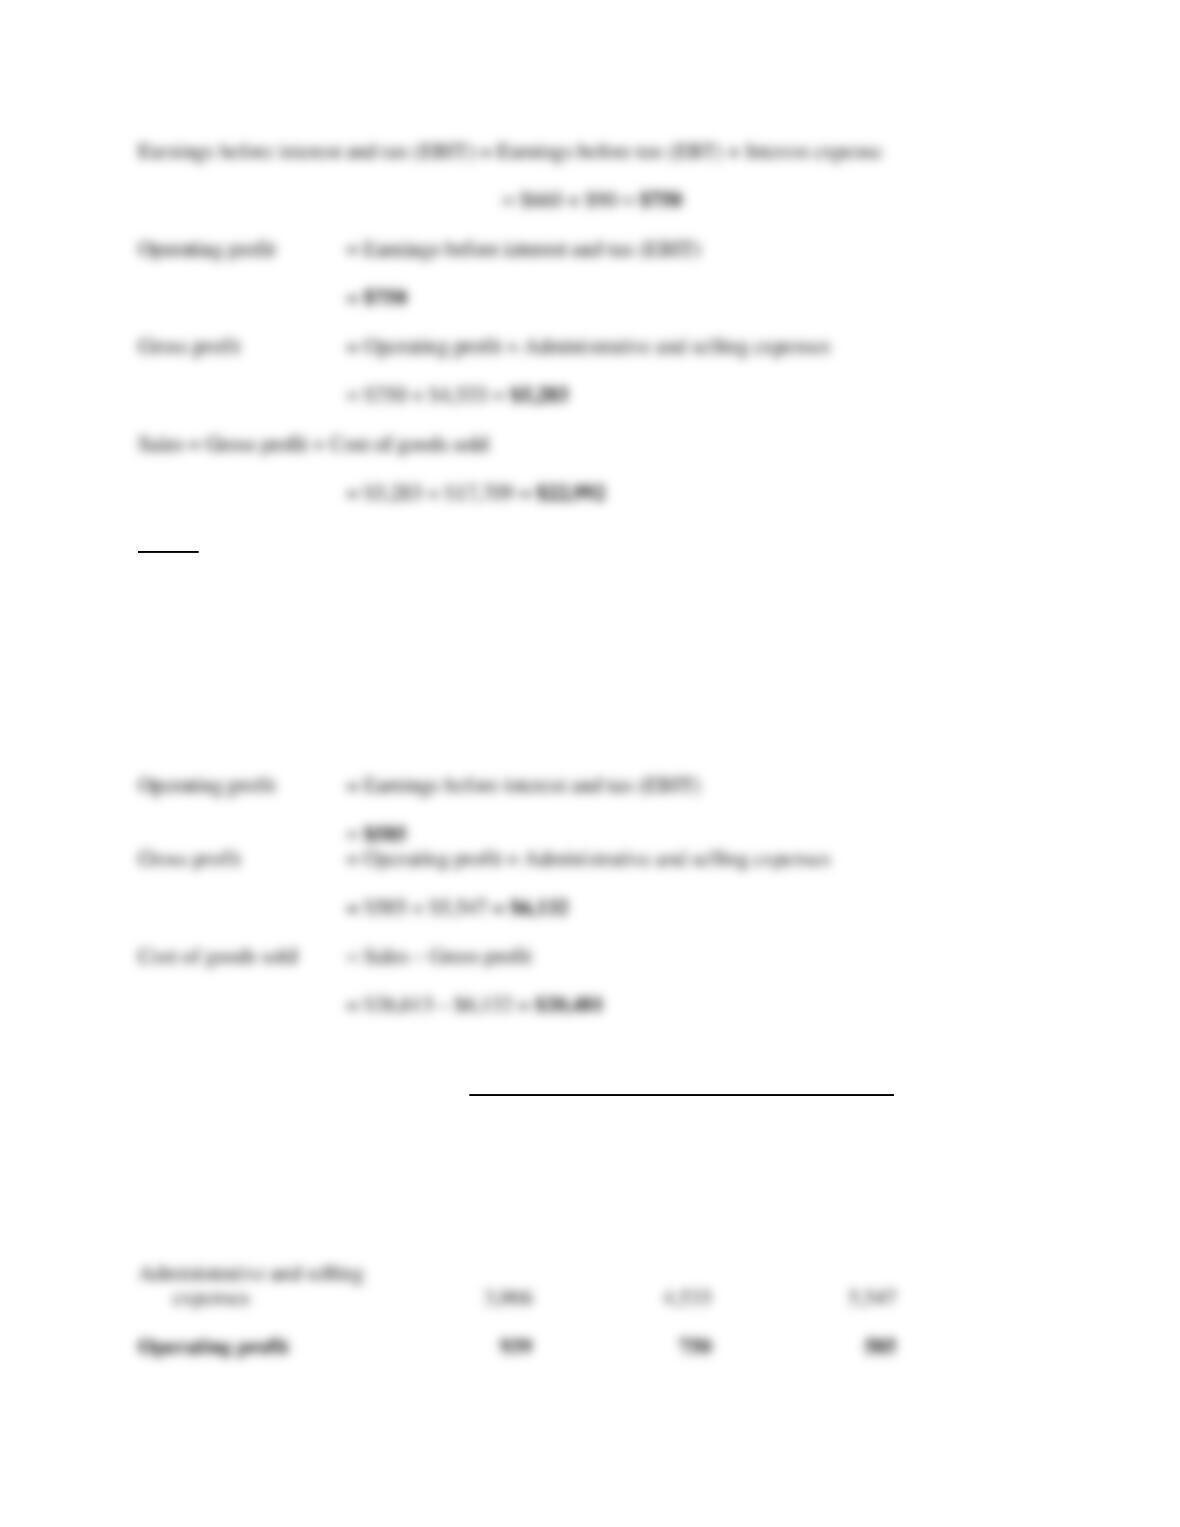
2-13
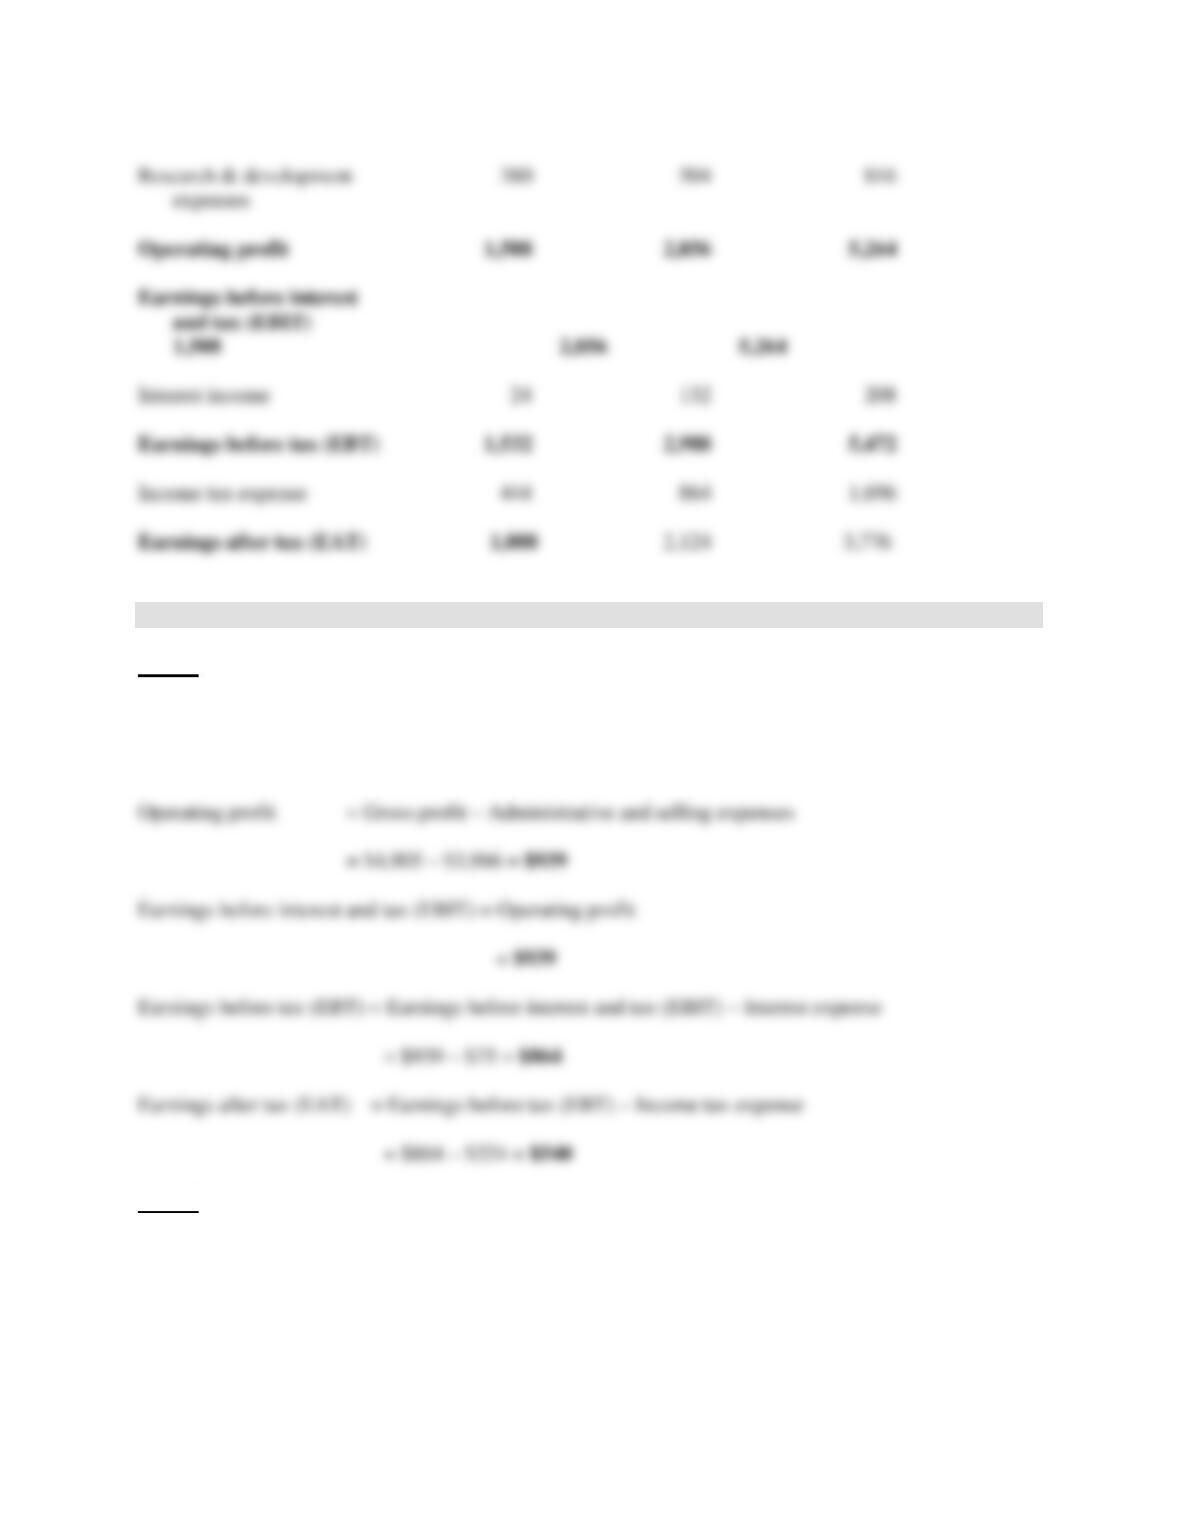
Year 3
Earnings before tax (EBT) = Earnings after tax (EAT) + Income tax expense
= $312 + $192 = $504
Earnings before interest and tax (EBIT) = Earnings before tax (EBT) + Interest expense
= $504 + $81 = $585
Year 1 Year 2 Year 3
Sales $21,087 $22,992 $26,613
Cost of goods sold 16,182 17,709 20,481
Gross profit 4,905 5,283 6,132
2-14
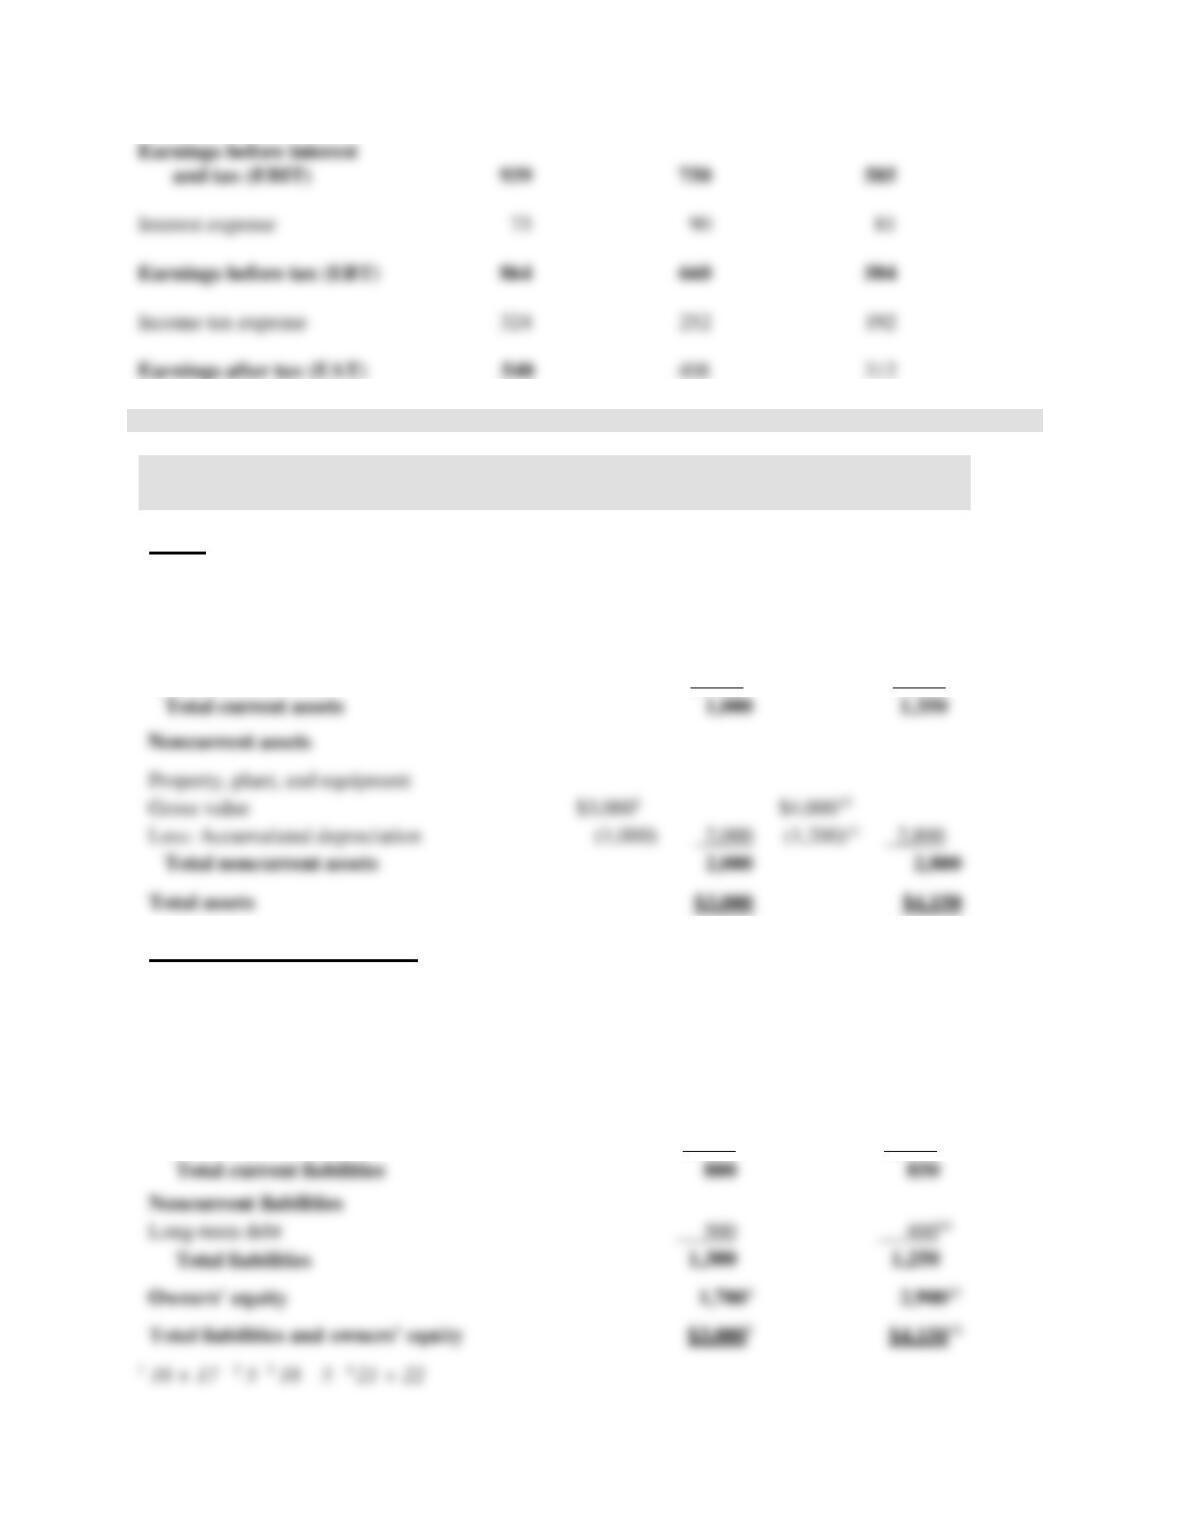
8. Reconstructing a balance sheet.
Beginning
of year
End
of year
Assets
Current assets
Cash
$ 450
$ 5007
Accounts receivable
250
4508
Inventories
300
4009
Noncurrent assets
Property, plant, and equipment
Gross value
$3,0001
$4,00010
Less: Accumulated depreciation
(1,200)11 2,800
Total assets
Liabilities and owners’ equity
Current liabilities
Short-term debt
$ 400
$ 15017
Owed to banks
$3003
$50
Current portion of long-term debt
1002
$15.0
1002
Accounts payable
3006
40012
Accrued expenses
100
30013
Noncurrent liabilities
Long-term debt
40014
Total liabilities
2-15
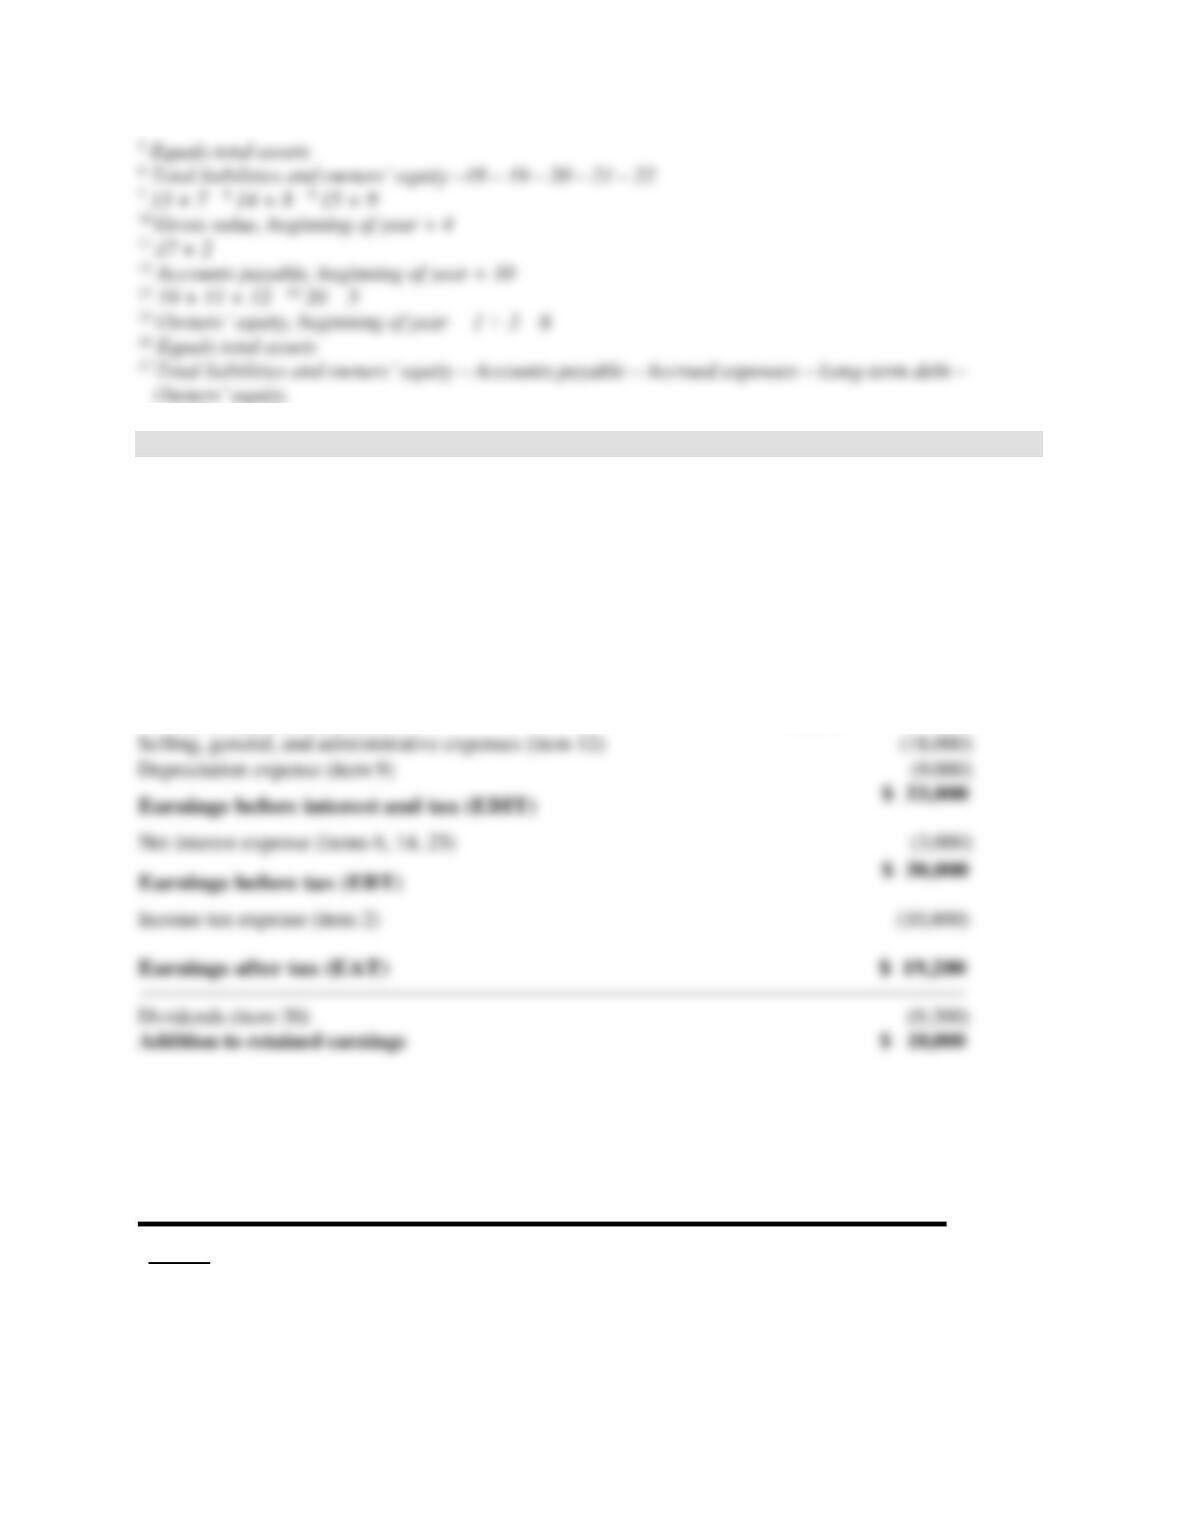
9. Constructing income statements and balance sheets.
VideoStores
Income Statement
For period ending 12/31/10
In thousands
Sales
(items
3,
18)
$ 320,000
Cost of goods sold
(260,000)
Material cost (item 5)
$224,000
Labor expenses (item 16)
36,000
Depreciation expense (item 9)
Net interest expense (items 6, 14, 25)
Dividends (item 20)
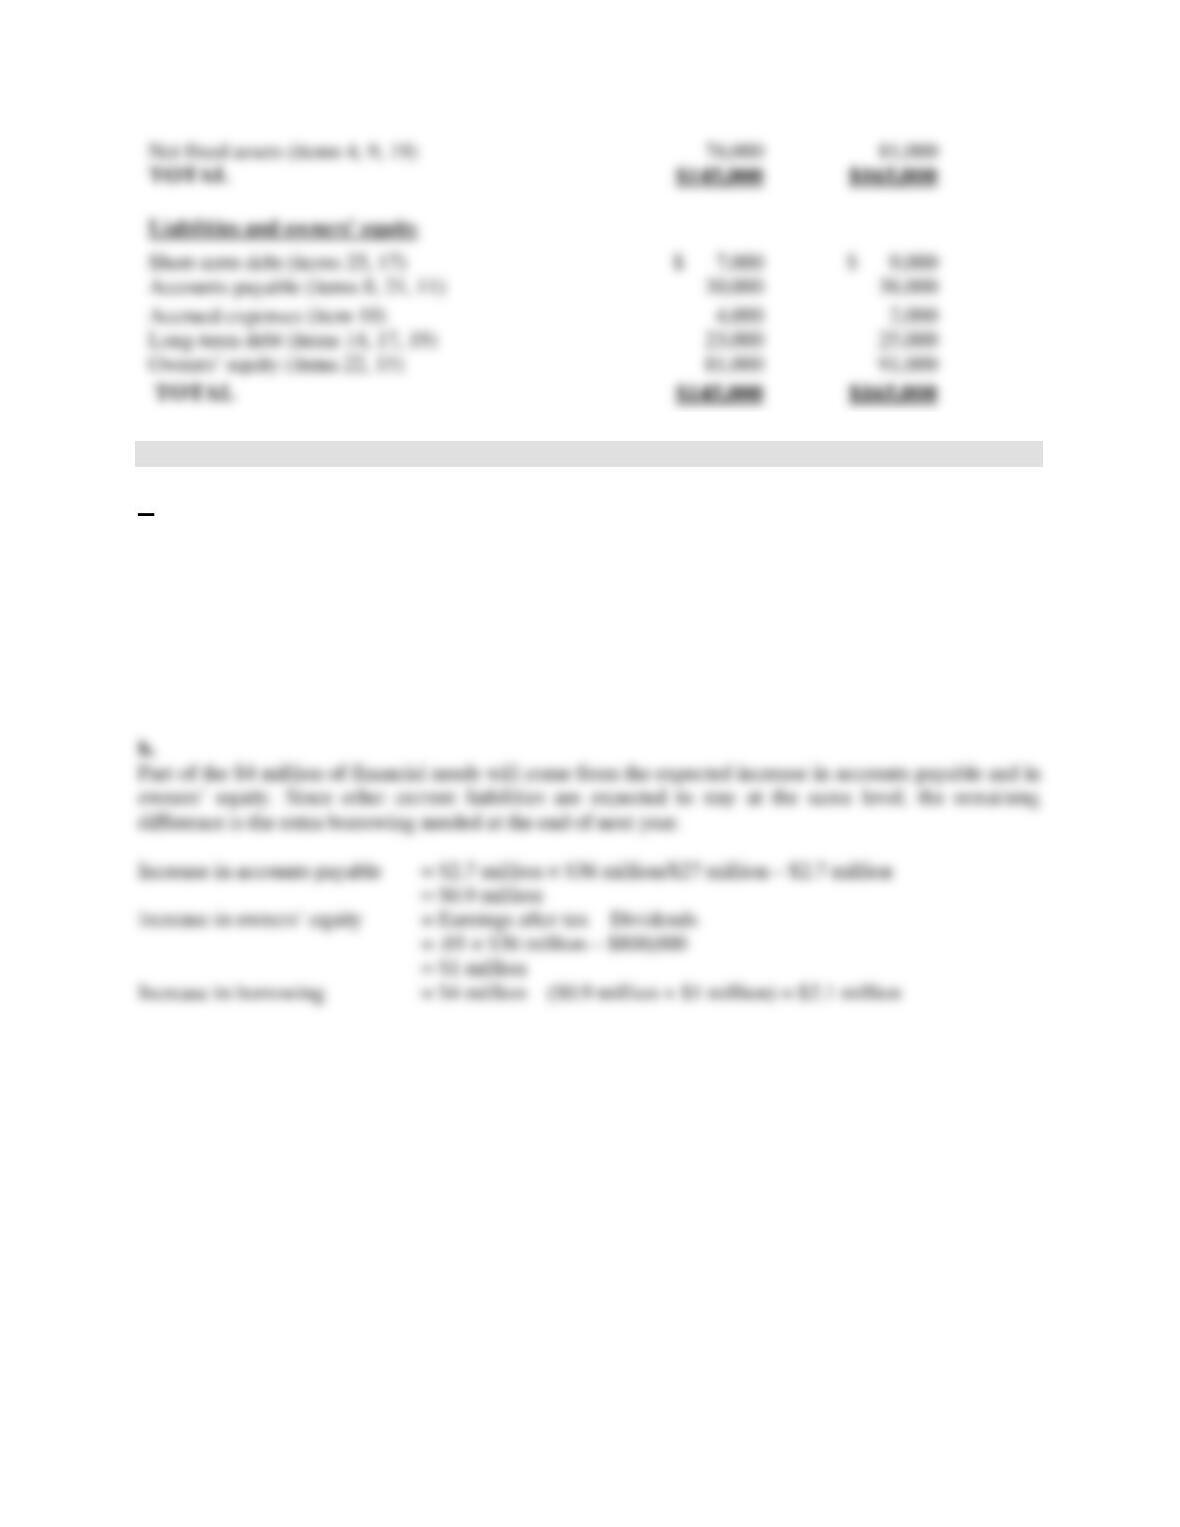
VideoStores
Balance Sheets
December 31, 2009 and 2010
In thousands
12/31/09
12/31/10
Assets
Cash (item 23)
$ 7,500
$ 11,400
Accounts receivable (items 7, 1)
32,000
38,400
Inventories (item 18)
28,000
32,000
Prepaid expenses (item 26)
1,500
2,200
2-16
10. Forecasting financing needs.
a.
Financing needs = Capital expenditures + Increase in current assets
Capital expenditures = $1 million
Increase in current assets = $9 million × Percentage increase in sales
= $9 million × ($36 million – $27 million)/$27 million
= $3 million
Financing needs = $1 million + $3 million
= $4 million