Multiple Choice Test Bank Questions No Feedback – Chapter 2
Correct answers denoted by an asterisk.
1. The linear relationship between two variables (y and x) can be represented by the
equation
y a bx=+
. Which of the following statements is true?
(I) Parameter a is termed the intercept
(II) Parameter a is termed the slope
(III) Parameter b is termed the gradient
(IV) Parameter b is termed the constant
2. Assume that the relationship between a company’s stock price (y) and dividends paid
per share (x) is linear. If the slope of the equation is 0.50 and the intercept is 30, what
would be the expected stock price if the dividend paid was 3?
3. Which of the following values are closes to the roots of the following quadratic
equation:
241y x x= − +
?
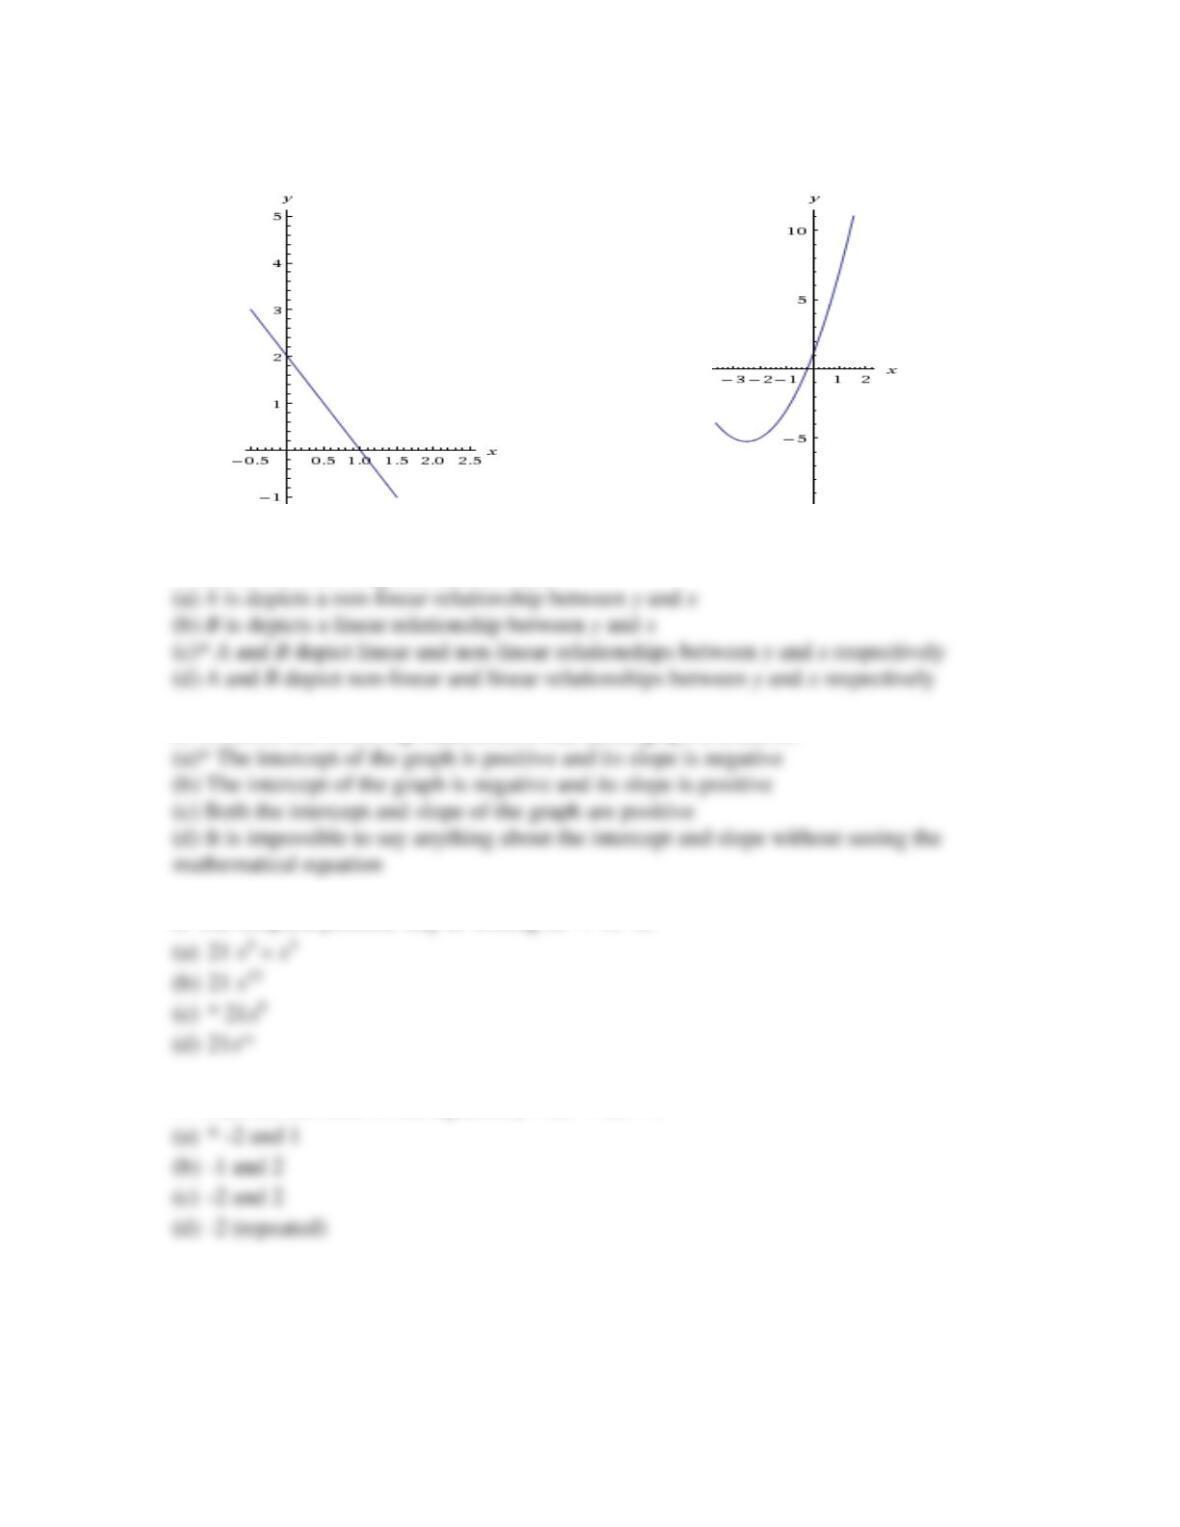
4. Consider the following graphs.
(A) (B)
Which of the following statements is true?
5. Which of the following statements is true about graph (A) above?
6. The simplest possible way of writing 3x5 7x3 is:
7. What are the roots of the equation y = 2x2 + 2x – 4?
8. What are the roots of the equation y = x2 + 2x – 6 closest to?
9. “x to the power 3” could be written:
10. Another way of writing elog(x) is:
11. Log(1) is:
12. Writing out all the terms in the expression
= =
2
1
2
1i j ij
x
would lead to:
13.
=
5
1i
y
is equal to:
14. What is the (first order) derivative of the function
241y x x= − +
?
15. What is the second order derivative of the function
4 3 2
6 3 4 2y x x x= + + +
?
16. The derivative of log(5x) is:
17. The derivative of e4x-2 is:
18. If A is of dimension 1 4 and B is of dimension 4 1, what is the most accurate term
to describe the result of the matrix multiplication AB?
19. If matrices
31
2 4 6
22
A
=
and
4
48
B
=
, what is AB?
20. The rank of matrices A and B from the previous question are:
21. For two conformable matrices A and B, expanding the parentheses of (AB)-1 gives:
22. What is the inverse of matrix
31
46
C
=
?
23. The rank of a square matrix is also:
24. The trace of matrix C is
25. The point where the capital market line is tangential to the efficient frontier is
26. The central limit theorem states that
27. Consider the following data series: 11, 10, 6, 8, 4, 3, 7. What is its semi-interquartile
range of this series?
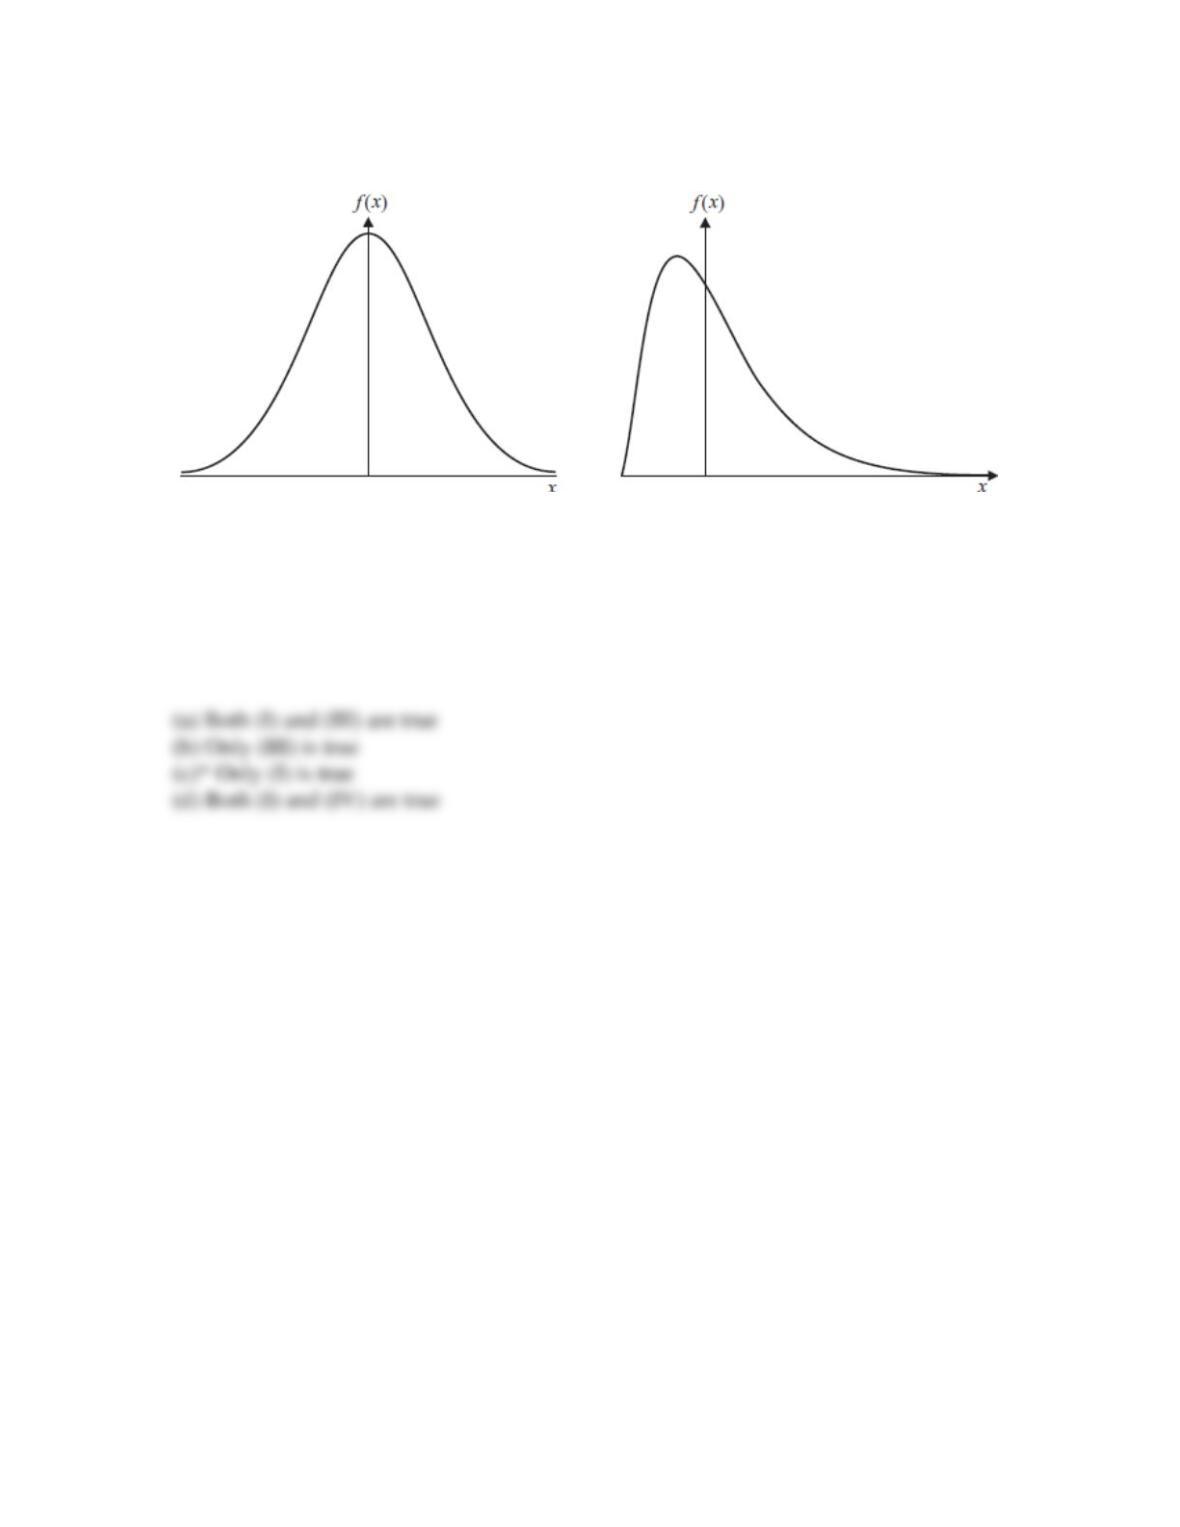
28. Consider the following two graphs:
(A) (B)
Which of the following statements is true if A represents a normal distribution?
(I) The skewness of the distribution plot A is 0 and its kurtosis is 3
(II) The skewness of the distribution plot B is 0 and its kurtosis is 3
(III) The excess kurtosis of the distribution plot A is 3
(IV) The excess kurtosis of the distribution plot B is 0