
1
Corporate Finance, 4e (Berk / DeMarzo)
Chapter 19 Valuation and Financial Modeling: A Case Study
19.1 Valuation Using Comparables
Use the tables for the question(s) below.
Estimated 2005 Income Statement and Balance Sheet Data for Ideko Corporation
Year
2005
Year
2005
Income Statement
($ 000)
Balance Sheet ($ 000)
1 Sales
75,000
Assets
2 Cost of Goods Sold
1 Cash and Equivalents
12,664
3 Raw Materials
(16,000)
2 Accounts Receivable
18,493
4 Direct Labor Costs
(18,000)
3 Inventories
6165
5 Gross Profit
1000
4 Total Current Assets
37,322
6 Sales and Marketing
(11,250)
5 Property, Plant, and Equipment
49,500
7 Administrative
(13,500)
6 Goodwill
—
8 EBITDA
16,250
7 Total Assets
86,822
9 Depreciation
(5500)
Liabilities and Stockholder’s Equity
10 EBIT
10,750
8 Accounts Payable
4654
11 Interest Expense (net)
(75)
9 Debt
4500
12 Pre-tax Income
10,675
10 Total Liabilities
9154
13 Income Tax
(3736)
11 Stockholder’s Equity
77,668
14 Net Income
6939
12 Total Liabilities and Equity
86,822
The following are financial ratios for three comparable companies:
Ratio
Oakley, Inc.
Luxottica
Group
Nike, Inc.
P/E
24.8x
28x
18.2x
EV/Sales
2x
2.7x
1.5x
EV/EBITDA
11.6x
14.4x
9.3x
EBITDA/Sales
17.0%
18.5%
15.9
1) Based upon the average P/E ratio of the comparable firms, Ideko’s target market value of equity is
closest to:
A) $157 million
B) $155 million
C) $193 million
D) $165 million
2) Based upon the average EV/Sales ratio of the comparable firms, Ideko’s target economic value is
closest to:
A) $191 million
B) $155 million
C) $165 million
D) $157 million
3) Based upon the average EV/Sales ratio of the comparable firms, if Ideko holds $6.5 million of cash in
excess of its working capital needs, then Ideko’s target market value of equity is closest to:
A) $165 million
B) $157 million
C) $193 million
D) $191 million
4) Based upon the average EV/EBITDA ratio of the comparable firms, Ideko’s target economic value is
closest to:
A) $191 million
B) $155 million
C) $157 million
D) $193 million
5) Based upon the average EV/EBITDA ratio of the comparable firms, if Ideko holds $6.5 million of cash
in excess of its working capital needs, then Ideko’s target market value of equity is closest to:
A) $155 million
B) $157 million
C) $165 million
D) $193 million
6) What range for the market value of equity for Ideko is implied by the range of P/E multiples for the
comparable firms?
7) What range for the market value of equity for Ideko is implied by the range of EV/Sales multiples for
the comparable firms if Ideko holds $6.5 million of cash in excess of its working capital needs?
8) What range for the market value of equity for Ideko is implied by the range of EV/EBITDA multiples
for the comparable firms if Ideko holds $6.5 million of cash in excess of its working capital needs?
19.2 The Business Plan
Use the following information to answer the question(s) below:
Ideko’s Planned Debt
Year
2005
2006
2007
2008
2009
2010
Outstanding Debt
100,000
100,000
100,000
115,000
120,000
120,000
1) If Ideko’s loans will have an interest rate of 6.8%, then the interest expense paid in 2008 is closest to:
A) $6800
B) $7310
C) $7820
D) $7990
2) If Ideko’s loans will have an interest rate of 6.8%, then the interest expense paid in 2009 is closest to:
A) $6800
B) $7310
C) $7820
D) $7990
Use the table for the question(s) below.
Ideko Sales and Operating Cost Assumptions
Year
2005
2006
2007
2008
2009
2010
Sales Data
Growth/Year
1 Market Size (000 units)
5.0%
10,000
10,500
11,025
11,576
12,155
12,763
2 Market Share
1.0%
10.0%
11.0%
12.0%
13.0%
14.0%
15.0%
3 Average Sales Price
($/unit)
2.0%
75.00
76.50
78.03
79.59
81.18
82.81
Cost of Goods Data
4 Raw Materials ($/unit)
1.0%
16.00
16.16
16.32
16.48
16.65
16.82
5 Direct Labor Costs
($/unit)
4.0%
18.00
18.72
19.47
20.25
21.06
21.90
Operating Expense
and Tax Data
6 Sales and Marketing
(% sales)
15.0%
16.5%
18.0%
19.5%
20.0%
20.0%
7 Administrative (% sales)
18.0%
15.0%
15.0%
14.0%
13.0%
13.0%
8 Tax Rate
35.0%
35.0%
35.0%
35.0%
35.0%
35.0%
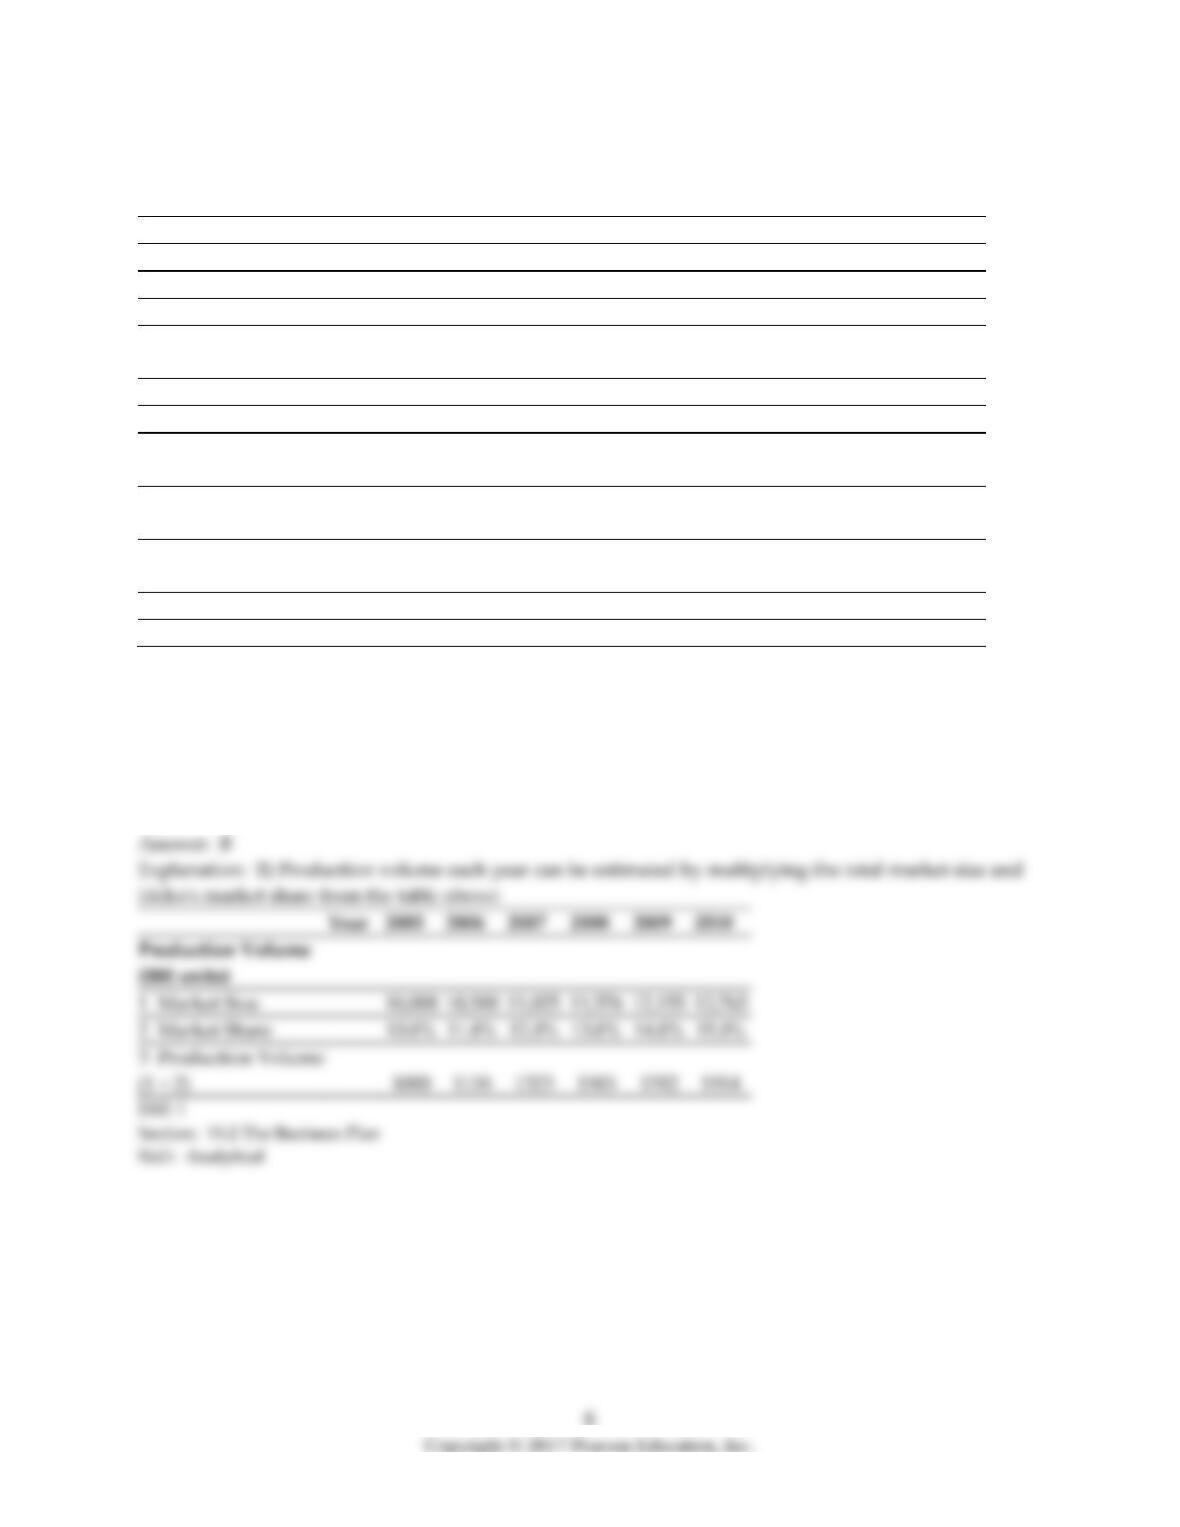
3) Based upon Ideko’s Sales and Operating Cost Assumptions, what production capacity will Ideko
require in 2007?
A) 1505 units
B) 1323 units
C) 1914 units
D) 1115 units
1 Market Size
2 Market Share
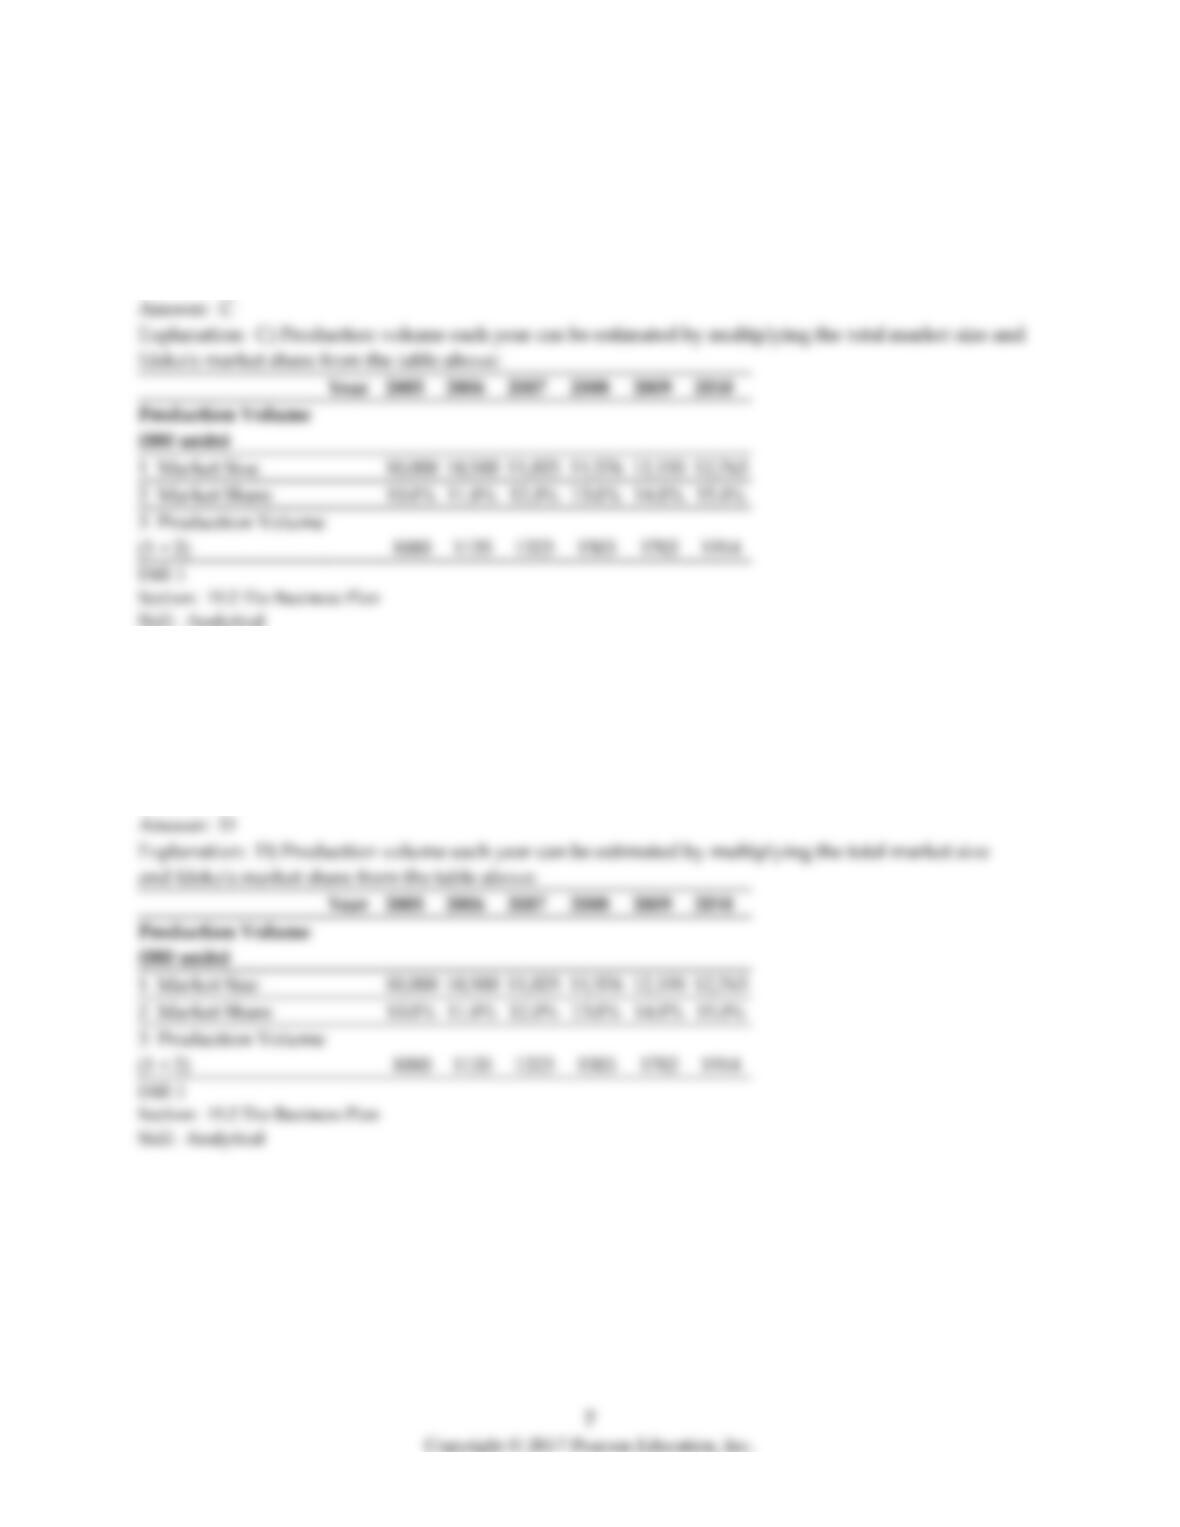
4) Based upon Ideko’s Sales and Operating Cost Assumptions, what production capacity will Ideko
require in 2008?
A) 1702 units
B) 1323 units
C) 1505 units
D) 1914 units
5) Based upon Ideko’s Sales and Operating Cost Assumptions, what production capacity will Ideko
require in 2009?
A) 1505 units
B) 1115 units
C) 1323 units
D) 1702 units
Use the tables for the question(s) below.
Estimated 2005 Income Statement and Balance Sheet Data for Ideko Corporation
Year
2005
Year
2005
Income Statement
($ 000)
Balance Sheet ($ 000)
1 Sales
75,000
Assets
2 Cost of Goods Sold
1 Cash and Equivalents
12,664
3 Raw Materials
(16,000)
2 Accounts Receivable
18,493
4 Direct Labor Costs
(18,000)
3 Inventories
6165
5 Gross Profit
1000
4 Total Current Assets
37,322
6 Sales and Marketing
(11,250)
5 Property, Plant, and Equipment
49,500
7 Administrative
(13,500)
6 Goodwill
—
8 EBITDA
16,250
7 Total Assets
86,822
9 Depreciation
(5500)
Liabilities and Stockholder’s Equity
10 EBIT
10,750
8 Accounts Payable
4654
11 Interest Expense (net)
(75)
9 Debt
4500
12 Pre-tax Income
10,675
10 Total Liabilities
9154
13 Income Tax
(3736)
11 Stockholder’s Equity
77,668
14 Net Income
6939
12 Total Liabilities and Equity
86,822
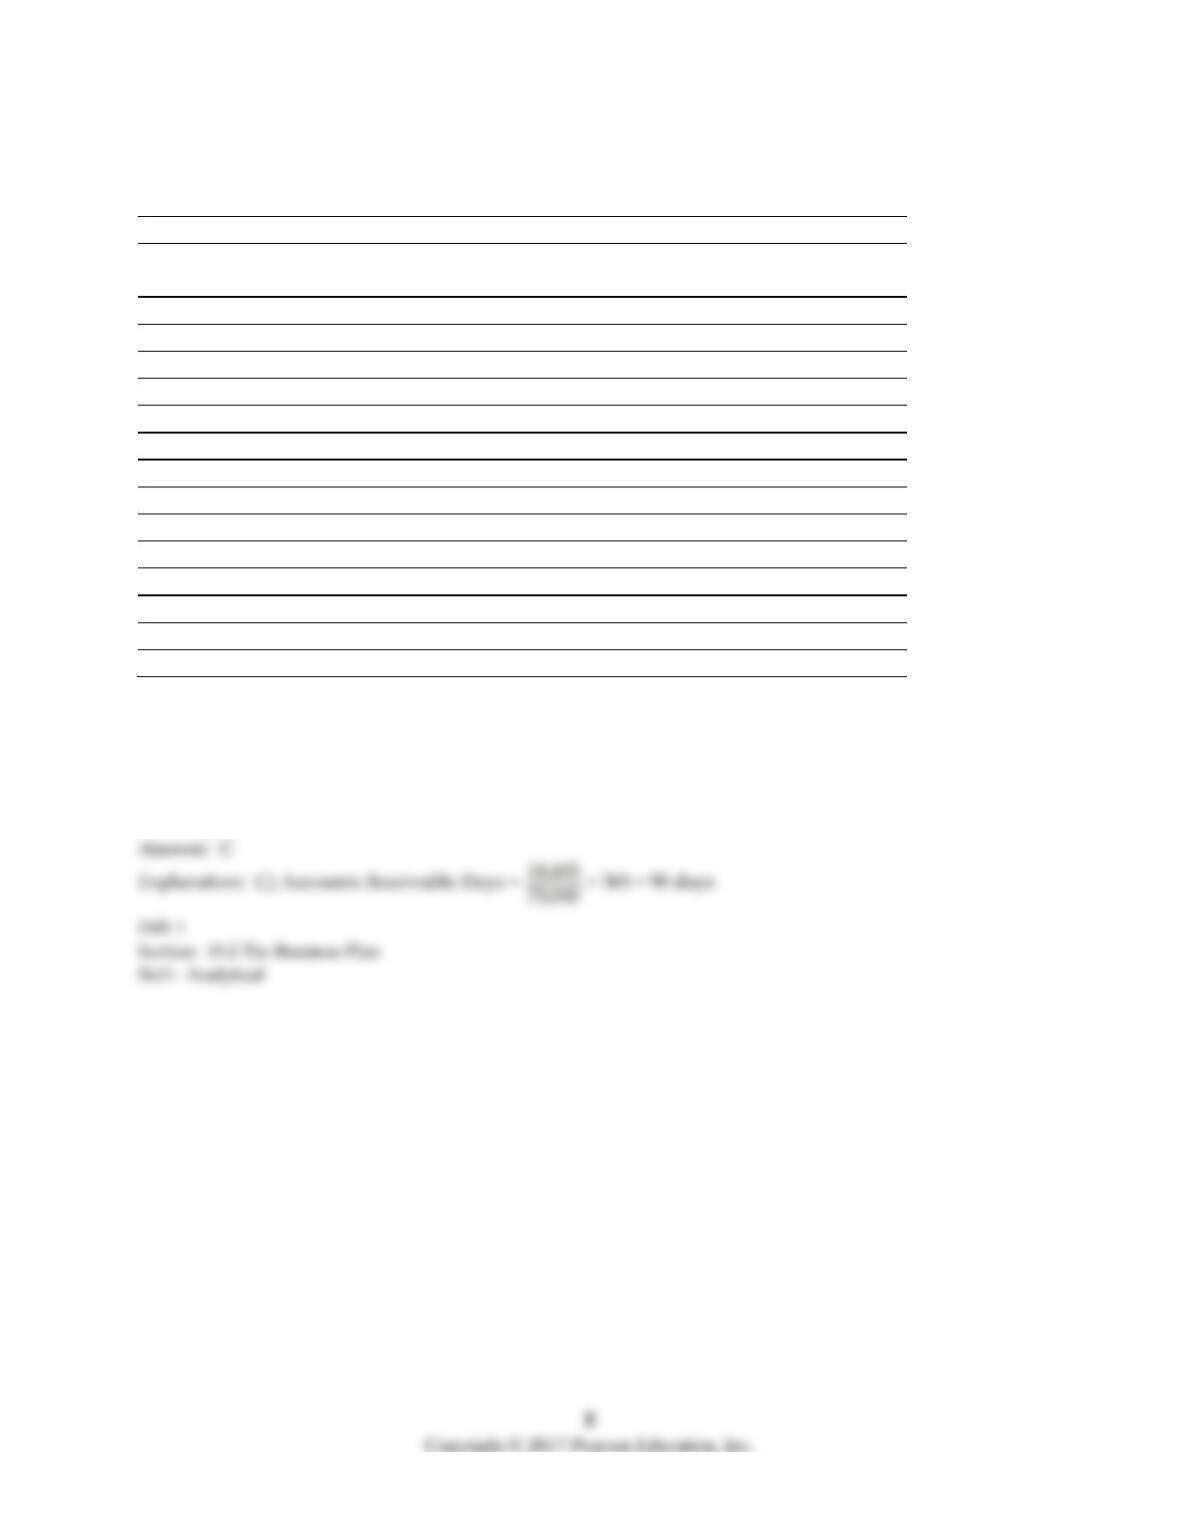
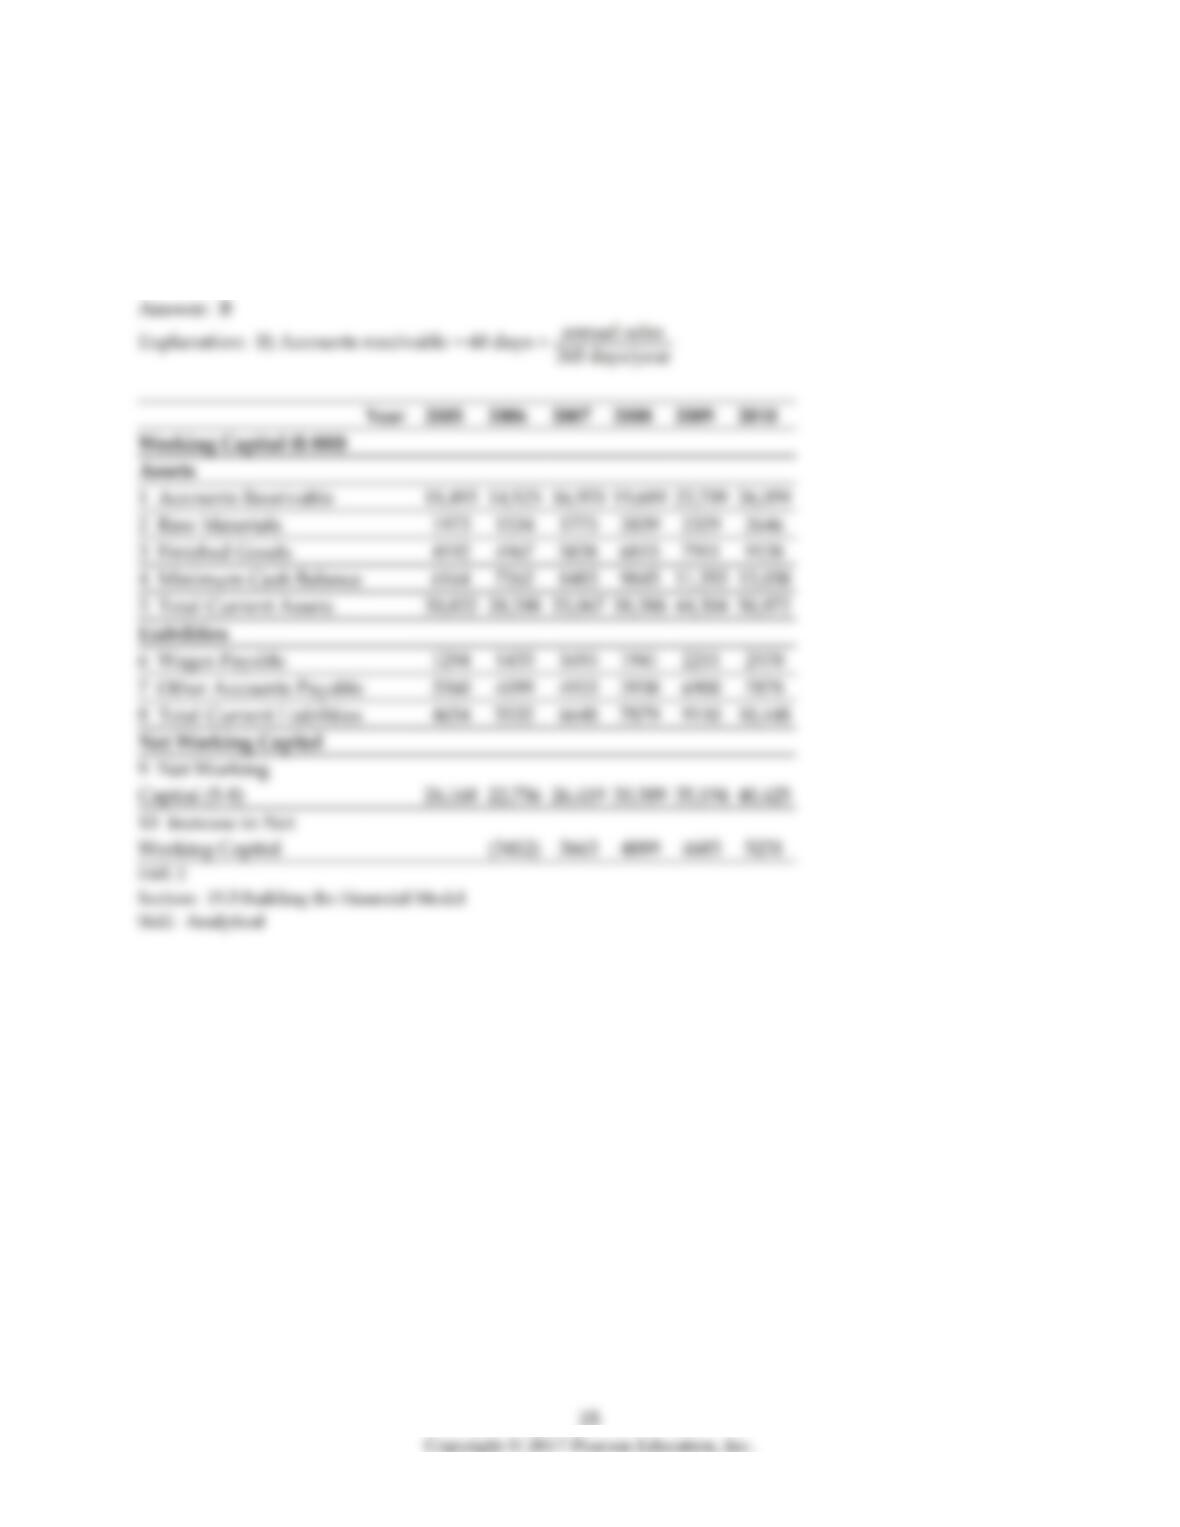
6) Ideko’s Accounts Receivable Days is closest to:
A) 84 days
B) 95 days
C) 90 days
D) 75 days
19.3 Building the Financial Model
Use the following information to answer the question(s) below:
1) The after tax interest expense in 2008 is closest to:
A) 2380
B) 4420
C) 6800
D) 7820
2) The free cash flow to the firm in 2008 is closest to:
A) -5005
B) -1755
C) 5575
D) 14,995
3) The free cash flow to equity in 2008 is closest to:
A) -5005
B) -1755
C) 5575
D) 9995
4) The after tax interest expense in 2010 is closest to:
A) 0
B) 2856
C) 5304
D) 8160
5) The free cash flow to the firm in 2010 is closest to:
A) 10,684
B) 11,559
C) 23,698
D) 26,394
6) The free cash flow to equity in 2010 is closest to:
A) 6255
B) 10,684
C) 11,559
D) 18,394

12
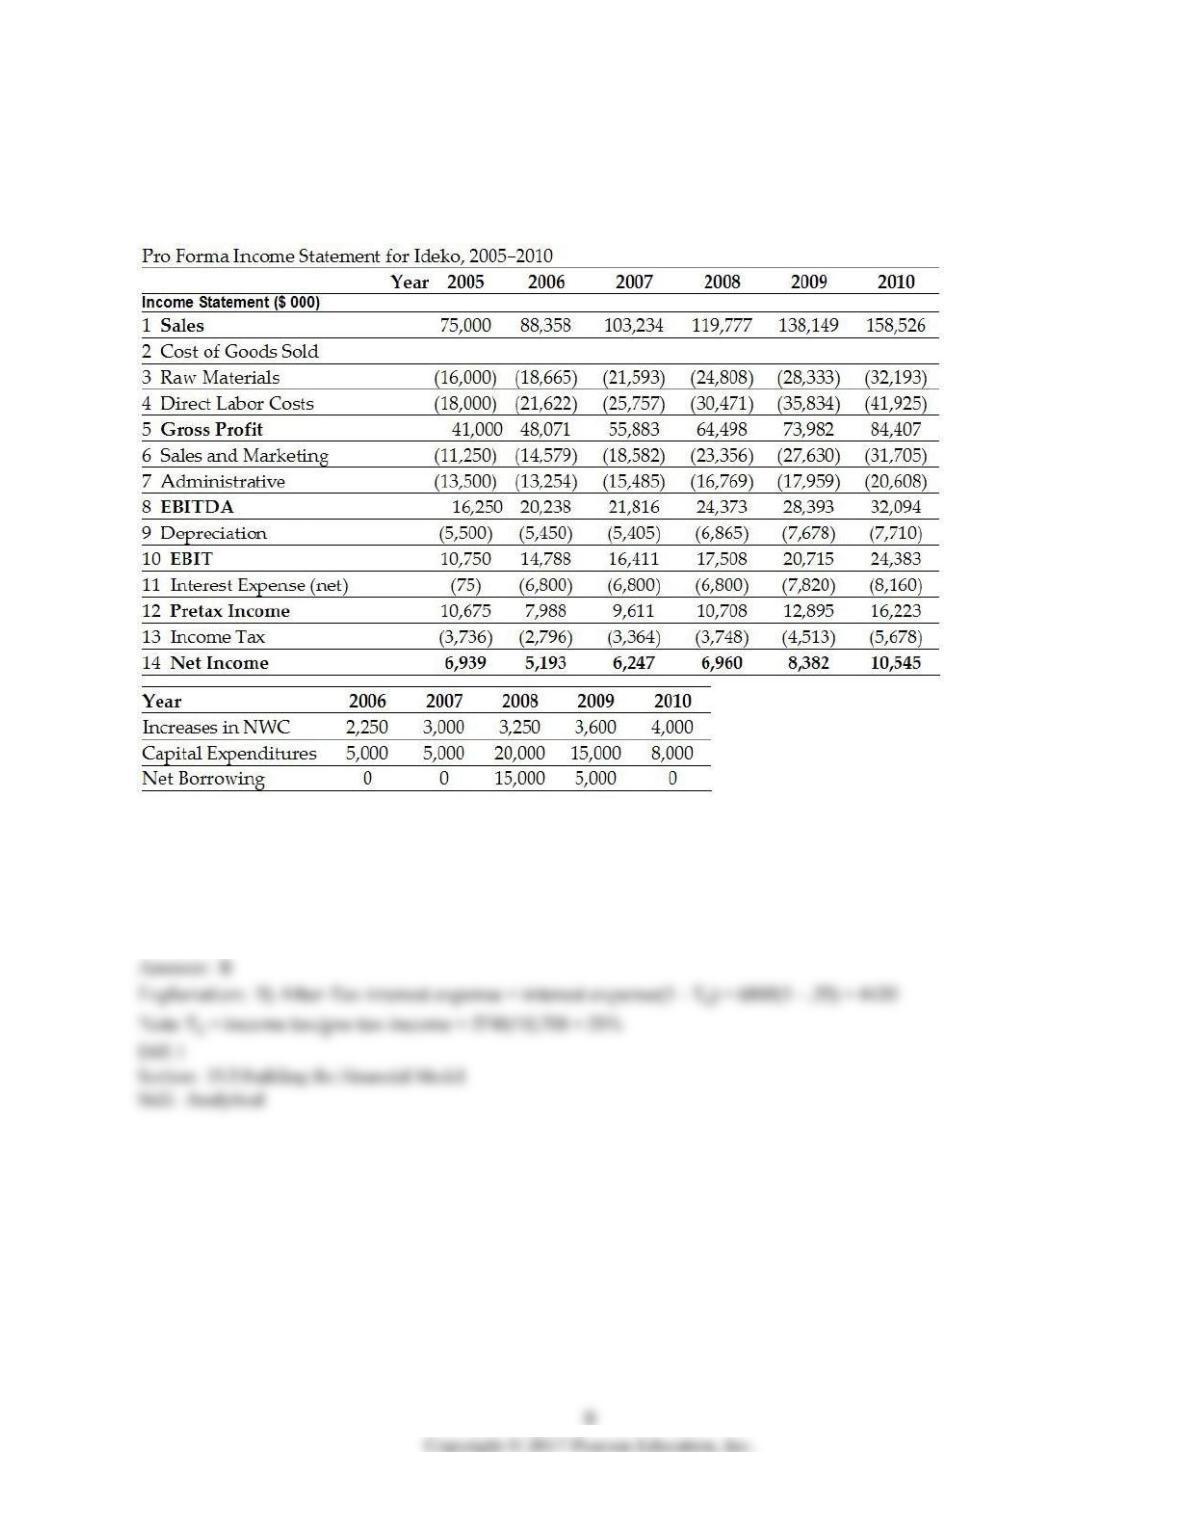
Use the table for the question(s) below.
Pro Forma Income Statement for Ideko, 2005-2010
Year
2005
2006
2007
2008
2009
2010
Income Statement ($ 000)
1 Sales
75,000
88,358
103,234
119,777
138,149
158,526
2 Cost of Goods Sold
3 Raw Materials
(16,000)
(18,665)
(21,593)
(24,808)
(28,333)
(32,193)
4 Direct Labor Costs
(18,000)
(21,622)
(25,757)
(30,471)
(35,834)
(41,925)
5 Gross Profit
41,000
48,071
55,883
64,498
73,982
84,407
6 Sales and Marketing
(11,250)
(14,579)
(18,582)
(23,356)
(27,630)
(31,705)
7 Administrative
(13,500)
(13,254)
(15,485)
(16,769)
(17,959)
(20,608)
8 EBITDA
16,250
20,238
21,816
24,373
28,393
32,094
9 Depreciation
(5500)
(5450)
(5405)
(6865)
(7678)
(7710)
10 EBIT
10,750
14,788
16,411
17,508
20,715
24,383
11 Interest Expense (net)
(75)
(6800)
(6800)
(6800)
(7820)
(8160)
12 Pre-tax Income
10,675
7988
9611
10,708
12,895
16,223
13 Income Tax
(3736)
(2796)
(3364)
(3748)
(4513)
(5678)
14 Net Income
6939
5193
6247
6960
8382
10,545
7) With the proper changes it is believed that Ideko’s credit policies will allow for an account receivables
days of 60. The forecasted accounts receivable for Ideko in 2006 is closest to:
A) $19,690
B) $16,970
C) $22,710
D) $14,525
8) With the proper changes it is believed that Ideko’s credit policies will allow for an account receivables
days of 60. The forecasted accounts receivable for Ideko in 2007 is closest to:
A) $14,525
B) $16,970
C) $22,710
D) $19,690
9) With the proper changes it is believed that Ideko’s credit policies will allow for an account receivables
days of 60. The forecasted accounts receivable for Ideko in 2008 is closest to:
A) $14,525
B) $19,690
C) $22,710
D) $16,970
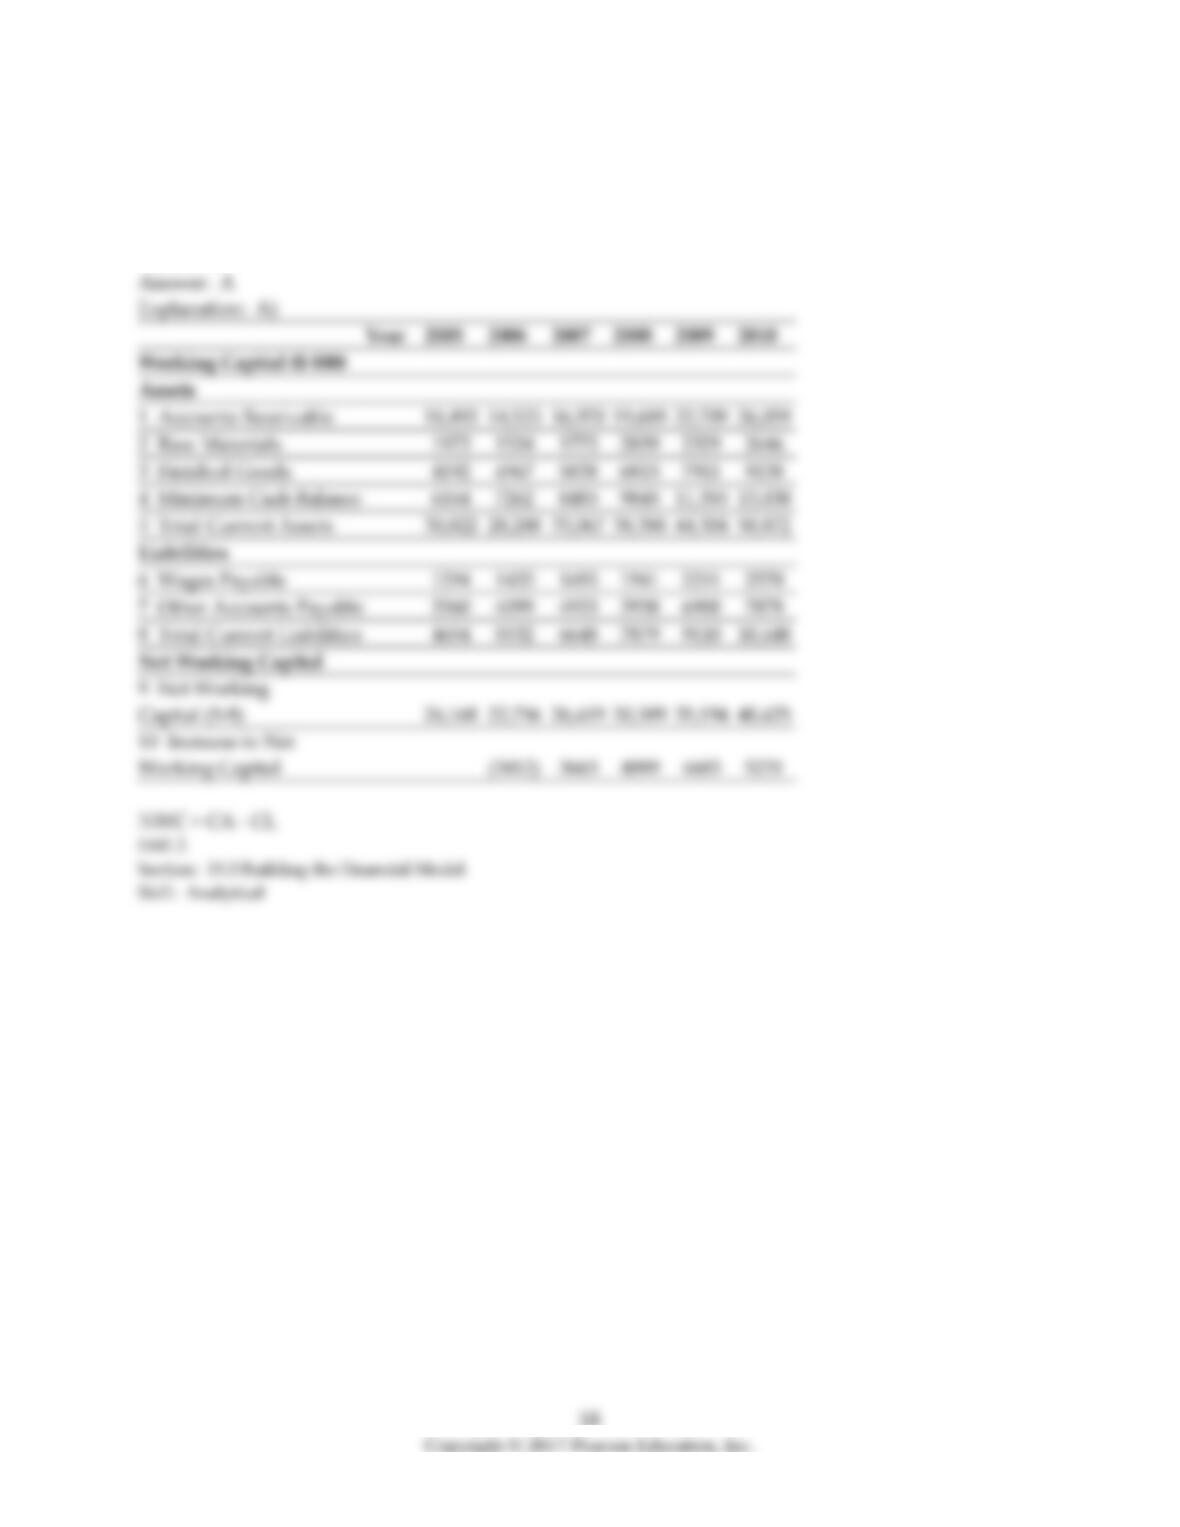
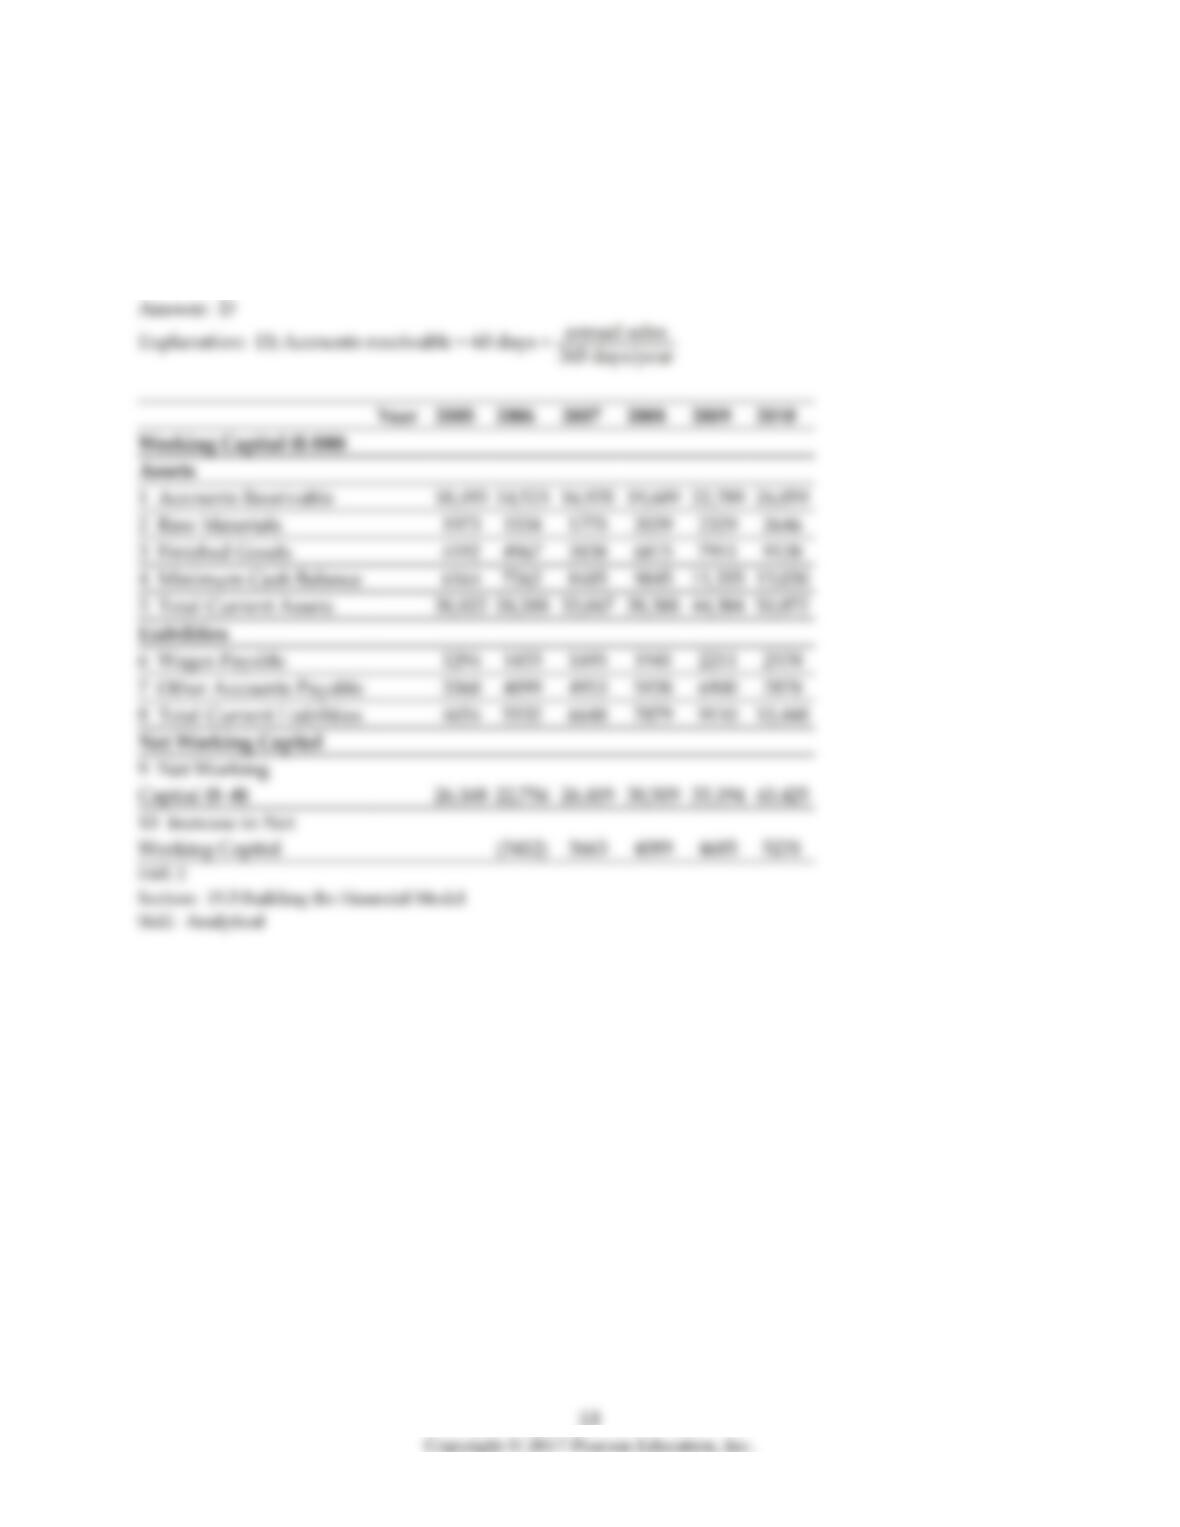
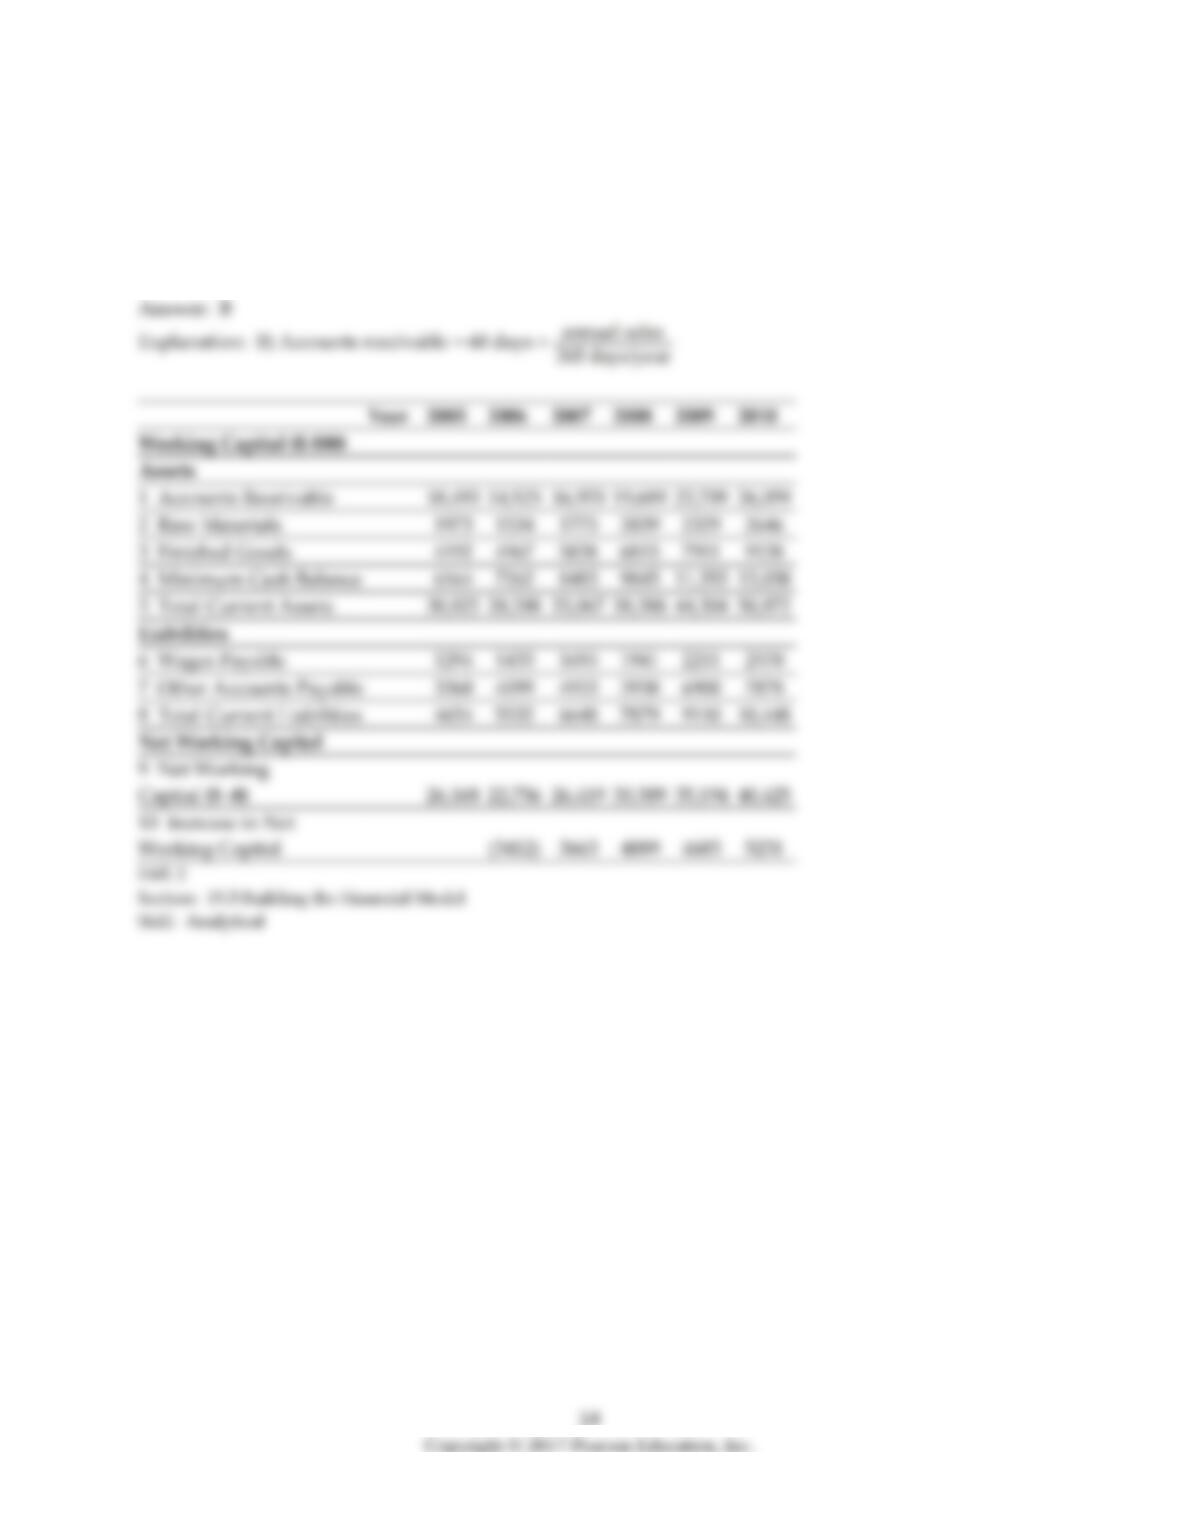
10) The amount of net working capital for Ideko in 2006 is closest to:
A) $22,750
B) $35,195
C) $30,510
D) $26,420