15-1
Chapter 15
Answers to Review Problems
Finance For Executives – 4th Edition
1. Understanding market value added and economic value added.
a.
The firm with the highest market value added, which is not necessarily the one with the highest
market value, is the one that has created the most value for its shareholders.
c.
Growth will increase a firm’s MVA only if expected ROICs exceed the firm’s WACC. If this is
not the case, growth will destroy value.
2. Value drivers.
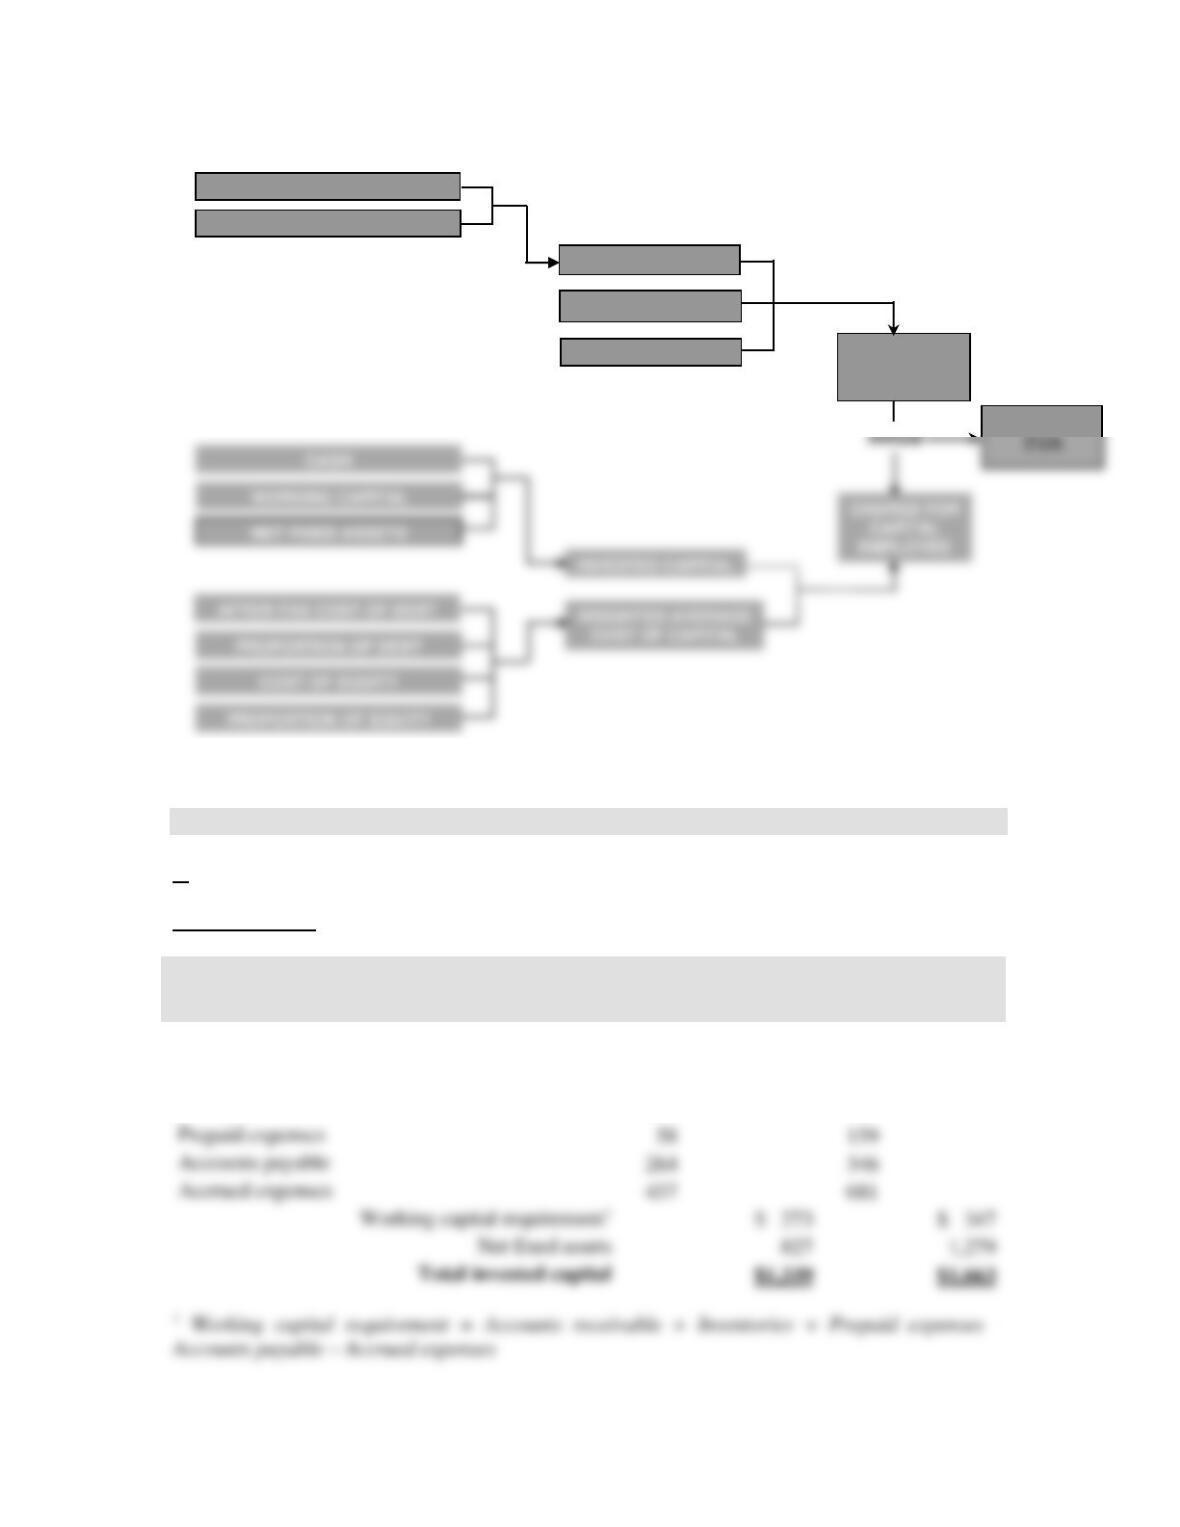
The following tree shows the value drivers and their relationship to value creation measured by
EVA.
Drivers related to the management of operations
1. Self-sustainable growth
2. Sales growth
3. Operating margin
4. Amount of working capital requirement
15-2
3. Adjusting accounting data to estimate a firm’s economic value added.
a.
Invested capital
$ millions
December 31,
2009
December 31,
2010
Cash
$239
$ 37
Accounts receivable
500
668
Inventories
416
547
Prepaid expenses
58
159
264
346
Accrued expenses
437
681
SALES GROWTH
AFTER-TAX
OPERATING
MARGIN
OPERATING MARGIN
EFFECTIVE TAX
RATE
SELF-SUSTAINABLE GROWTH
RATE
ABILITY TO RAISE EQUITY
FINANCING
FINANCING
15-3
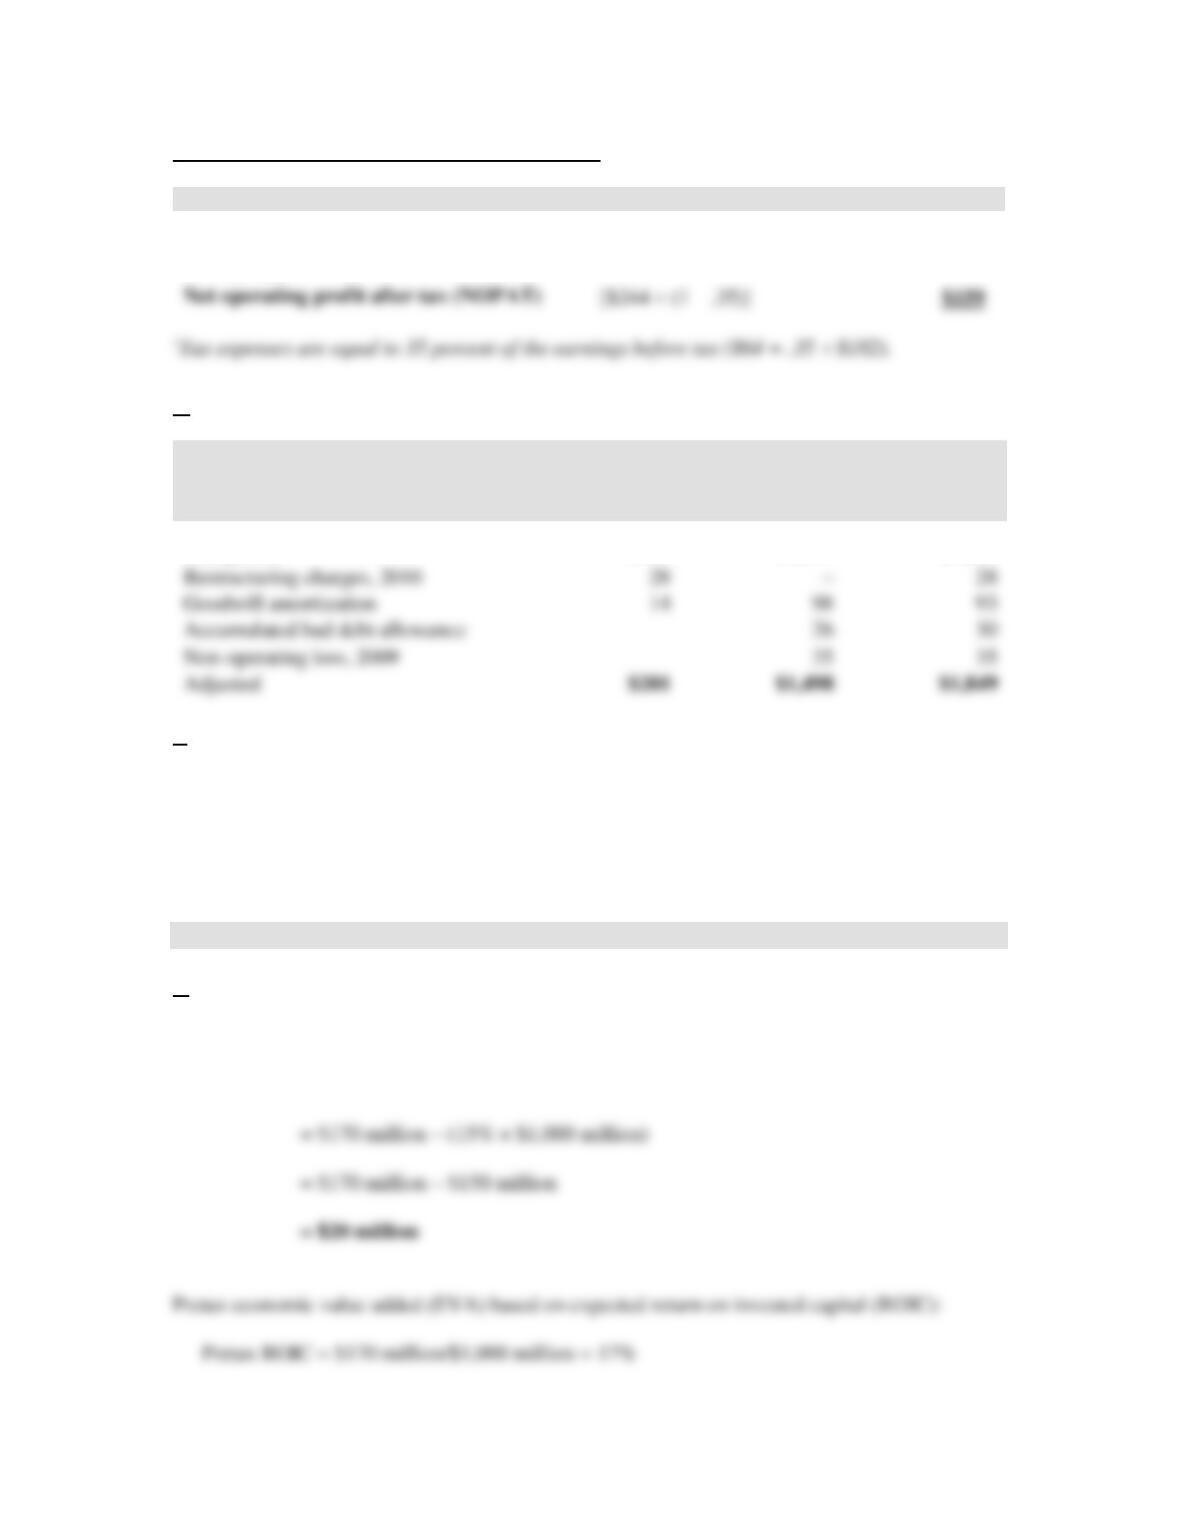
Net operating profit after tax (NOPAT) in 2010
$ millions
2010
Earnings before interest and tax (EBIT)
$244
Tax rate
35%1
b.
Invested Capital
$ millions
NOPAT
December 31,
2009
December 31,
2010
Unadjusted
$159
$1,339
$1,663
Adjusted
c.
EVA10 = NOPAT10 – WACC Average adjusted invested capital10
= $201 million – .10 [($1.498 million + $1.849 million)/2] = $33.65 million
4. Economic value added analysis.
a.
Pretax economic value added (EVA) based on initial invested capital:
EVA = Pretax operating profit – (Pretax cost of capital × Invested capital)
[$244 (1 – .35)] $159
15-4
b.
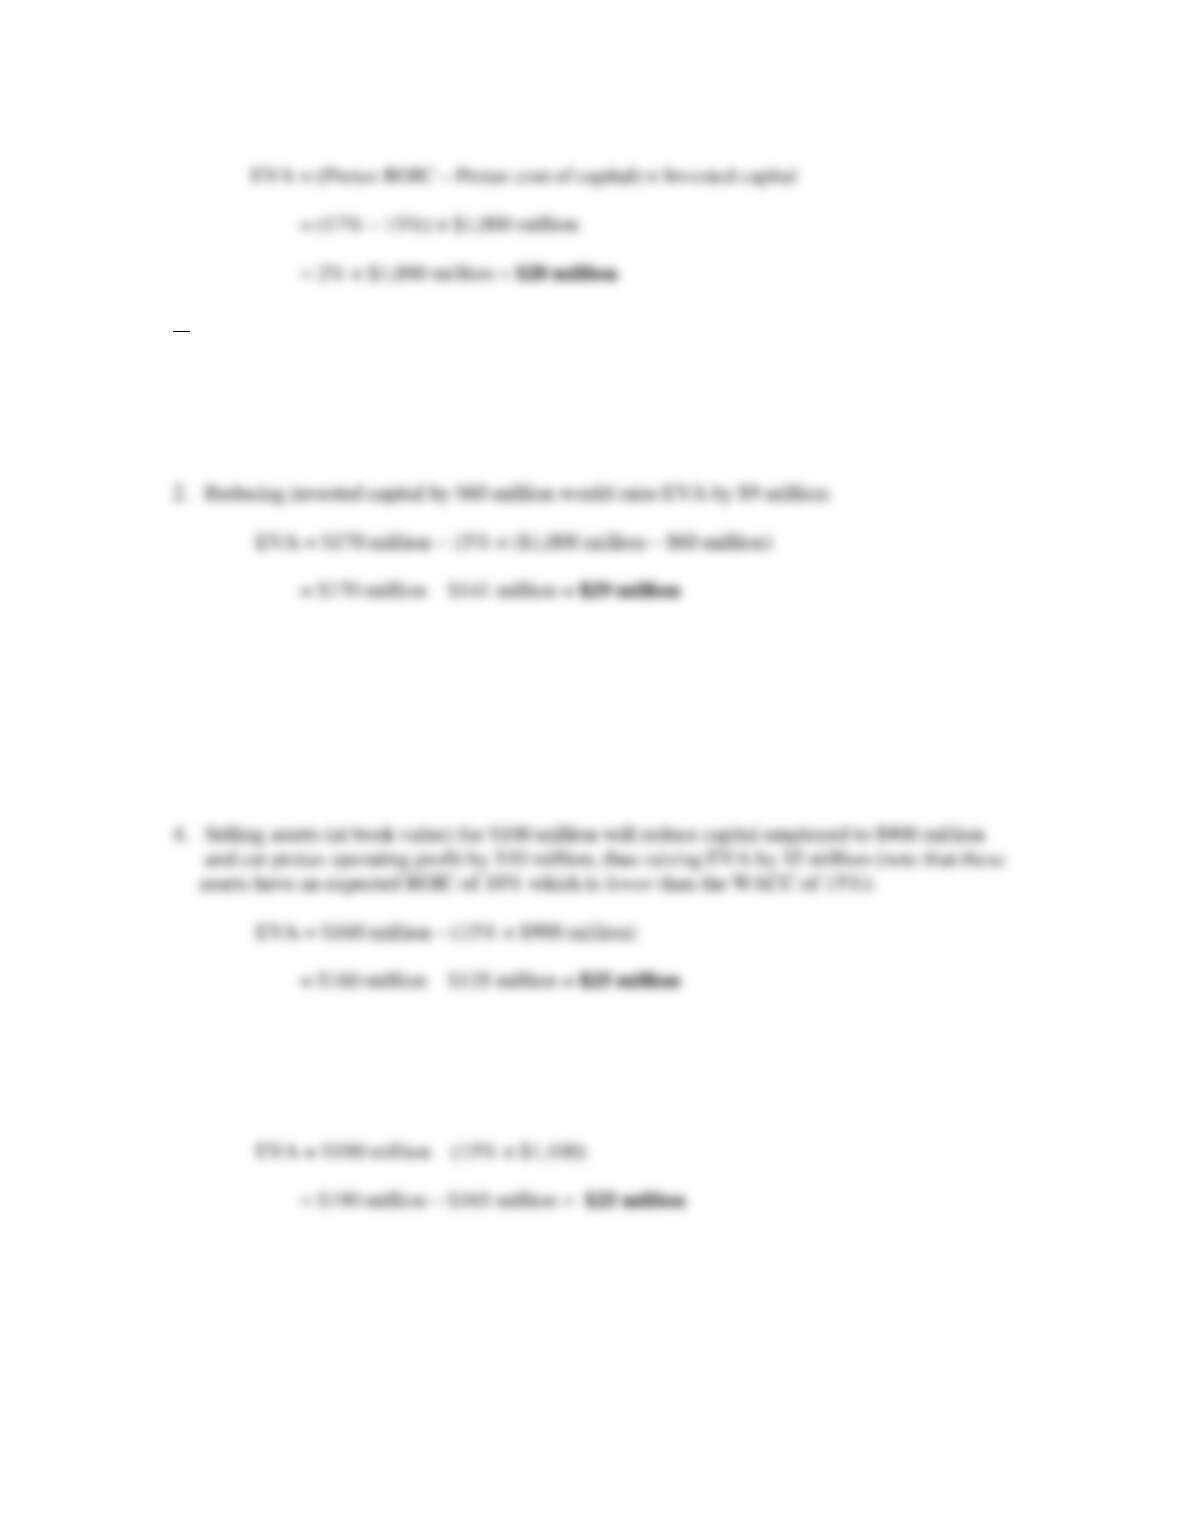
1. Reducing operating expenses by $10 million would raise EVA by $10 million:
EVA = [$170 million + $10 million] – $150 million = $30 million
3. Lowering pretax cost of capital to 14 percent would raise EVA by $10 million:
EVA = $170 million – 14% × $1,000 million
= $170 million – $140 million = $30 million
5. Buying assets for $100 million will raise capital employed to $1,100 million and add $20
million in pretax operating profit, thus raising EVA by $5 million (note that these assets have
an expected ROIC of 20% which is higher than the WACC of 15%):
15-5
5. The relationship between a firm’s market value, its market value added, and its
economic value added.
a.
Equation 15.1 defines market value added (MVA) as the difference between the market value of
capital and the amount of capital employed, which is also equal to the amount of invested capital.
Thus,:
Market value of capital = PV of expected future EVAs + Invested capital
b.
We show in the chapter that the present value of a project’s expected future EVAs is equal to (1)
the change in the firm’s MVA if the project is undertaken and (2) the net present value of a
Discounting these $3 million for 4 years at a cost of capital of 8 percent, we get:
PV of future expected EVAs
432 .08)(1
million$3
.08)(1
million$3
.08)(1
million$3
.081
million$3
+
+
+
+
+
+
+
=
15-6
6. The effect of the management of the operating cycle on the firm’s economic value
added.
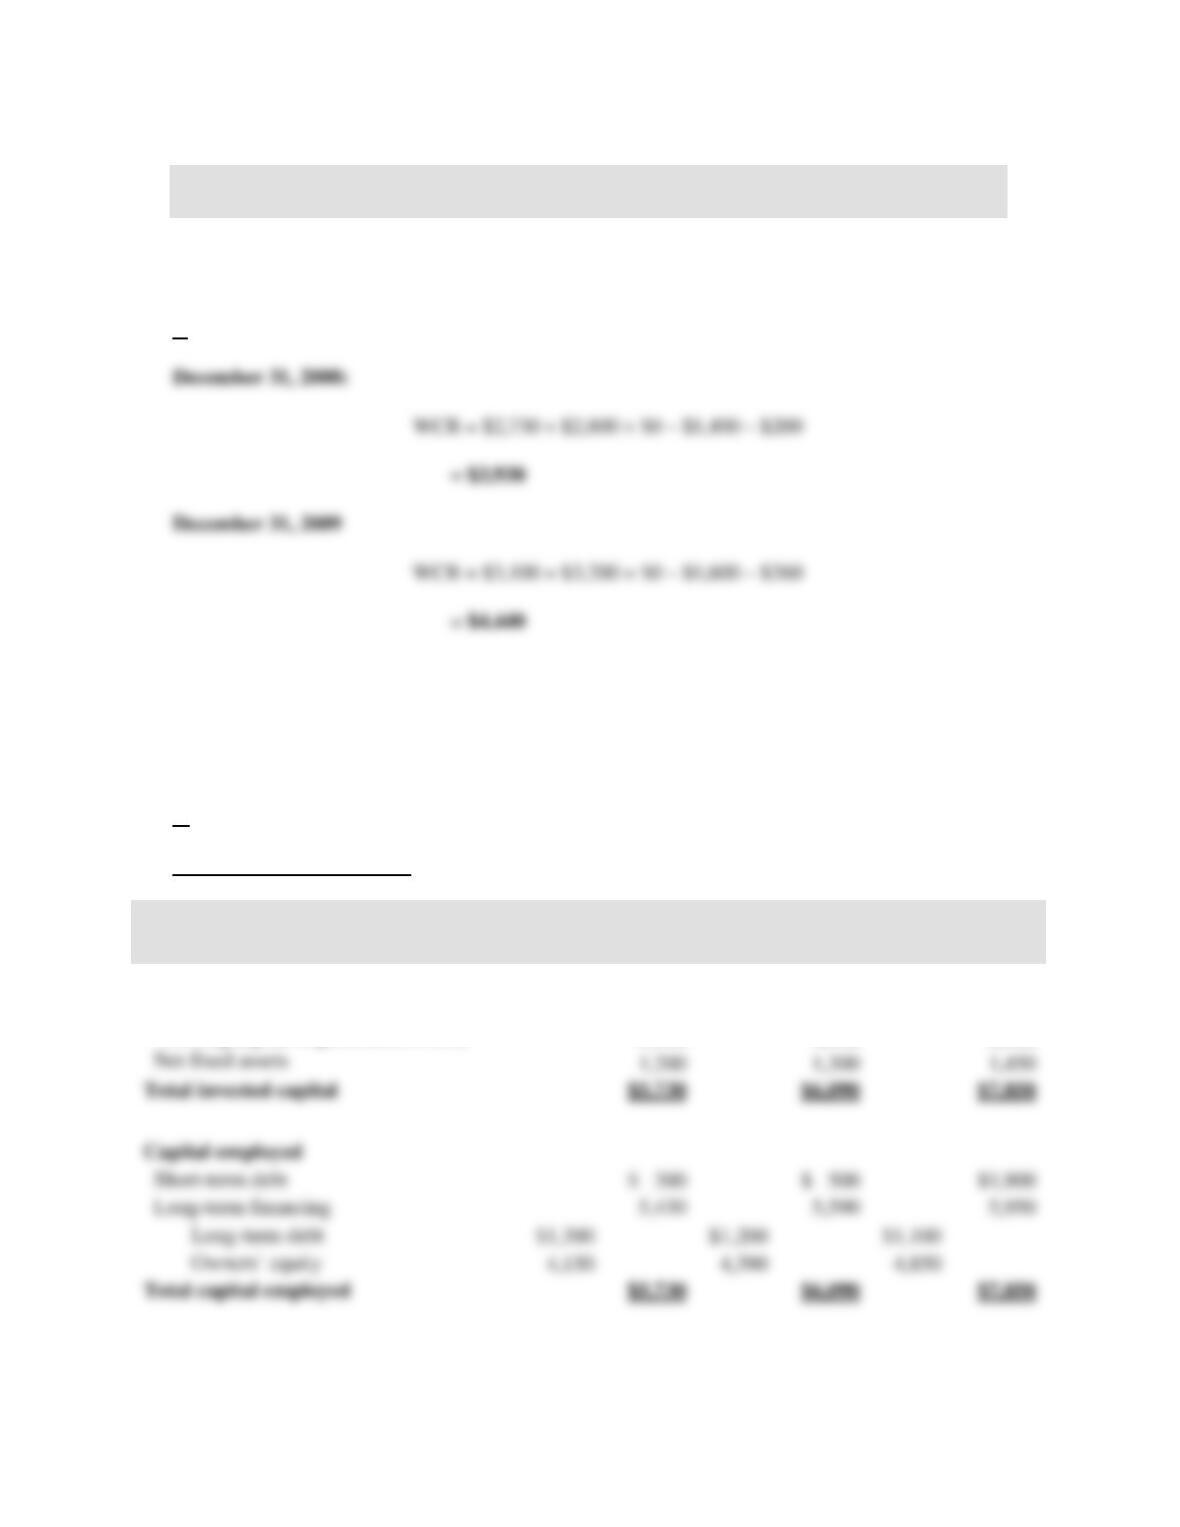
Working capital requirement (WCR) = Accounts receivable + Inventories + Prepaid expenses
– Accounts payable – Accrued expenses
a.
December 31, 2010
WCR = $4,200 + $4,300 + $0 – $2,050 – $350
= $6,100
b.
Managerial balance sheets
$ thousands
December 31,
2008
December 31,
2009
December 31,
2010
Invested capital
Cash
$ 600
$ 350
$ 300
Working capital requirement (WCR)
3,930
4,440
6,100
1,200
1,300
1,450
Short-term debt
$ 300
$ 500
Long-term financing
Long-term debt
Owners’ equity
15-7
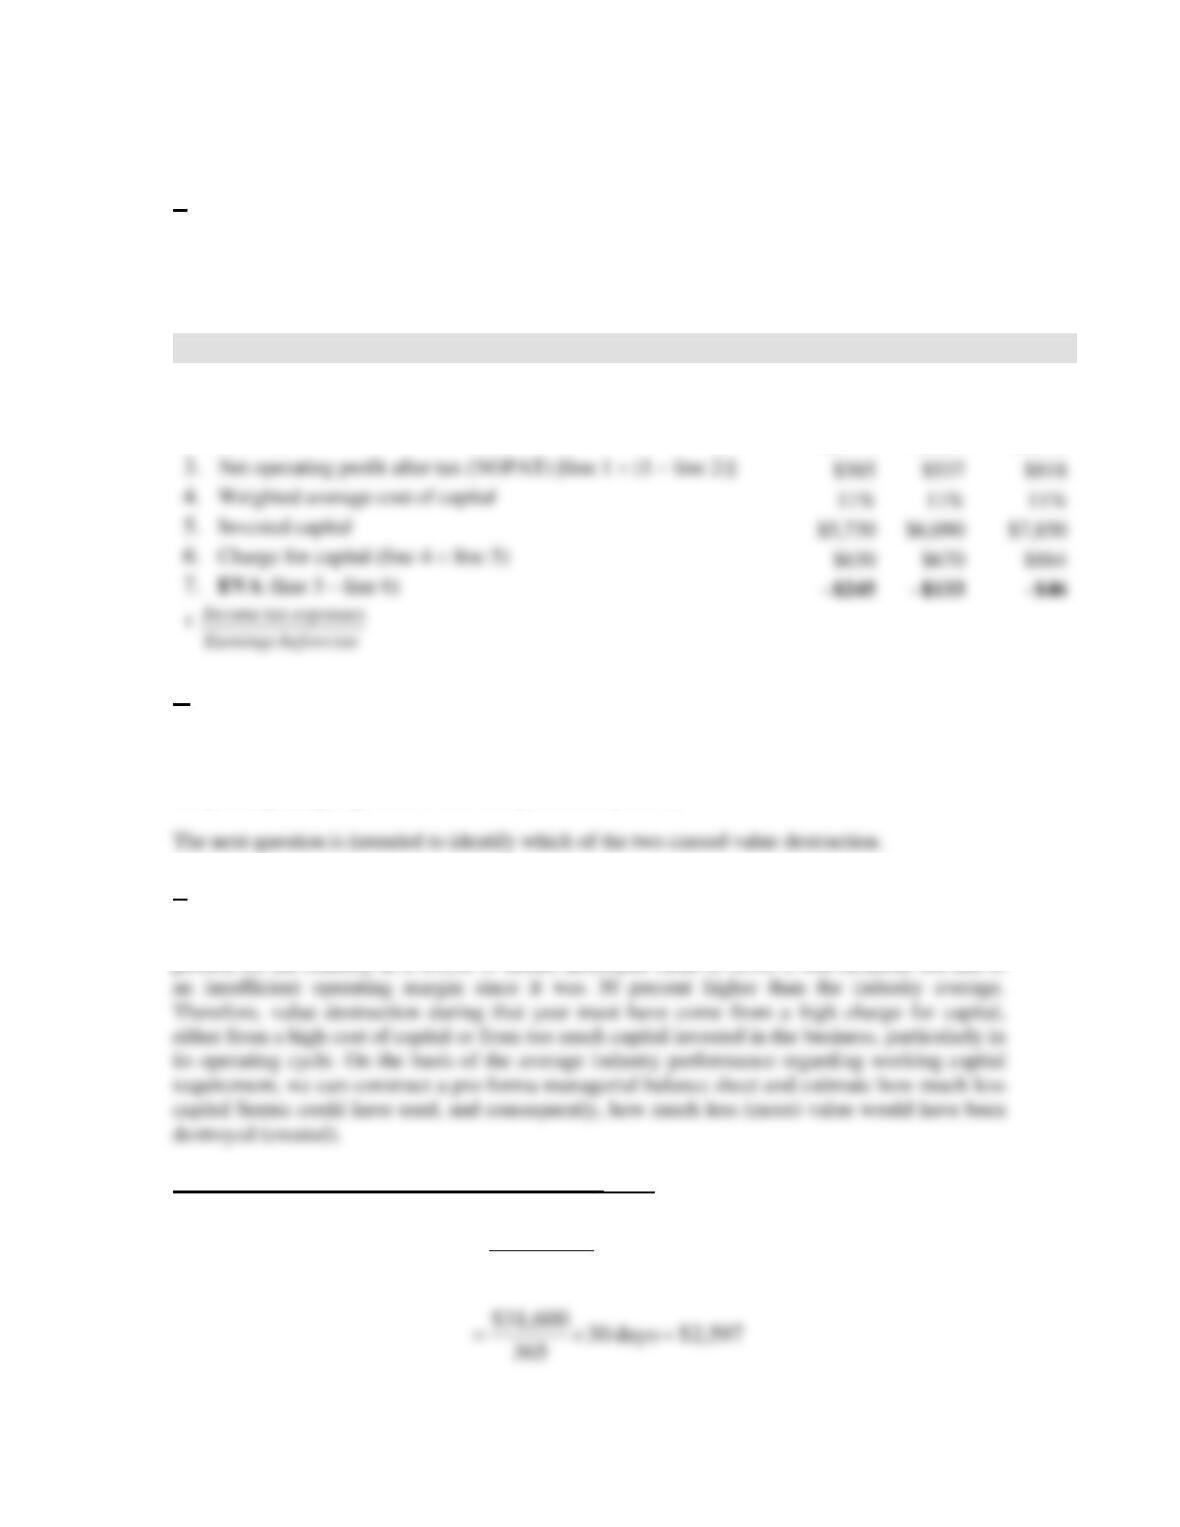
c.
Sentec would have created value in a given year, if during that year, its economic value added
(EVA) was positive and destroyed value if its EVA was negative.
$ thousands
2008
2009
2010
1. Earnings before interest and tax (EBIT)
$650
$900
$1,350
2. Tax rate1
40.7%
40.3%
39.4%
d.
Sentec has destroyed value in each of the three years. Value was destroyed because either/and the
operating margin was too low, or the firm was using too much capital to generate its current level
of operating margin (given the cost of capital of 11 percent).
e.
In 2010, Sentec’s operating margin was equal to 4.3 percent ($1,350/$31,600), compared to 3.3
percent for the industry as a whole. If Sentec destroyed value in 2010, it was certainly not due to
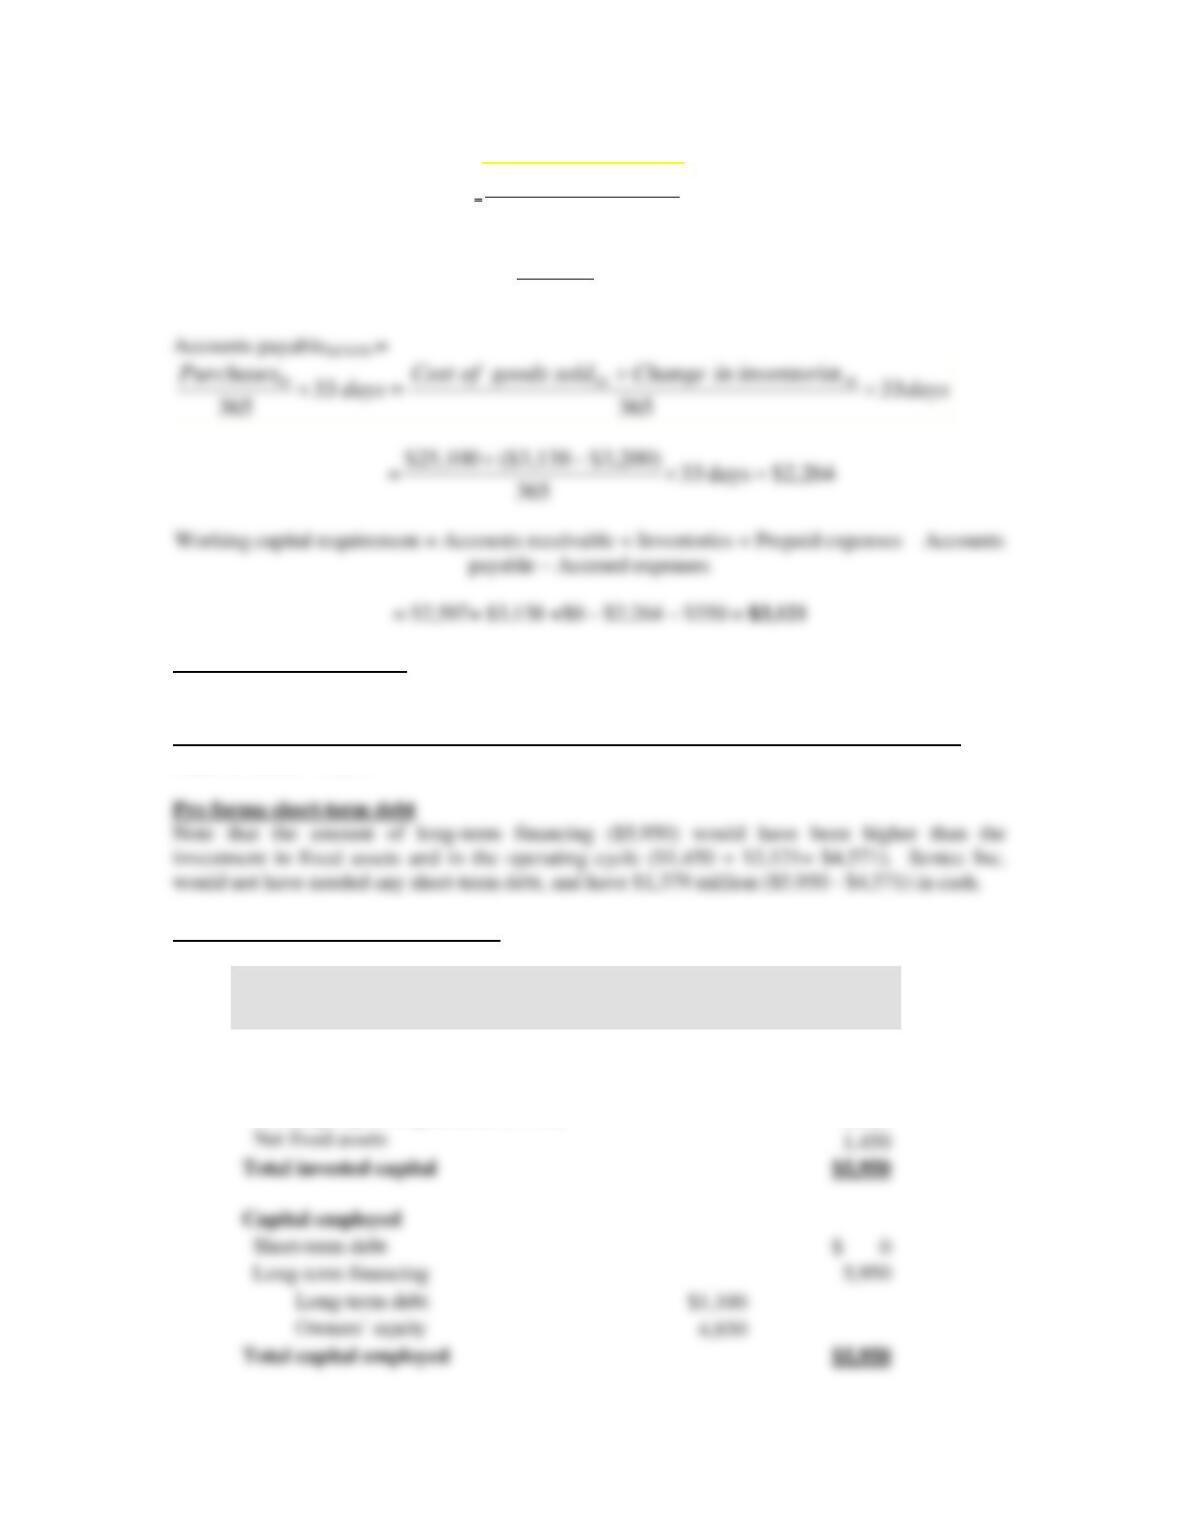
Pro forma working capital requirement (WCR) 12/31/10
Accounts receivable12/31/10 =
days30
365
salesNet 10
3. Net operating profit after tax (NOPAT) [line 1 (1 – line 2)]
$385
$537
$818
4. Weighted average cost of capital
5. Invested capital
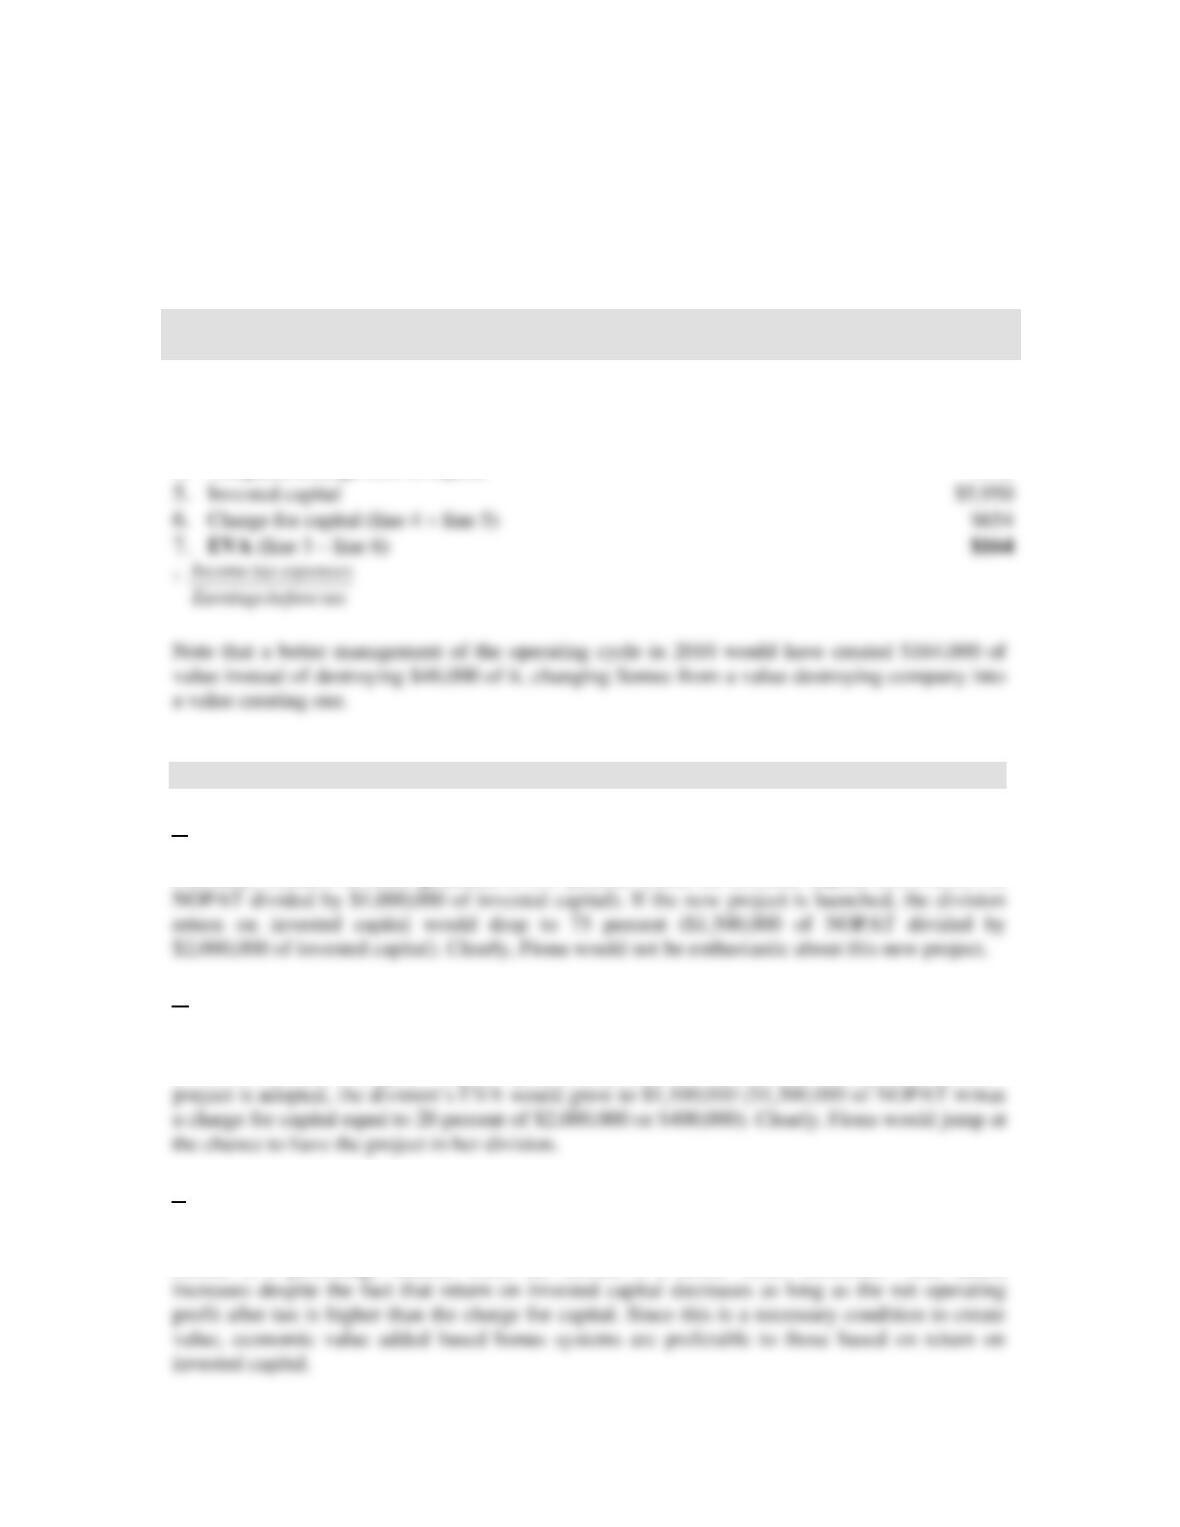
6. Charge for capital (line 4 line 5)
$630
$670
$864
7. EVA (line 3 – line 6)
15-8
Inventory 12/31/10 =
8
soldgoodsofCost 10
$3,138
8
$25,100 ==
Pro forma net fixed assets
Same as before= $1,450
Pro forma long-term financing = pro forma owners’ equity + pro forma long-term debt
Same as before =$5,950
Pro forma managerial balance sheet
$ thousands
December 31,
2010
Invested capital
Cash
$1,379
Working capital requirement (WCR)
3,121
Short-term debt
Long-term financing
Long-term debt
Owners’ equity
15-9
If Sentec had managed its operating cycle like the average firm in the industry in year 2010, its
invested capital would have been equal to $5.950 million instead of $7.850 million. As a result,
its economic value added would have been positive and equal to $164 million, as shown in the
following table:
$ thousands
Pro forma
2010
1. Earnings before interest and tax (EBIT)
$1,350
2. Tax rate1
39.4%
3. Net operating profit after tax (NOPAT) [line 1 (1 – line 2)]
$818
4. Weighted average cost of capital
11%
7. Return on invested capital versus economic value added based bonus systems.
a.
Currently, Fiona’s division generates a 100 percent return on invested capital ($1,000,000 of
b.
Currently, Fiona’s division generates an annual economic value added of $800,000 ($1,000,000
of NOPAT minus a charge for capital equal to 20 percent of $1,000,000 or $200,000). If the new
c.
The important difference between return on invested capital and economic value added is that the
former is a percentage number while the second is a dollar value. Economic value added
5. Invested capital
6. Charge for capital (line 4 line 5)
$654
7. EVA (line 3 – line 6)

15-11
8. Economic value added based bonus system.
a.
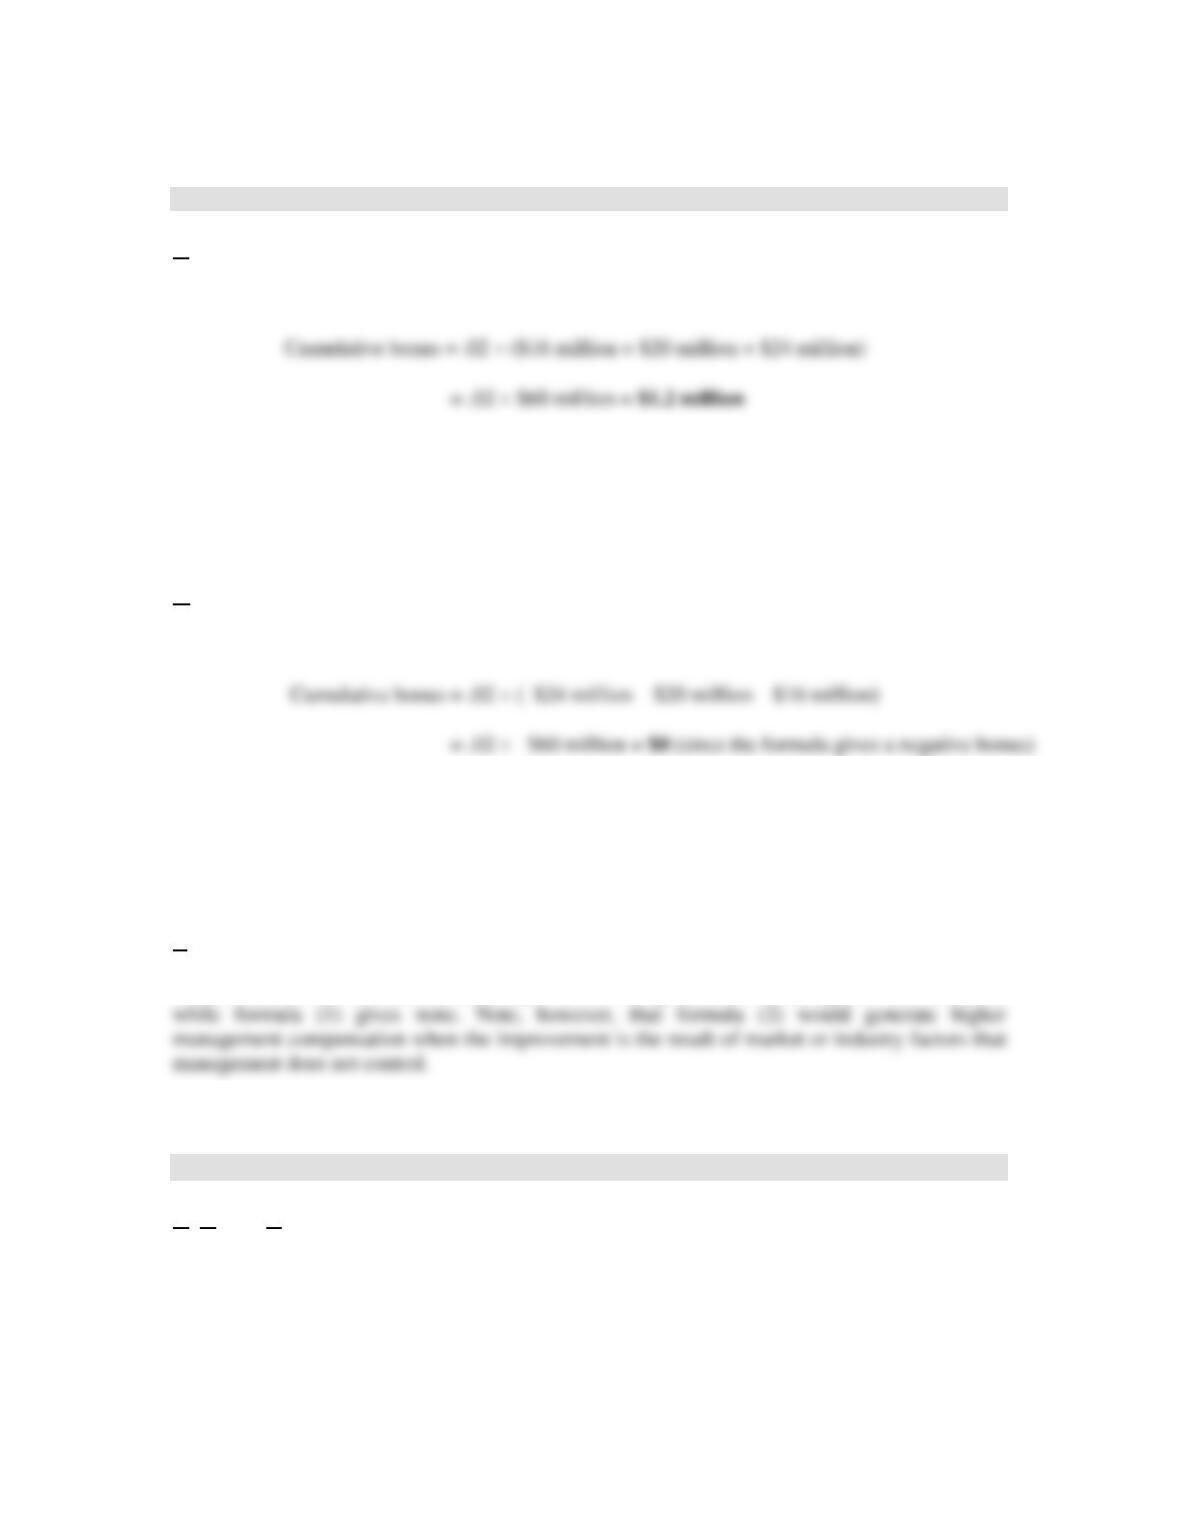
Formula (1):
Formula (2):
Cumulative bonus = .01 $60 million + .075 ($24 million – $16 million)
= $.6 million + $.6 million = $1.2 million
b.
Formula (1):
Formula (2):
Cumulative bonus = .01 –$60 million + .075 (–$16 million – (–$24 million))
= $0 + $.6 million = $.6 million
c.
Astra should choose formula (2) since it provides a strong incentive to manage for value creation,
9. Economic value added, market value added, and net present value.
a., b., and c.
15-12
A B C D E F
1Now Year-end 1 Year-end 2 Year-end 3 Year-end 4
21. Investment data
3 Initial investment -$200,000
4 After-tax receipt from sale of equipment $0
5 Working capital requirement $40,000 $40,000 $40,000 $40,000 $0
12 Cost of capital 10%
13 2. Expected net operating profit after tax (NOPAT)
14 Sales $400,000 $400,000 $400,000 $400,000
15 Variable costs $200,000 $200,000 $200,000 $200,000
19 3. Expected cash flow from the investment and net present value (NPV)
20 Change in working capital requirement -$40,000 0 0 0 40,000
21 Expected cash flow from the investment -$240,000 $110,000 $110,000 $110,000 $150,000
22 Net present value $136,006
23 4. Economic value added (EVA) and market value added (MVA)
24 Accumulated depreciation of the equipment $50,000 $100,000 $150,000 $200,000
25 Net book value of the equipment $200,000 $150,000 $100,000 $50,000 $0
26 Invested capital $240,000 $190,000 $140,000 $90,000 $0
27 Capital charge $24,000 $19,000 $14,000 $9,000
28 EVA $36,000 $41,000 $46,000 $51,000
29 MVA $136,006
30
Note that the calculated project’s MVA ($136,006) is equal to its calculated NPV ($136,006).
This will always be the case if, in computing the project’s NPV, the change in working capital
during the first year of the project is accounted for at the beginning of the year instead of the end
of the year.
15-13
10. Comparison of investment analysis based on cash flows and economic value added.
The project’s cost of capital is:
Proportion of project debt financed × kD (1 – TC) + Proportion of project equity financed × kE
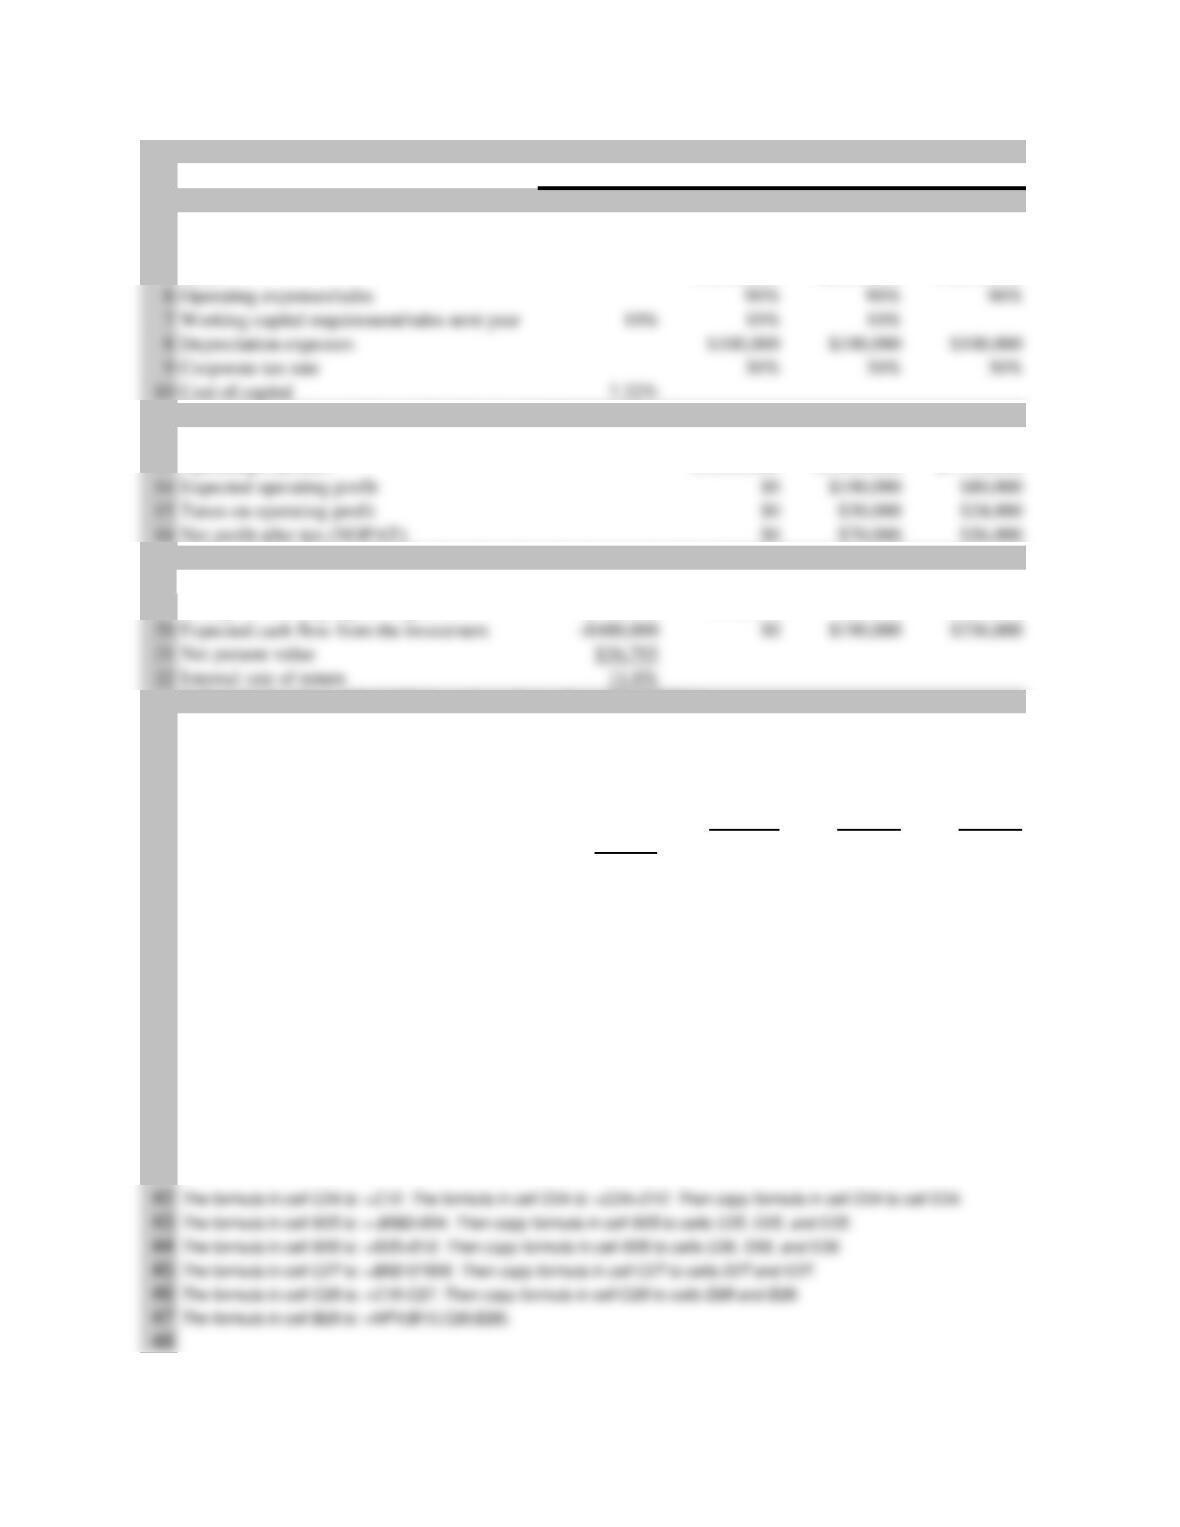
15-14
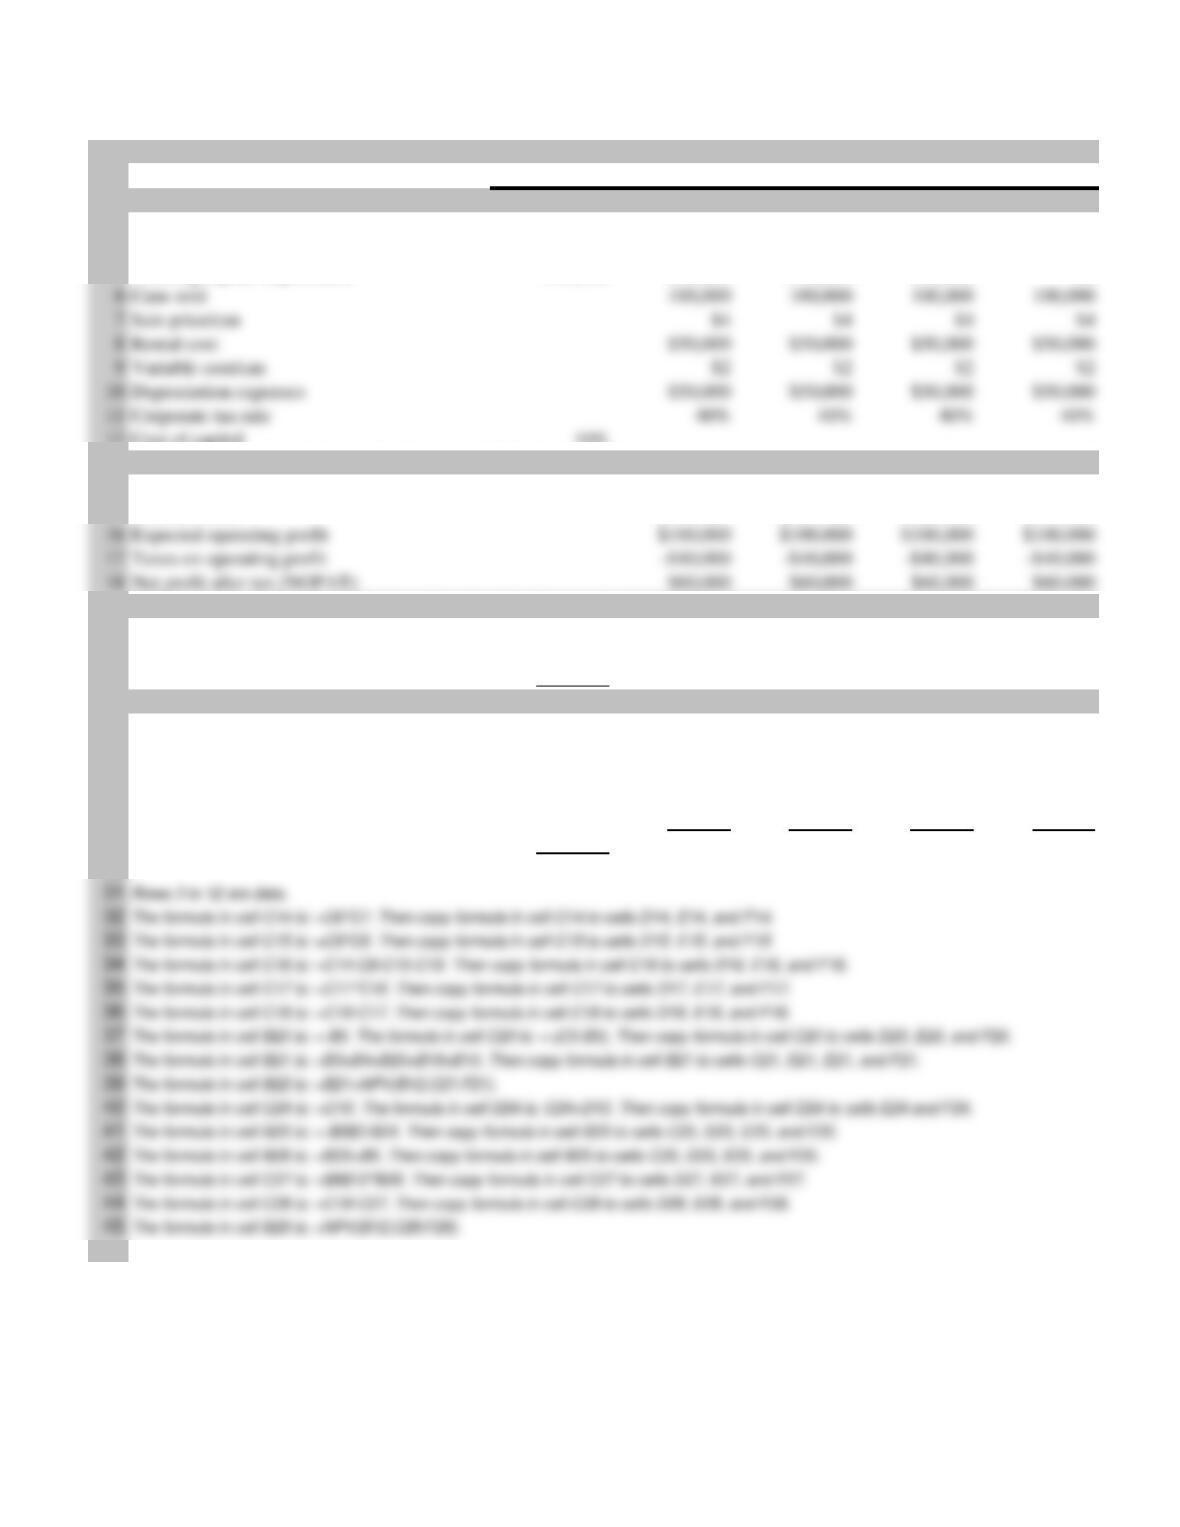
A B C D E
1Now Year-end 1 Year-end 2 Year-end 3
21. Investment data
3 Initial investment -$300,000
4 After-tax receipt from sale of equipment $0
5 Sales $1,000,000 $2,000,000 $1,800,000
11 2. Expected net operating profit after tax (NOPAT)
12 Depreciation expense $100,000 $100,000 $100,000
13 Operating expenses $1,000,000 $1,900,000 $1,720,000
17 3. Expected cash flow from the investment and net present value (NPV)
18 Working capital requirement $100,000 $200,000 $180,000 $0
19 Change in working capital requirement -$100,000 -$100,000 $20,000 $180,000
23 4. Economic value added (EVA) and market value added (MVA)
24 Accumulated depreciation of the equipment $100,000 $200,000 $300,000
25 Net book value of the equipment $300,000 $200,000 $100,000 $0
26 Invested capital $400,000 $400,000 $280,000 $0
27 Capital charge $29,280 $29,280 $20,496
28 EVA -$29,280 $40,720 $35,504
29 MVA $36,795
30
31 Rows 3 to 10 are data.
32 The formula in cell C12 is: =SLN(-$B$3,E4,3). Then copy formula in cell C12 to cells D12 and E12.
33 The formula in cell C13 is: =C6*C5+C12. Then copy formula in cell C13 to cells D13 and E13.
34 The formula in cell C14 is: =C5-C13. Then copy formula in cell C14 to cells D14 and E14.
35 The formula in cell C15 is: =C9*C14. Then copy formula in cell C15 to cells D15 and E15.
36 The formula in cell C16 is: =C14-C15. Then copy formula in cell C16 to cells D16 and E16.
37 The formula in cell B18 is: = B7*C5. Then copy formula in cell B18 to cells C18, D18, and E18.
38
39 The formula in cell B20 is: =B3+B19+B16+B12. Then copy formula in cell B20 to cells C20, D20, and E20.
40 The formula in cell B21 is: =B20+NPV(B10,C20:E20).
41 The formula in cell B22 is: =IRR(B20:E20).
The formula in cell B19 is: =-B18. The formula in cell C19 is: =-(C18-B18). Then copy formula in cell C19 to cells D19 and
E19.
15-15
a.
The net present value of the cash flows from this project at a WACC of 7.32% is equal to
$36,795. The project’s internal rate of return is equal to 11%. Because the project’s NPV is
positive and its IRR exceeds the WACC, the project is a value-creating proposition and should be
undertaken.
b.
c.
When estimating EVA, invested capital must be measured at the beginning of the period and the
stream of EVAs must be discounted at the same cost of capital as the cash flows (that is, at the
WACC).