14-1
Chapter 14
Answers to Review Problems
Finance For Executives – 4th Edition
1. Exposure.
This problem illustrates one of the dilemmas facing multinational companies. It is
basically about changes in the valuation of a foreign subsidiary’s assets and liabilities,
how to report them in the consolidated accounts of the group, and ultimately whether
they can have an impact on share prices. With the current method (FASB52), presented in
Is hedging a potential loss with a forward contract a wise decision? The idea of the hedge
is to make a gain on the forward contract that would offset all or part of the loss in value.
If the peso did fall 20% to peso 60 per USD, the value of the subsidiary’s equity would
fall to $41.67 million (peso 2,500 million divided by peso/USD60) producing a USD 8.33
million loss. Assuming a full hedge, pesos would be sold forward at peso/USD 53, and
Another point to consider is the overall economic impact of a depreciation in the
subsidiary’s currency. If most or all of the subsidiary output is exported, the cheaper peso
should mean more sales and, consequently, higher profits. So if in the immediate future, a
depreciation of the peso would lead to a drop in reported USD income, earnings should
rise subsequently. The overall impact on share prices may not be negative if the stock
14-2
2. Parity relations.
a.
Purchasing power parity says that changes in the exchange rate between two countries’
currencies are determined by the difference in the expected inflation rates between the
two countries.
b.
c.
Interest rate parity says that changes in the exchange rate between two countries’
currencies are determined by the difference in interest rates between the two countries.
d.
3. Interest rate parity relation.
a.
The return on one USD deposit is:
USD 1.00 × (1 + 0.03) = USD 1.03
b.
c.
If you borrow USD 1.00, you will have to repay US D1.03 in one-year time. The return
14-3
4. Arbitrage activity.
a.
The arbitrage would be as follows:
Now:
1. Buy USD 2,247,797 (¥250 million at the spot rate of ¥/USD 111.22).
At the end of 90 days, unwind the arbitrage and receive ¥251,771,888 from the forward
contract (USD 2,265,358 ¥/USD 111.14).
b.
The forward rate can be derived from the interest rate parity relation (IRP). In Appendix
14.2, we show that this relationship implies the following:
rh = the 90-day dollar interest rate (3.125 percent)
rf = the 90-day yen interest rate (2.156 percent)
If the dollar interest rate were to suddenly increase by 25 bp (and assuming no change to
the spot rate or the yen interest rate), the forward rate should immediately rise to ¥110.88:
5. International Fisher Effect
The rising prices probably mean rising inflation. According to IFE, if the inflation of this
country is rising faster than in the U.S., the money of this country in real terms should
depreciate against the U.S. dollar. However, since the country employs a fixed exchange
rate regime, the exchange rate between these two currencies would not move. But this
fixed exchange rate regime would not sustainable in the long run.
6. Real versus nominal cash flow valuation.
• Real valuation allows for easy-to-do forecasts than nominal valuation, as long as
real cash flows are nominal cash flows at zero inflation rate
14-5
7. The purchasing power parity relation
a.
A
B
1
Initial capital
USD10,000,000
2
Spot rate $/£
1.60
3
Spot rate £/$
0.625
4
6-month forward rate
1.65
Cells B1 – B6 are data.
Formula in cell B7 is =B1*B3.
Formula in cell B9 is =B1*(1+B5*6/12).
Formula in cell B10 is =B7*(1+B6*6/12)*B4.
The finance manager should invest the money in the United Kingdom.
b.
From equation 14.1
5
Annual interest rate in the U.S.
6
Annual interest rate in the United Kingdom (U.K.)
7
Initial capital in British Pound
8
9
Investment value in the next 6 months – investment in the U.S.
USD10,150,000
Investment value in the next 6 months – investment in the U.K.
USD10,364,063
14-6
8. International capital budgeting (1).
The net present value calculation follows exactly the same approach as the one used for
A
B
C
D
E
F
G
1
Year-
end 1
Year-
end 2
Year-
end 3
Yea-
end 4
Year-
end 5
2
Now
3
4
Expected cash flows in millions of euros (EUR)
5
Annual cash flow
–€125
€30
€30
€30
€30
€30
6
Cash flow from liquidation
€30
7
Total cash flow
–€125
€30
€30
€30
€30
€60
8
9
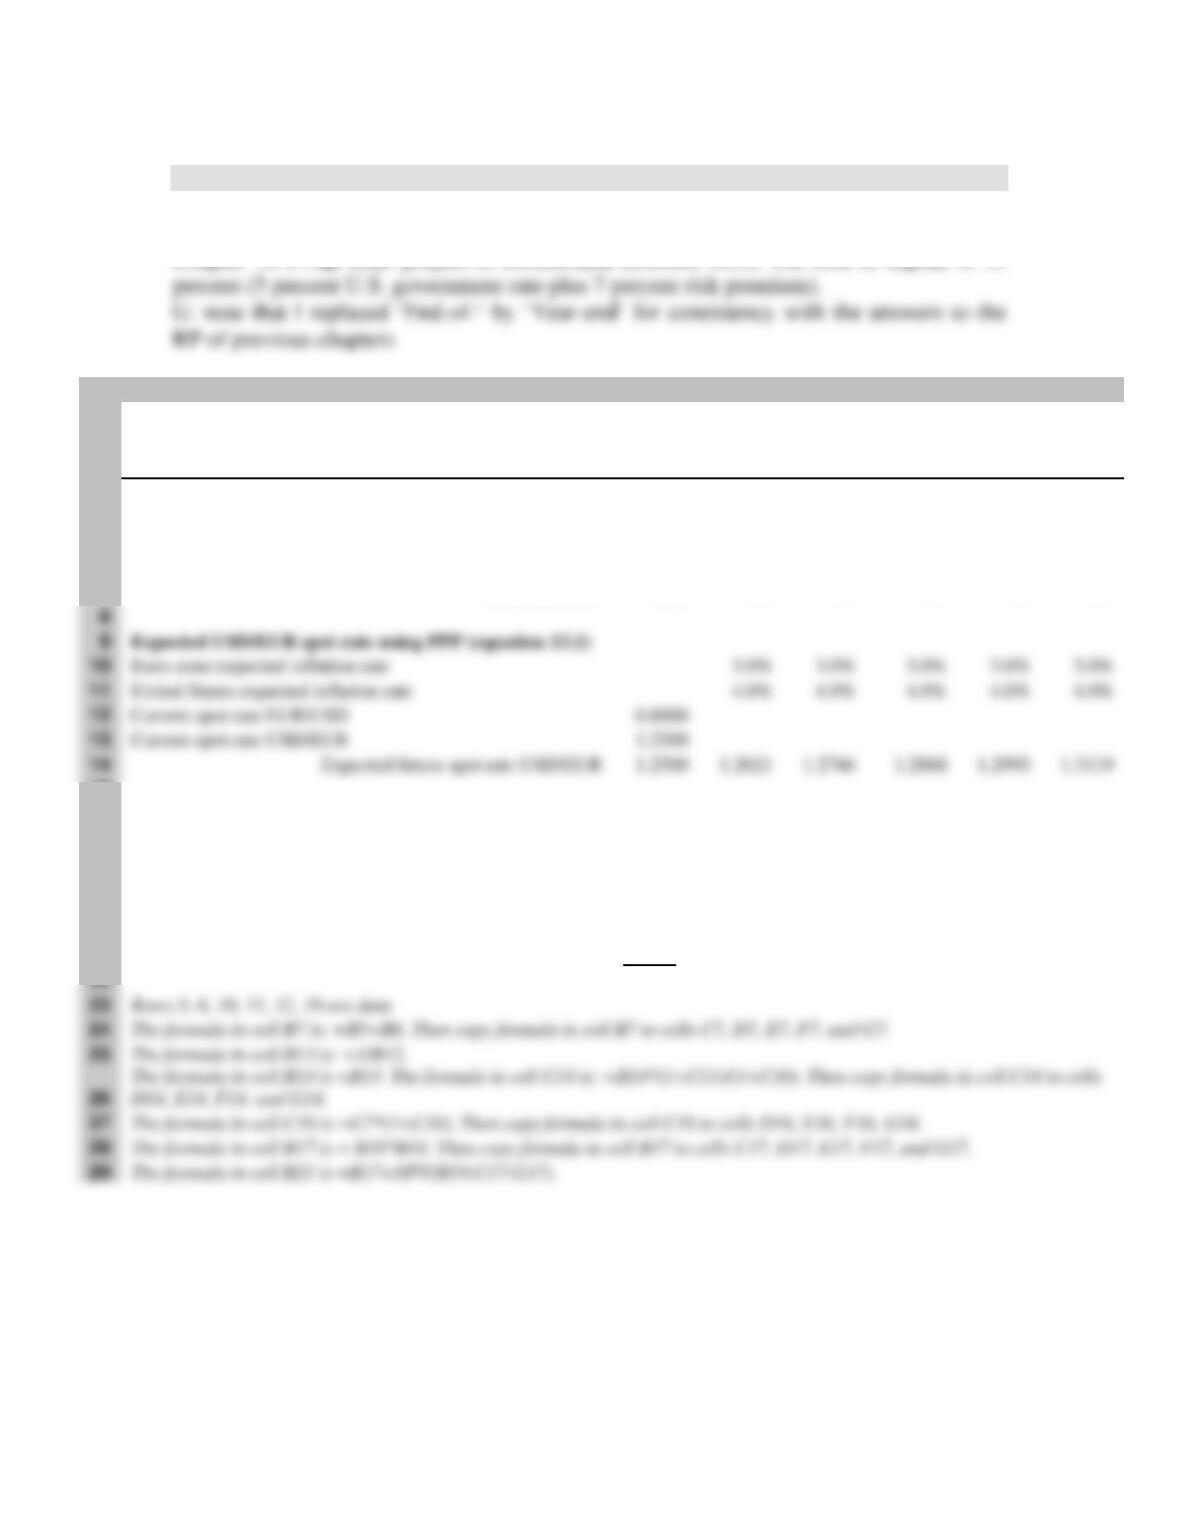
Expected USD/EUR spot rate using PPP (equation 13.1)
10
Euro-zone expected inflation rate
11
United States expected inflation rate
12
Current spot rate EUR/USD
13
Current spot rate USD/EUR
14
15
16
Expected cash flows with inflation in millions of euros
(EUR)
–€125
€30.9
€30.9
€30.9
€30.9
€61.8
17
Expected cash flows in millions of U.S. dollars (USD)
-$156.3
$39.0
$39.4
$39.8
$40.1
$81.1
18
19
Cost of capital
12.0%
20
21
Net present value
$9.782 million
22
23
24
25
26
27
28
29
14-7
9. International capital budgeting (2).
a.
The minimum price that the owners of Chateau Cheval Noir should ask for the vineyard
is the present value of the cash flows expected from the assets of the vineyard. This is the
sum of the present value of the cash flows expected from the vineyard at the end of each
of the next five years plus the present value of the terminal value at the end of the five–
year period.
The cash flows from the firm’s assets (CFA) can be estimated as follows (see equation
12.4 in Chapter 12):
14-8
A
B
C
D
E
F
G
H
1
Year-
end
Year-
end
Year-
end
Year-
end
Year-
end
Year-
end
2
2010
2011
2012
2013
2014
2015
2016
3
4
Expected inflation rate in Australia
5.0%
5.0%
5.0%
5.0%
5.0%
5.0%
5
Australian corporate tax rate
30.0%
30.0%
30.0%
30.0%
30.0%
30.0%
Working capital requirement (WCR) as percent of
12
13
equals expected cash flow from vineyard in AUD
$10.2
$10.7
$11.3
$11.8
$12.4
$13.0
14
15
Residual value year-end 2015 in AUD
$186.2
16
17
Cost of capital in Australian dollars
12.00%
18
Vineyard value in Australian dollars
$146 million
19
20
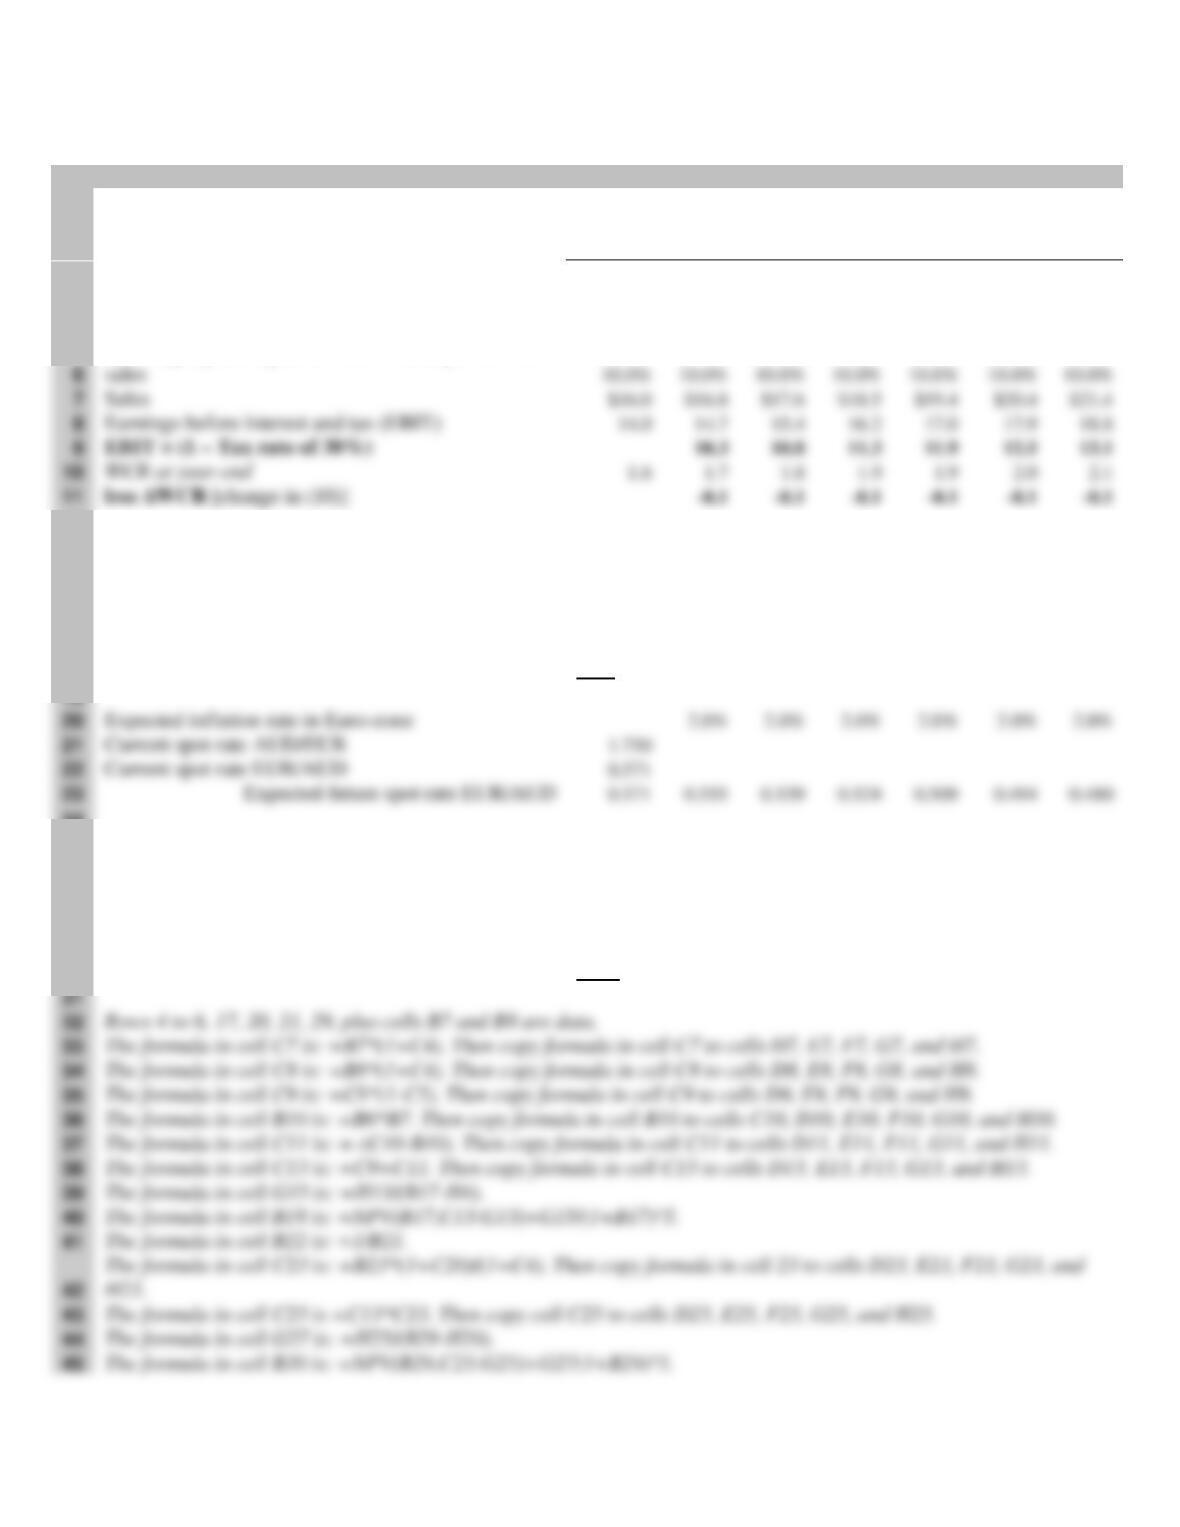
Expected inflation rate in Euro-zone
2.0%
2.0%
21
Current spot rate AUD/EUR
22
Current spot rate EUR/AUD
23
0.494
24
25
Expected cash flows in millions of euros
€5.7
€5.8
€5.9
€6.0
€6.1
€6.3
26
27
Residual value year-end 2015 in euros
€78.2
28
29
Cost of capital in euros
10.0%
30
Vineyard value in euros
€70.8 million
31
32
33
34
35
36
37
38
39
40
41
42
43
44
45
6
10.0%
10.0%
10.0%
10.0%
10.0%
10.0%
7
8
Earnings before interest and tax (EBIT)
9
EBIT × (1 – Tax rate of 30%)
10.3
10.8
11.3
11.9
13.1
10
1.6
11
14-9
b.
Why the higher discount rate for Australian dollar cash flows? One argument could be
that this represents the only diversification of the investors and that any favorable
portfolio effects this might bring them would be offset by the possibility of unforeseen
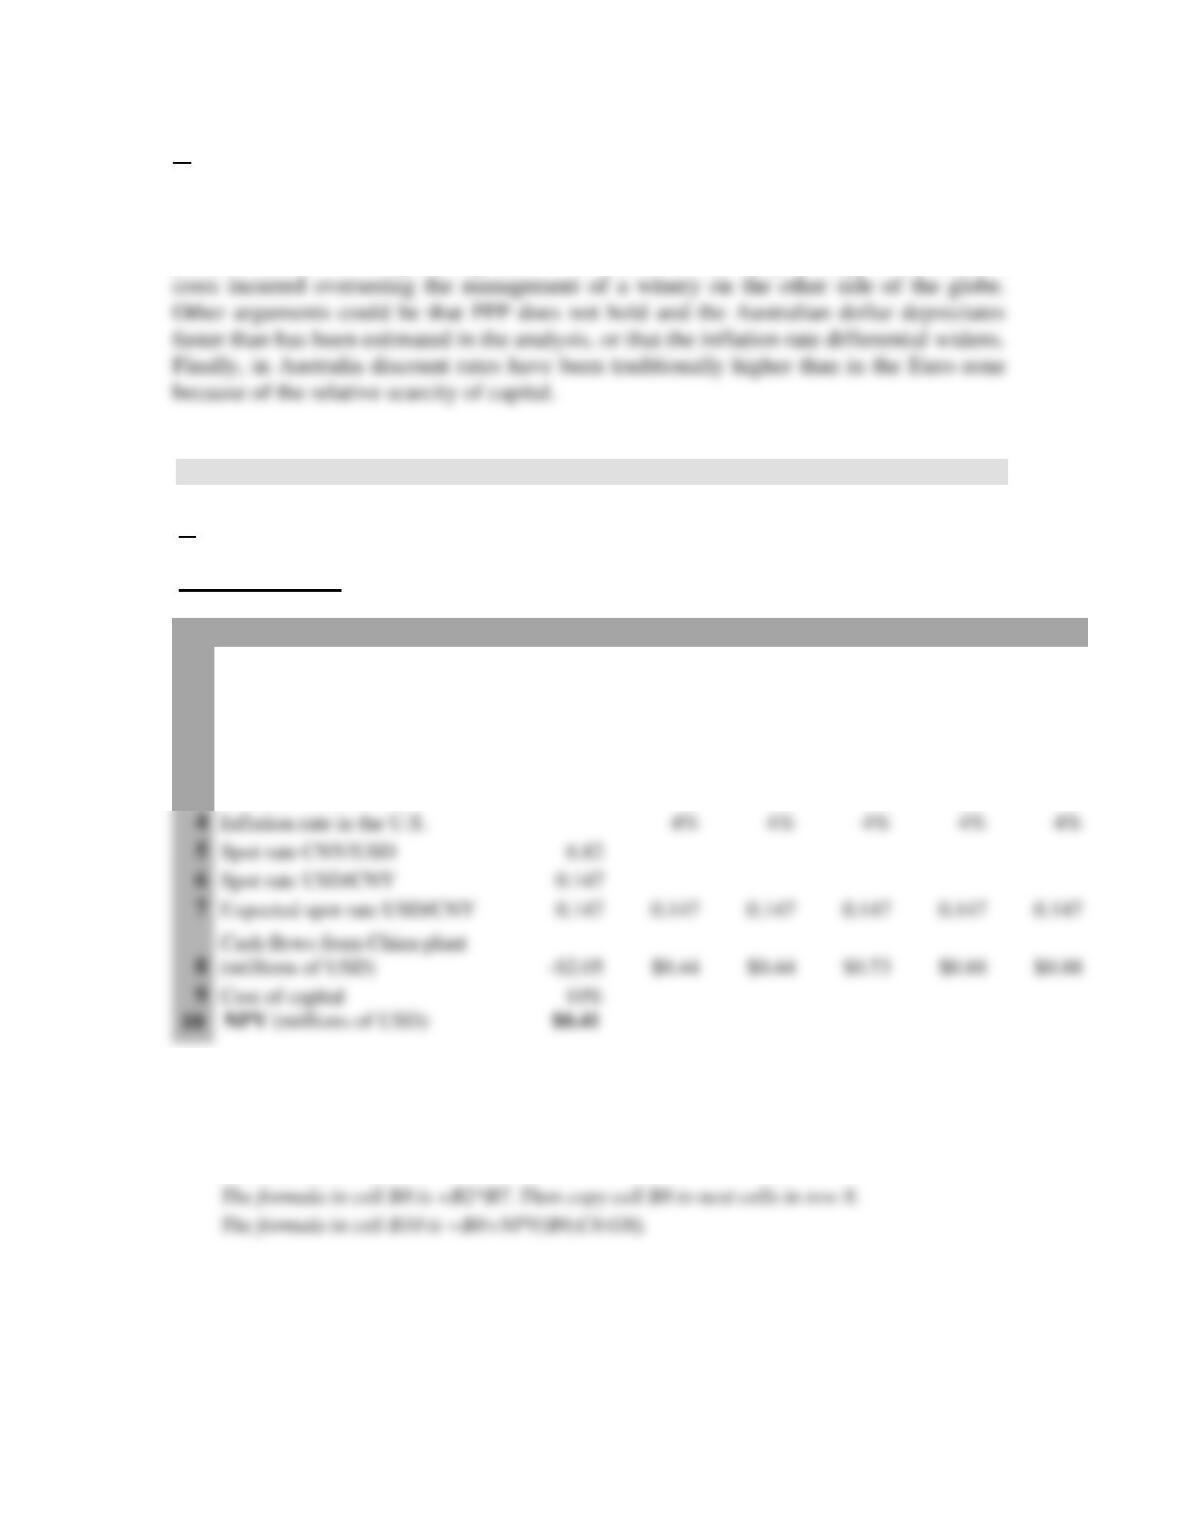
10. International Capital Budgeting (3).
a.
Project in China
A
B
C
D
E
F
G
1
Now
Year-end
1
Year-end
2
Year-end
3
Year-end
4
Year-end
5
2
Cash flows from China plant
(millions of Yuan)
-¥14.00
¥3.00
¥3.00
¥5.00
¥6.00
¥6.00
3
Inflation rate in China
4%
4%
4%
4%
4%
4
Inflation rate in the U.S.
4%
4%
4%
4%
4%
5
Spot rate CNY/USD
6
Spot rate USD/CNY
0.147
7
Expected spot rate USD/CNY
0.147
0.147
0.147
0.147
0.147
0.147
8
Cash flows from China plant
(millions of USD)
$0.44
$0.44
$0.73
$0.88
$0.88
9
Cost of capital
Rows 2 – 5 and 9 are data.
The formula in cell B6 is = 1/B5.
The formula in cell B7 is = B6. The formula in cell C7 is =B7*(1+C4)/(1+C3). Then copy cell C7 to
next cells in row 7.
The formula in cell B8 is =B2*B7. Then copy cell B8 to next cells in row 8.
The formula in cell B10 is =B8+NPV(B9;C8:G8).
14-10
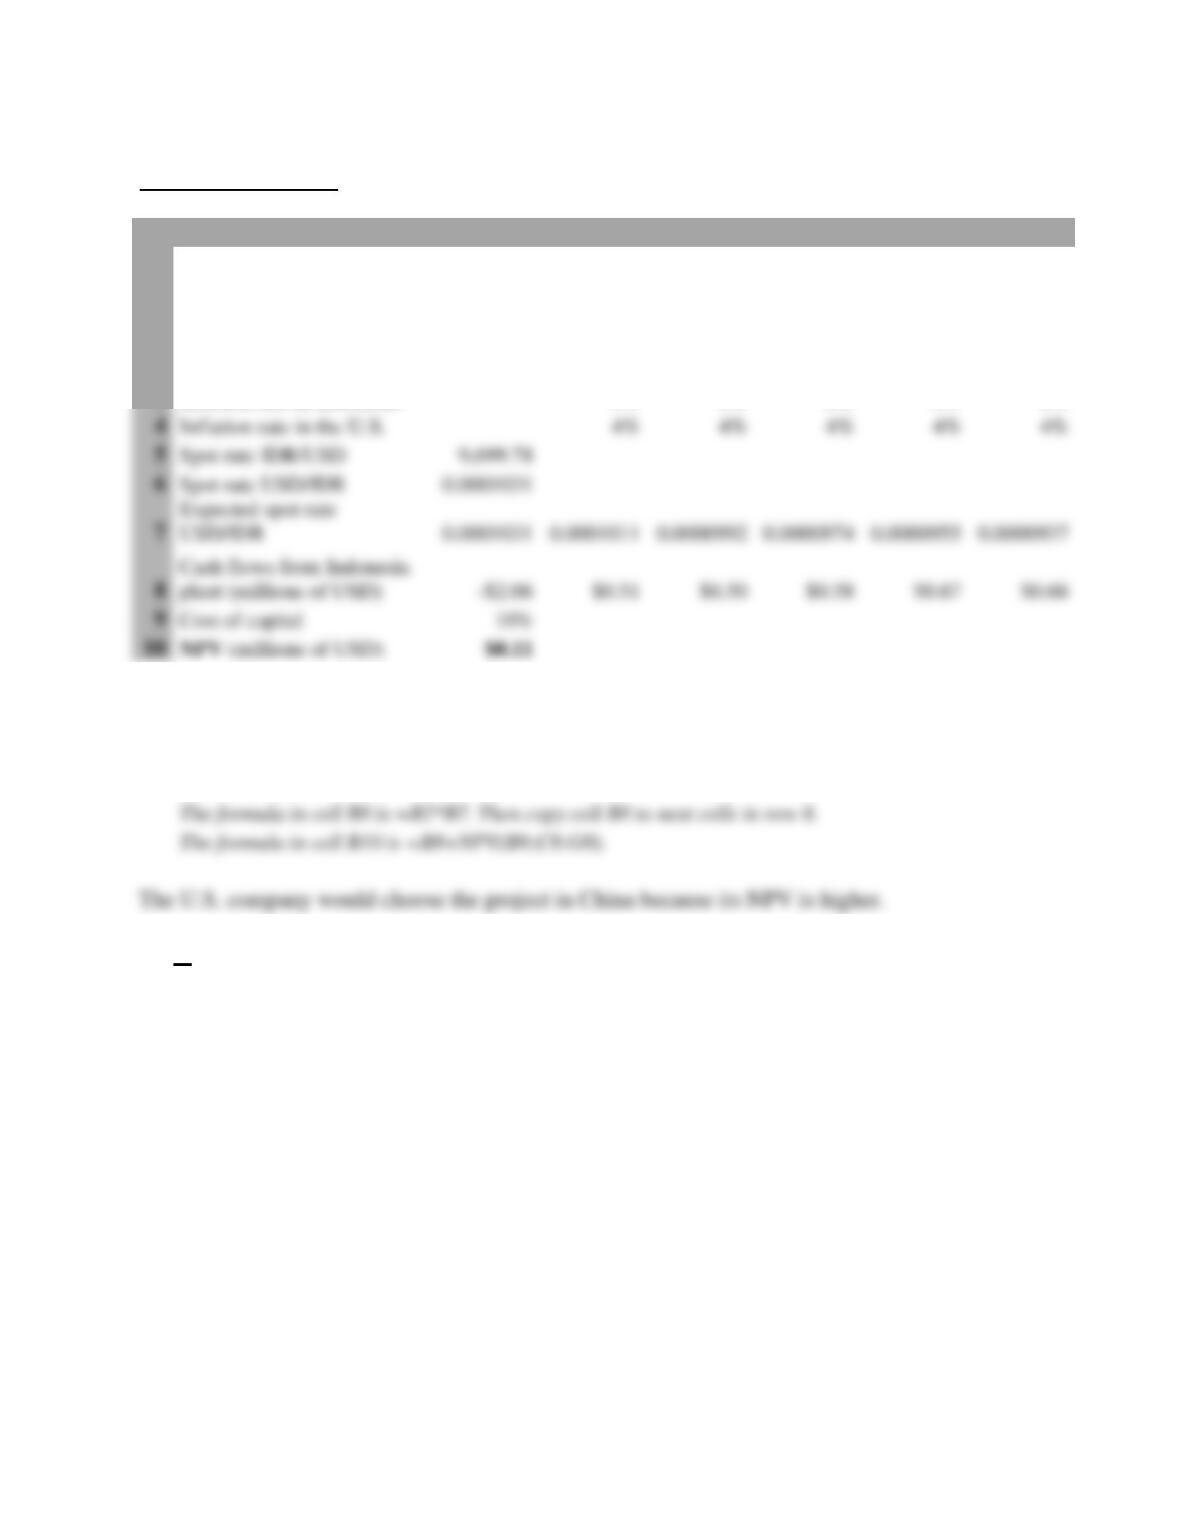
Project in Indonesia
A
B
C
D
E
F
G
1
Now
Year-end
1
Year-end
2
Year-end
3
Year-end
4
Year-end
5
2
Cash flows from Indonesia
plant (millions of Rupiah)
–Rp20,000
Rp5,000
Rp5,000
Rp6,000
Rp7,000
Rp7,000
3
Inflation rate in Indonesia
6%
6%
6%
6%
6%
Rows 2 – 5 and 9 are data.
The formula in cell B6 is = 1/B5.
The formula in cell B7 is = B6. The formula in cell C7 is =B7*(1+C4)/(1+C3). Then copy cell C7 to
next cells in row 7.
The formula in cell B8 is =B2*B7. Then copy cell B8 to next cells in row 8.
The formula in cell B10 is =B8+NPV(B9;C8:G8).
The U.S. company would choose the project in China because its NPV is higher.
b.
If the NPV of two projects are positive and equal, the U.S. company could consider the
project which provides more diversification to its investment portfolio and the country
with more political stability.
4
Inflation rate in the U.S.
4%
4%
4%
4%
4%
5
Spot rate IDR/USD
6
Spot rate USD/IDR
0.0001031
7
Expected spot rate
0.0001031
0.0001011
0.0000992
0.0000974
0.0000955
0.0000937
8
Cash flows from Indonesia
plant (millions of USD)
9
Cost of capital