
Chapter 13: Financial Statement Analysis
227. The following information is available from the balance sheets at the end of 2017 and 2016 for Riverside Company:
2017
2016
Accounts payable
$ 80,000
$ 40,000
Accrued liabilities
65,000
25,000
Taxes payable
10,000
20,000
Short-term notes payable
-0-
60,000
Bonds payable due within next year
200,000
200,000
Total current liabilities
$ 355,000
$ 345,000
Bonds payable
$ 800,000
$ 300,000
Common stock, $5 par
$1,000,000
$1,000,000
Retained earnings
695,000
55,000
Total stockholders’ equity
$1,695,000
$1,055,000
Total liabilities and stockholders’ equity
$2,850,000
$1,700,000
Net income for 2017 and 2016 was $340,000 and $300,000, respectively. Answer the following:
A)
Calculate the return on common stockholders’ equity ratio for 2017.
B)
What information is provided to users with the calculation in part A? Explain.
C)
What is the difference between the return on stockholders’ equity ratio and the return
on assets ratio?
ANSWER:
A)
(Net income – Preferred dividends)/Average common stockholders’ equity =
($340,000 – $0)/[($1,695,000 + $1,055,000)/2] = 24.7%
B)
This ratio provides the return (earnings percentage) provided by only the
investments from common stockholders. It indicates that the company earned
24.7 cents on every dollar invested by stockholders.
C)
The return on assets ratio provides the return provided by the stockholders and
creditors. The return on common stockholders’ equity ratio indicates the return
provided by common stockholders only.
DIFFICULTY:
Moderate
LEARNING OBJECTIVES:
FACC.PONO.13.13-06 – LO: 13-06
KEYWORDS:
Bloom’s: Analyzing

228. The following information is available from the balance sheets at the end of 2017 and 2016 for Kitchen Equipment
Company.
2017
2016
Accounts payable
$ 120,000
$ 100,000
Accrued liabilities
35,000
30,000
Taxes payable
40,000
10,000
Short-term notes payable
-0-
80,000
Bonds payable due within next year
300,000
100,000
Total current liabilities
$ 495,000
$ 320,000
Bonds payable
$ 600,000
$ 500,000
Common stock, $5 par
$ 800,000
$ 800,000
Retained earnings
200,000
100,000
Total stockholders’ equity
$1,000,000
$ 900,000
Total liabilities and stockholders’ equity
$2,095,000
$1,720,000
Net income for 2017 and 2016 was $120,000 and $460,000, respectively. No stock was issued during either year. Answer
the following:
A)
How many shares of stock are outstanding at the end of 2017?
B)
If a company has preferred stock, why are preferred dividends subtracted when
computing earnings per share?
C)
What is the amount of earnings per share for the year ended December 31, 2017?
D)
Explain what information is provided with earnings per share.
ANSWER:
A)
$800,000/$5 = 160,000 shares
B)
Earnings per share tells how much earnings the company made per share of
common stock alone.
C)
$120,000/160,000 = $0.75
D)
Earnings per share provides users with the amount of profits earned per share of
common stock outstanding. It is not an indicator of dividends.
DIFFICULTY:
Easy
LEARNING OBJECTIVES:
FACC.PONO.13.13-06 – LO: 13-06
KEYWORDS:
Bloom’s: Analyzing

Chapter 13: Financial Statement Analysis
Knife Corp.
Use the selected data presented below from the financial statements of Knife Corp. for 2017 and 2016 to answer the
questions that follow.
2017
2016
Net income
$110,000
$123,000
Cash dividends paid on preferred stock
$12,000
$15,000
Cash dividends paid on common stock
$42,000
$38,000
Weighted average number of common shares outstanding
105,000
95,000
Market price per share of common stock at the end of the year
$16.00
$13.00
229. Refer to the data for Knife Corp.
Required:
(A) Calculate earnings per share for 2017 for Knife. Why is this considered one of the most quoted ratios for public
companies? Which investors, common or preferred or both, desire this information?
(B) Calculate the price/earnings ratio for 2017 for Knife. Why is this ratio important to investors? Explain.
ANSWER:
(A) (Net income – Preferred dividends)/Weighted average number of common shares
outstanding = ($110,000 – $12,000)/105,000 = $0.93 per common share
Earnings per share is considered one of the most quoted ratios since it appears on the income
statement as required by GAAP. Since earnings per share is an indicator of the earnings made
by the company per share of common stock, the common stock investors would be more
interested in this amount.
(B) (Net income – Preferred dividends)/Weighted average number of common shares
outstanding = ($110,000 – $12,000)/105,000 = $0.93 per common share
Market price/Earnings per share = $16.00/$0.93 = 17.2 to 1
This ratio is an indicator of the quality of earnings. It reflects the market value of the stock,
not just the company’s book earnings. Market value is a strong indicator of the worth of the
company as perceived by investors.
DIFFICULTY:
Moderate
LEARNING OBJECTIVES:
FACC.PONO.13.13-06 – LO: 13-06
KEYWORDS:
Bloom’s: Analyzing

230. Refer to the data for Knife Corp.
Required:
(A) Calculate the dividend yield ratio for 2017 for Knife. Explain.
(B) What factors could have caused the change in the market value of Knife’s stock from 2016 to 2017? Explain.
ANSWER:
(A) Common dividends per share/Market price per share = ($42,000/105,000)/$16 = 2.5%
This ratio indicates the percent of dividends paid for each share of stock at today’s value on
the market. This is a relatively low return. A low return indicates that investors buy stock
other than for the return of dividends, perhaps for the long-run growth potential of the stock.
(B) The market value climbed from $13 to $16 per share. Earnings for the company can
increase this ratio, as well as a decline in the number of shares of stock outstanding during
the year. Economic conditions also have an impact on market stock prices.
DIFFICULTY:
Moderate
LEARNING OBJECTIVES:
FACC.PONO.13.13-06 – LO: 13-06
KEYWORDS:
Bloom’s: Analyzing
St. Petersburg Corporation
Use the information obtained from the comparative financial statements included in the St. Petersburg Corporation’s 2017
annual report that is presented below to answer the questions that follow. All amounts are in thousands of dollars.
Dec. 31, 2017
Dec. 31, 2016
Total assets
$800,000
$975,000
Total common stockholders‘ equity
405,000
578,000
Total stockholders’ equity
504,000
702,000
December 31
FOR THE FISCAL YEARS ENDED
2017
2016
Interest expense, net of tax
$ 5,000
$ 4,700
Interest expense
6,100
5,800
Income tax expense
22,600
32,600
Net income
110,000
27,000
Common dividends
12,600
7,200
Net sales
2,667,600
1,971,000
Preferred dividends
9,000
14,400

231. Refer to the financial information for St. Petersburg Corporation.
Required:
(A) Calculate the return on assets ratio for St. Petersburg for 2017. What is the reason for the adjustment of interest?
(B) Calculate the return on common stockholders’ equity ratio for 2017 for St. Petersburg. What is the reason for the
adjustment of preferred dividends?
ANSWER:
(A) (Net income + Interest expense, net of tax)/Average total assets = ($110,000 +
$5,000)/[($800,000 + $975,000)/2] = 13.0%
Interest is removed from net income to be consistent with considering creditors to be a group
who provides funds to the company (and charges interest as a result). The rate of return
represents the amount the company earned for both creditors and investors.
(B) (Net income – Preferred dividends)/Average common stockholders’ equity = ($110,000 –
$9,000)/[($405,000 + $578,000)/2] = 20.5%
Preferred dividends are removed because the ratio is an indicator of the company earnings for
each dollar invested by common stockholders alone.
DIFFICULTY:
Moderate
LEARNING OBJECTIVES:
FACC.PONO.13.13-06 – LO: 13-06
KEYWORDS:
Bloom’s: Analyzing
232. Refer to the financial information for St. Petersburg Corporation.
Required:
(A) Identify the two components of the return on assets ratio for St. Petersburg. Explain the change in the return on assets
ratio during 2017 as it relates to these components.
(B) During 2017, how much is St. Petersburg’s average cost of borrowed capital as compared to the cost of the money
provided by the preferred stockholders? Which is the more profitable? Explain.
ANSWER:
(A) The two components are the return on sales ratio and the asset turnover ratio:
Return on sales ratio = (Net income + Interest expense, net of tax)/Net sales =
($110,000 + $5,000)/$2,667,600 = 4.3%
Asset turnover ratio = Net sales/Average total assets =
$2,667,600/[($800,000 + $975,000)/2] = 3.01 times
The change results from a 4.3% increase related to the return on sales ratio, and a turnover of
slightly more than 3 times of net sales as compared to total assets.
(B) Debt: Interest expense/Average debt =
DIFFICULTY:
Moderate
LEARNING OBJECTIVES:
FACC.PONO.13.13-06 – LO: 13-06

233. Refer to the financial information for St. Petersburg Corporation.
Required:
During 2017, has St. Petersburg successfully employed favorable leverage based on the average cost of capital? What
action should the company take?
ANSWER:
The return on assets ratio is a good indicator of how much the company earned:
(Net income + Interest expense, net of tax)/Average total assets =
($110,000 + $5,000)/[($800,000 + $975,000)/2] = 13.0%
The average cost of borrowed money and preferred equity is determined as:
Debt: Interest expense/Average debt =
$6,100/[($800,000 – $504,000) + ($975,000 – $702,000)/2] = 2.1%
Preferred stockholders: Preferred dividends/Preferred stockholders’ equity
$9,000/($504,000 – $405,000) = 9.1%
Since the return of 13.0% is greater than the cost of preferred stockholders and debt, the
company has succeeded in favorably using leverage to earn additional profits.
DIFFICULTY:
Moderate
LEARNING OBJECTIVES:
FACC.PONO.13.13-06 – LO: 13-06
KEYWORDS:
Bloom’s: Analyzing
234. Refer to the financial information for St. Petersburg Corporation.
Required:
Calculate the earnings per share for St. Petersburg for 2017 and 2016 assuming an average of 100,000 common shares
were outstanding during 2017 and an average of 80,000 common shares were outstanding during 2016. Explain the
change as it probably relates to the market value of the stock.
ANSWER:
(Net income – Preferred dividends)/Weighted average shares =
2017: ($110,000 – $9,000)/100,000 = $1.01 per share
2016: ($27,000 – $14,400)/80,000 = $0.16 per share
When earnings per share increases, it is an indicator that the company is becoming more
profitable. When earnings per share declines, it is an indicator that the company’s profits are
down. Investors react accordingly. When earnings are up, more shares of stock are sold on
the market, which causes the market price of stock to increase. St. Petersburg’s earnings per
share increased, which indicates that the company’s market price per share probably
increased also.
DIFFICULTY:
Moderate
LEARNING OBJECTIVES:
FACC.PONO.13.13-06 – LO: 13-06
KEYWORDS:
Bloom’s: Analyzing
235. Starlight Cruises reported net income of $2,880 million for the year ended December 31, 2017. Total stockholders’
equity for the year ended December 31, 2017, was $20,100 million and on December 31, 2016, it was $20,900 million. No
preferred stock was outstanding in either year.
Required:
1. Compute Starlight’s return on common stockholders’ equity for the year ended December 31, 2017.
2. What other ratio would you want to compute to decide whether Starlight is successfully employing leverage? Explain
your answer.
ANSWER:
1. Starlight’s return on common stockholders’ equity ratio (amounts in millions):
= Net Income – Preferred Dividends/(Average Common Stockholders’ Equity)
= $2,880 – $0/[($20,100 + $20,900)/2]
= $2,880/$20,500 = 0.14
2. Return on assets is a ratio needed to decide if Starlight is successfully employing leverage.
The excess of return on equity over the return on assets indicates if management has been
successful in employing leverage.
DIFFICULTY:
Easy
LEARNING OBJECTIVES:
FACC.PONO.13.13-06 – LO: 13-06
KEYWORDS:
Bloom’s: Analyzing

236. The following selected data are taken from the financial statements of Ulysses Company:
Sales revenue
$ 650,000
Cost of goods sold
300,000
Gross profit
$ 350,000
Selling and administrative expense
150,000
Operating income
$ 200,000
Interest expense
75,000
Income before tax
$ 125,000
Income tax expense (40%)
50,000
Net income
$ 75,000
Accounts payable
$ 55,000
Accrued liabilities
70,000
Income taxes payable
10,000
Interest payable
25,000
Short-term loans payable
200,000
Total current liabilities
$ 360,000
Long-term bonds payable
$ 600,000
Preferred stock, 10%, $100 par
$ 250,000
Common stock, no par
600,000
Retained earnings
550,000
Total stockholders’ equity
$1,400,000
Total liabilities and stockholders’ equity
$2,360,000
Required:
1. Compute the following ratios for Ulysses Company:
a. Return on sales
b. Asset turnover (Assume that total assets at the beginning of the year were $1,600,000.) Round final answers to 3
decimals.
c. Return on assets
d. Return on common stockholders’ equity (Assume that the only changes in stockholders’ equity during the year were
from the net income for the year and dividends on the preferred stock.)
2. Comment on Ulysses’ use of leverage. Has it successfully employed leverage?
Explain.
ANSWER:
1. Ratios:
a. Return on Sales = (Net Income + Interest Expense, Net of Tax)/Net Sales
= [$75,000 + ($75,000 × 60%)]/$650,000
= $120,000/$650,000 = 18.46%

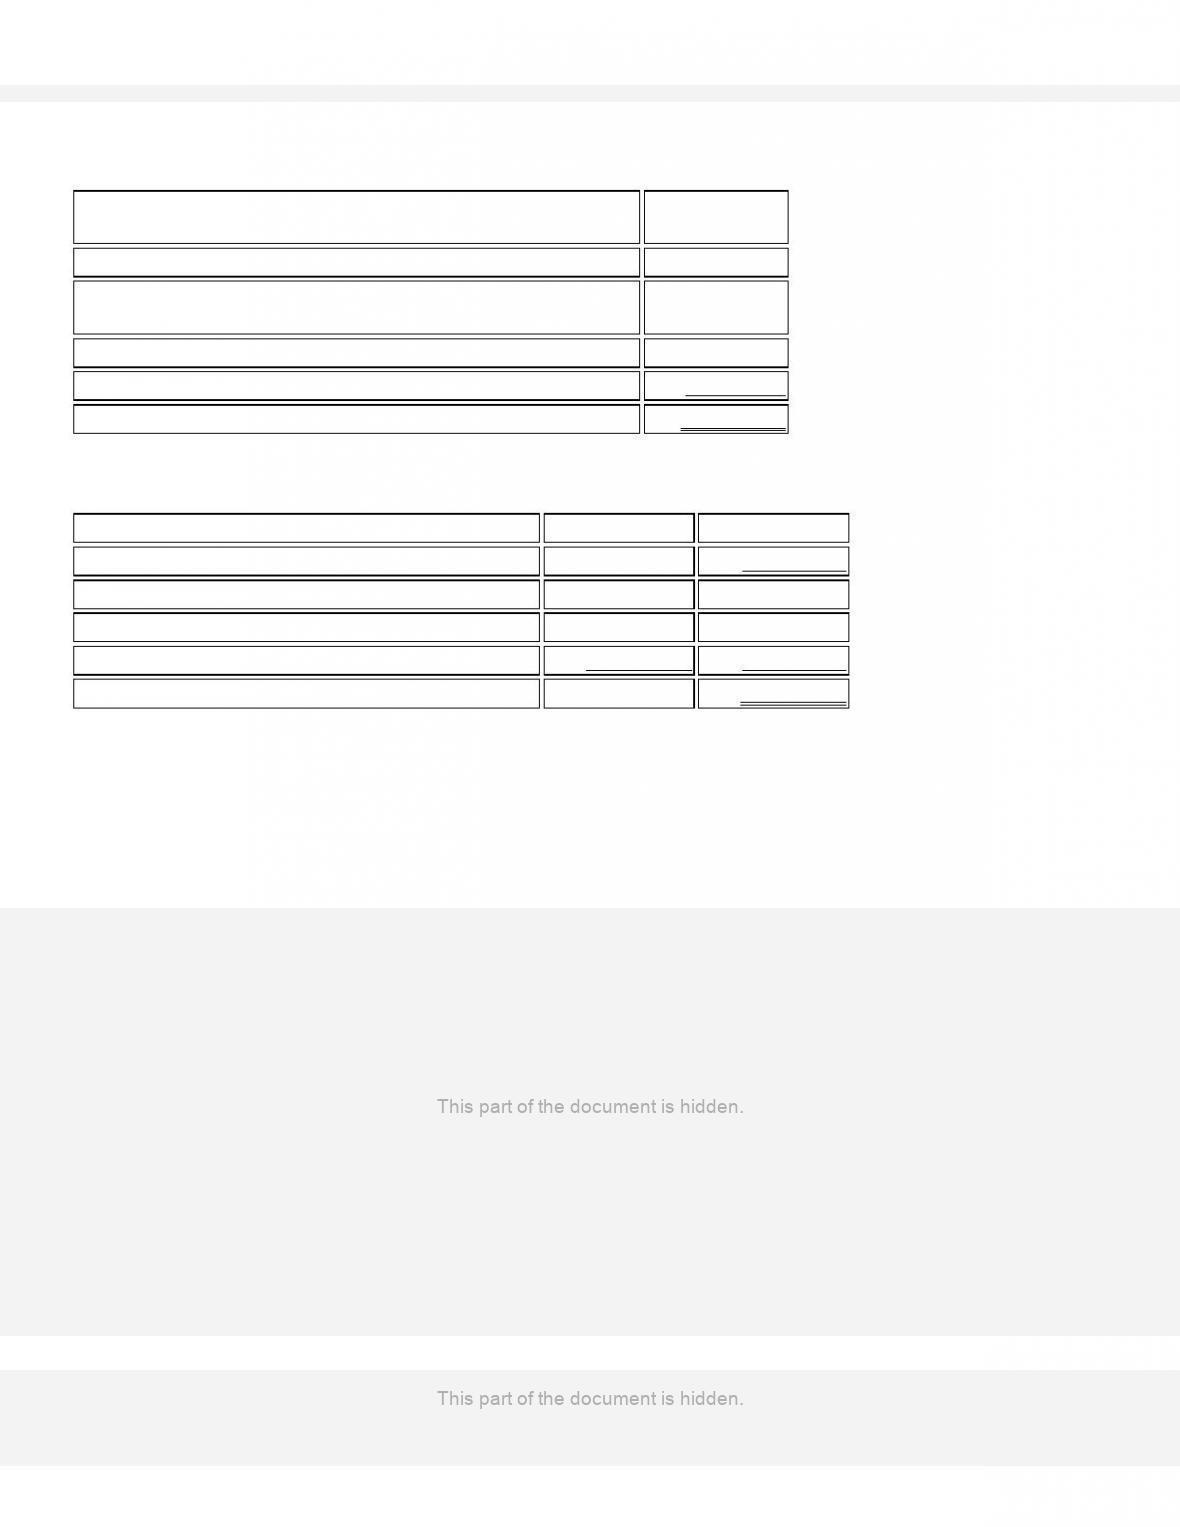
237. The Stockholders’ Equity section of the balance sheet for Grant Corp. at the end of 2016 appears as follows:
7%, $100 par, cumulative preferred stock, 200,000 shares authorized,
55,000 shares issued and outstanding
$ 5,500,000
Additional paid-in capital on preferred
2,500,000
Common stock, $5 par, 500,000 shares authorized, 420,000 shares
issued and outstanding
2,100,000
Additional paid-in capital on common
18,000,000
Retained earnings
32,500,000
Total stockholders’ equity
$60,600,000
Net income for the year was $1,250,000. Dividends were declared and paid on the preferred shares during the year, and a
quarterly dividend of $0.30 per share was declared and paid each quarter on the common shares. The closing market price
for the common shares on December 31, 2016, was $24.72 per share.
Required:
1. Compute the following ratios for the common stock:
a. Earnings per share
b. Price/earnings ratio
c. Dividend payout ratio
d. Dividend yield ratio
2. Assume that you are an investment adviser. What other information would you want to have before advising a client
regarding the purchase of Grant stock?
ANSWER:
1. Ratios:
a. Earnings per Common Share = (Net Income – Preferred Dividends)/Number of Common
Shares Outstanding
= [$1,250,000 – 7%($5,500,000)]/420,000 shares
= ($1,250,000 – $385,000)/420,000
= $865,000/420,000 = $2.06 per share
b. Price/Earnings Ratio = Current Market Price/EPS
= $24.72/$2.06 = 12 to 1
c. Dividend Payout Ratio = Common Dividends per Share/EPS
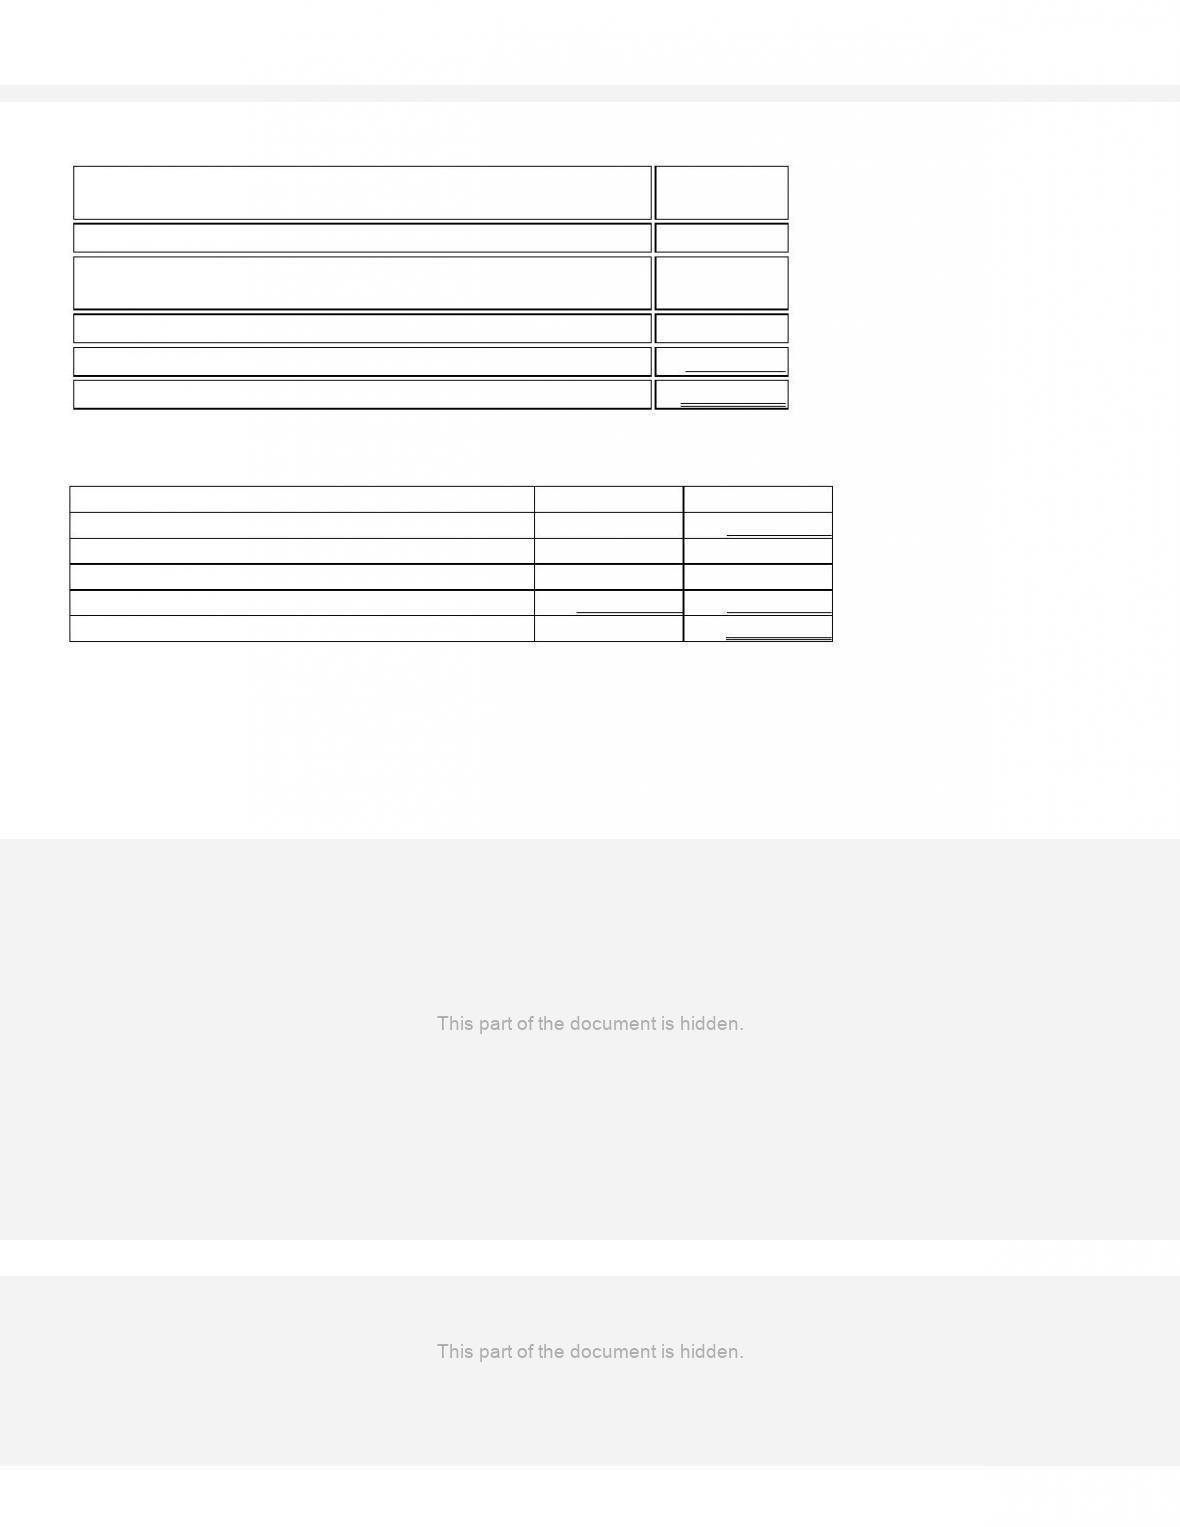
238. The Stockholders’ Equity section of the balance sheet for Brompton Construction Company at the end of 2016 is as
follows:
10%, $10 par, cumulative preferred stock, 500,000 shares
authorized, 200,000 shares issued and outstanding
$ 2,000,000
Additional paid-in capital on preferred
7,500,000
Common stock, $1 par, 2,500,000 shares authorized, 2,000,000
shares issued and outstanding
2,000,000
Additional paid-in capital on common
21,000,000
Retained earnings
25,500,000
Total stockholders’ equity
$58,000,000
The lower portion of the 2016 income statement indicates the following:
Net income before tax
$ 9,900,000
Income tax expense (40%)
(3,960,000)
Income before extraordinary items
$ 5,940,000
Extraordinary loss from hurricane
$(6,000,000)
Less related tax effect (40%)
2,400,000
(3,600,000)
Net income
$ 2,340,000
Assume that the number of shares outstanding did not change during the year.
Required:
1. Compute earnings per share before extraordinary items.
2. Compute earnings per share after the extraordinary loss.
3. Which of the two EPS ratios is more useful to management? Explain your answer. Would your answer be different if
the ratios were to be used by an outsider, like a potential stockholder? Why or why not?
ANSWER:
1. Earnings per Share (before extraordinary items) = [Net income (before extraordinary loss)
– Preferred Dividends]/Number of Common Shares Outstanding
= [$5,940,000 – 10%($2,000,000)]/2,000,000 shares
= ($5,940,000 – $200,000)/2,000,000 shares
= $5,740,000/2,000,000 shares = $2.87 per share
2. Earnings per Share (after the extraordinary loss) = (Net Income – Preferred
Dividends)/Number of Common Shares Outstanding
239. The Stockholders’ Equity section of the balance sheet for Calhoun Industries at the end of 2016 is as follows:
12.5%, $10 par, cumulative preferred stock, 500,000 shares
authorized, 200,000 shares issued and outstanding
$ 2,000,000
Additional paid-in capital on preferred
7,500,000
Common stock, $1 par, 2,500,000 shares authorized, 2,000,000
shares issued and outstanding
2,000,000
Additional paid-in capital on common
21,000,000
Retained earnings
25,500,000
Total stockholders’ equity
$58,000,000
The lower portion of the 2016 income statement indicates the following:
Net income before tax
$12,500,000
Income tax expense (30%)
(3,750,000)
Income before extraordinary items
$ 8,750,000
Extraordinary loss from tornado
$(5,000,000)
Less related tax effect (30%)
1,500,000
(3,500,000)
Net income
$ 5,250,000
Assume that the number of shares outstanding did not change during the year.
Required:
1. Compute earnings per share before extraordinary items.
2. Compute earnings per share after the extraordinary loss.
3. Which of the two EPS ratios is more useful to management? Explain your answer. Would your answer be different if
the ratios were to be used by an outsider, like a potential stockholder? Why or why not?
ANSWER:
1. Earnings per Share (before extraordinary items) = [Net income (before extraordinary loss) – Preferred
Dividends]/Number of Common Shares Outstanding
= [$8,750,000 – 12.5%($2,000,000)]/2,000,000 shares
= ($8,750,000 – $250,000)/2,000,000 shares
= $8,500,000/2,000,000 shares = $4.25 per share
2. Earnings per Share (after the extraordinary loss) = (Net Income – Preferred Dividends)/Number of
Common Shares Outstanding
= ($5,250,000 – $250,000)/2,000,000 shares
= $5,000,000/2,000,000 = $2.50 per share
Moderate
Bloom’s: Analyzing

240. Use the current asset section of the balance sheets of the Breeze Company as of June 30, 2017 and 2016 presented
below to prepare a horizontal analysis.
2017
2016
Cash and cash equivalents
$ 16,000
$ 20,000
Accounts receivable, net
40,000
30,000
Inventory
30,000
50,000
Prepaid rent
18,000
12,000
Total current assets
$ 104,000
$ 112,000
Land
$ 150,000
$150,000
Plant and equipment
800,000
600,000
Accumulated depreciation
(130,000)
(60,000)
Total long-term assets
$ 820,000
$690,000
Total assets
$ 924,000
$802,000
Required:
1. Complete a horizontal analysis of the current asset section of Breeze Company’s balance sheets for 2017 and 2016.
Your answers should be rounded to the nearest percentage. Show decreases in parentheses.
2. Identify the three items on the this current asset section that experienced the largest change from one year to the next.
For each of these items, explain where you would look to find additional information about the change.
ANSWER:
1.
2017
2016
$ Change
% Change
Cash and cash
equivalents
$ 16,000
$ 20,000
$ (4,000)
(20)%
Accounts receivable,
net
40,000
30,000
10,000
33
Inventory
30,000
50,000
(20,000)
(40)
Prepaid Rent
18,000
12,000
6,000
50
Total current assets
$ 104,000
$112,000
$ (8,000)
(7)
Land
$ 150,000
$150,000
$ 0
0
Plant and equipment
800,000
600,000
200,000
33
Accumulated
Depreciation
(130,000)
(60,000)
(70,000)
(117)
Total long-term assets
$ 820,000
$690,000
$130,000
19
Total assets
$ 924,000
$802,000
$122,000
15
2. Largest changes Refer to
a. Accumulated depreciation Fixed asset records, showing
additions to plant and equipment
and depreciation calculations
b. Prepaid rent Rental agreements
c. Inventory Purchase orders, sales records
DIFFICULTY:
Moderate
LEARNING OBJECTIVES:
FACC.PONO.13.13-03 – LO: 13-03
KEYWORDS:
Bloom’s: Analyzing
241. Lockhart Corp.’s December 31, 2016, balance sheet reported current assets of $120,000 and current liabilities of
$100,000. The current ratio increased by 25% one year later, on December 31, 2017. Current liabilities on this date were
$140,000. Determine current assets on December 31, 2017.
ANSWER:
The current ratio on December 31, 2016, is $120,000/$100,000 = 1.20. The ratio increased
during 2016 by 25%; thus, the ratio at the end of 2017 is 1.20 × 125% = 1.50. Current
liabilities are $140,000 at the end of 2017; thus, current assets are $140,000 × 1.50 =
$210,000.
DIFFICULTY:
Moderate
LEARNING OBJECTIVES:
FACC.PONO.13.13-04 – LO: 13-04
KEYWORDS:
Bloom’s: Analyzing
242. Shoreville Corp.’s December 31, 2016, balance sheet reported current assets of $260,000 and current liabilities of
$200,000. The current ratio increased by 20% one year later, on December 31, 2017. Current liabilities on this date were
$280,000. Determine current assets on December 31, 2017.
ANSWER:
The current ratio on December 31, 2016, is $260,000/$200,000 = 1.30. The ratio increased
during 2017 by 20%; thus, the ratio at the end of 2017 is 1.30 × 120% = 1.56. Current
liabilities are $280,000 at the end of 2017; thus, current assets are $280,000 × 1.56 =
$436,800.
DIFFICULTY:
Moderate
LEARNING OBJECTIVES:
FACC.PONO.13.13-04 – LO: 13-04
KEYWORDS:
Bloom’s: Analyzing
Essay
turnover ratios must be constantly monitored by management. The stockholder will be very interested in
both the dividend payout ratio and the dividend yield. A banker would rely partially on a company’s debt
DIFFICULTY:
Easy
KEYWORDS:
Bloom’s: Analyzing
245. For what purpose is horizontal analysis used by management? Is this information provided to stockholders? If so, in
what form? If not, why?
ANSWER:
Horizontal analysis is used to track the relative behavior in changes of percentages of financial statement
items from one period to the next. It can flag increases or decreases that need to be examined more
closely by management. It helps with controlling expenses. In annual reports, management provides
horizontal analysis as supplemental information by showing trends over longer periods of time.
DIFFICULTY:
Moderate
KEYWORDS:
Bloom’s: Applying
246. The Starch Company experiences a 20% increase in sales over the previous year. However, gross profit actually
decreased by 10% from the previous year. What are some of the possible causes for an increase in sales but a decline in
gross profit?
ANSWER:
Rising costs to either manufacture or purchase inventory could be responsible for a decline in gross profit
in the face of an increase in sales. Assume that 1,000 units of a product are sold with a unit cost of $75
and a selling price of $100. Sales total $100,000, and gross profit is $25,000. Assume that in the following
year, the company raises the selling price to $120 because of rising costs. If the cost to make a unit goes
up to $97.50 and the company sells another 1,000 units, sales will increase by 20% to $120,000, but gross
profit will decrease to 1,000 × ($120 – $97.50), or $22,500—a decrease in gross profit of 10%.
DIFFICULTY:
Moderate
KEYWORDS:
Bloom’s: Applying
247. Why is liquidity important for businesses?
ANSWER:
Liquidity is a relative measure of the nearness to cash of the assets and liabilities of a company. This is an
indicator of the length of time before cash is realized. Liquidity is a strong indicator of the ability of a
company to pay its current debts.
DIFFICULTY:
Easy
KEYWORDS:
Bloom’s: Applying
248. What situations could cause a decrease in the current ratio, but an increase in the acid-test ratio? If this happens, is
management to be commended or is a problem evident? Explain
ANSWER:
The current ratio is comprised of current assets divided by current liabilities. Since the acid-test ratio does
not contain inventory or prepaid items, it is always less than the current ratio. The current ratio will
decrease when total current liabilities increase or when total current assets decrease. The increase in the
acid-test ratio must be larger than a decline in the other current assets, to create this situation.
DIFFICULTY:
Easy
KEYWORDS:
Bloom’s: Applying
249. What is meant by the concept of “activity” as it relates to turnover ratios? Explain.
ANSWER:
Activity means that a ratio consists of a company’s particular activity, such as sales or cost of goods sold.
In activity ratios, the activity (the income statement amount) is divided by the base to which it naturally
relates, such as inventory to cost of goods sold, or accounts receivable to sales.
DIFFICULTY:
Easy
KEYWORDS:
Bloom’s: Applying
250. What makes the analysis of a service company different from the analysis of a merchandising company?
ANSWER:
A service company has a different operating cycle than a merchandising or manufacturing company. The
operating cycle is the period it takes to turn cash back into cash again. While a service company need only
provide the services and convert accounts receivables into cash, a merchandising company must acquire
products, sell them, and then convert their receivables into cash.
DIFFICULTY:
Moderate
KEYWORDS:
Bloom’s: Applying
251. Service-oriented companies have different needs than product-oriented companies when analyzing financial
statements.
REQUIRED: Why is this true? Give an example of a financial ratio that is meaningless to a service business.
ANSWER:
Because service-oriented companies do not sell a tangible product, they instead must sell their
professional expertise and rely on alternative measures of their efficiency in marketing their services. For
example, an law firm would keep detailed records of the hours worked on each client’s case, monthly
billings to each client, and the ratio of these billings to the average costs incurred on each case. Therefore,
ratios like inventory turnover would be meaningless to a service business, like a law firm or a public
accounting firm.
DIFFICULTY:
Moderate
KEYWORDS:
Bloom’s: Applying
252. Would a banker be more interested in the liquidity or the profitability of a company? Explain.
ANSWER:
A banker is more interested in the likelihood that a loan will be repaid. Liquidity and solvency are both
analyses that must be assessed. Liquidity indicates the company’s ability to pay debt on a current basis,
whereas solvency indicates whether the company can pay debt on a longer-term basis.
DIFFICULTY:
Easy
KEYWORDS:
Bloom’s: Applying
253. What is meant by a company’s “long-term financial health”? Which side of the balance sheet is more informative for
this issue? Explain.
ANSWER:
Solvency is a company’s long-term financial health in which capital structure is the focal point. The right-
hand side of the balance sheet provides the mix between debt and stockholders’ equity. The composition
of debt and stockholders’ equity determines the cost of capital to a company.
DIFFICULTY:
Moderate
KEYWORDS:
Bloom’s: Applying
254. What is the best way to assess solvency? Explain.
ANSWER:
Evaluating leverage best assesses solvency. A company should earn a profit that is greater than the cost of
capital. This can be assessed by evaluating the debt-to-equity ratio to determine the company’s ability to
repay principal, the times interest earned ratio to determine the company’s ability to pay interest, and the
debt service coverage ratio, which evaluates the company’s ability to pay both interest and principal.
DIFFICULTY:
Moderate
KEYWORDS:
Bloom’s: Applying
255. Ware Company has a return on assets of 15% and a return on common stockholders’ equity of 10%. John Ware, the
president of the company, has asked you to explain the reason for this difference. What causes the difference? How is the
concept of financial leverage involved?
ANSWER:
A return on stockholders’ equity that is lower than the return on assets means that Ware Company is not
successfully using borrowed funds. Return on assets measures the return to all providers of capital,
whereas return on equity is concerned only with common stockholders. It appears that the company has
not been able to earn an overall return that is as high as what is being paid to creditors and preferred
stockholders. Leverage deals with the use of someone else’s money to earn a favorable return. Presently,
Ware Company is not successfully employing financial leverage.
DIFFICULTY:
Moderate
KEYWORDS:
Bloom’s: Applying
256. What importance is placed on a company’s stock price in the ratio analysis of a company? Explain.
ANSWER:
The desire of the investors to relate the earnings of a company to the market price of the stock affects the
market price directly. When earnings per share increases, it is an indicator that the company is profitable.
When earnings per share declines, it is an indicator that the company is not. Investors react accordingly.
When earnings are up, more shares of stock are sold on the market, which causes the market price of
stock to increase.
DIFFICULTY:
Moderate
KEYWORDS:
Bloom’s: Applying
257. What do profitability ratios measure? Explain.
ANSWER:
Profitability ratios measure how profitable the company is. Every return ratio is a measure of the
relationship between the income earned and the investment made in the company by investors, and long-
and short-term creditors.
DIFFICULTY:
Easy
KEYWORDS:
Bloom’s: Applying
258. Ranier Parts Company has a return on assets of 12% and a return on common stockholders’ equity of 15%. What
causes the difference in the two returns?
ANSWER:
The return on assets considers the investment by creditors and all stockholders. The return on common
stockholders’ equity provides a return on the investment by common stockholders only. Because most
companies have total assets that exceed common stockholders’ equity, the return on assets will be lower.
DIFFICULTY:
Moderate
KEYWORDS:
Bloom’s: Applying
259. Discuss the common reporting characteristics of discontinued operations and extraordinary items in the financial
statements.
ANSWER:
Some companies report either or both discontinued operations and extraordinary items on their income
statements. Although the nature of these two items is very distinct, the two do share some common
characteristics. First, they are all reported near the end of the income statement, after income from
continuing operations. Second, they are reported separately on the income statement to call the reader’s
attention to their unique nature and to the fact that any additions to or deductions from income they give
rise to may not necessarily reoccur in future periods. Finally, each of these items is shown net of their tax
effects. This means that any additional taxes due because of them or any tax benefits from them are
deducted from the items themselves.
DIFFICULTY:
Moderate

260. What would be at least three reasons for a decrease in inventory turnover? Explain.
ANSWER:
One possible explanation for a decrease in inventory turnover is slow-moving items. Caution must be
used, however, because a low inventory turnover may simply be a seasonal phenomenon. For example,
the ratio for the third quarter of the year should be compared with that of the third quarter of the prior
year. Problems in the sales department may also partially explain a low turnover of inventory. Or, the
company may be pricing itself out of the market and need to consider lowering its prices to meet the
competition.
DIFFICULTY:
Easy
KEYWORDS:
Bloom’s: Applying