Chapter 13: Financial Statement Analysis
211. The following analysis is based on information obtained from 2016 financial statements of Pacific Company, River
Corporation, and Ocean Company.
(In Millions)
Pacific
River
Ocean
Accounts receivable turnover ratio
10.7
18.9
12.1
Inventory turnover ratio
9.1
18.4
6.4
A)
Compute the cash to cash operating cycle for each company for 2016.
B)
What does this ratio measure? Which company has the better cash to cash operating cycle?
ANSWER:
A)
Number of days’ sales in inventory:
Pacific
360/9.1 = 39.6 days
River
360/18.4 = 19.6 days
Ocean
360/6.4 = 56.3 days
Number of days’ sales in receivables:
Pacific
360/10.7 = 33.6 days
River
360/18.9 = 19.0 days
Ocean
360/12.1 = 29.8 days
Cash to cash operating cycle:
Pacific
39.6 + 33.6 = 73.2 days
River
19.6 + 19.0 = 38.6 days
Ocean
56.3 + 29.8 = 86.1 days
B)
This ratio measures the average length of time between the purchase of inventory
and the collection of cash from the sale of merchandise. This is 73.2 days for Pacific,
38.6 days for River, and 86.1 days for Ocean. River has the shortest operating cycle
at 38.6. The length of the operating cycle is dependent upon the industry, but
generally a short cycle is better for cash management of a company.
DIFFICULTY:
Moderate
LEARNING OBJECTIVES:
FACC.PONO.13.13-04 – LO: 13-04
KEYWORDS:
Bloom’s: Analyzing
212. Given below are three ratios calculated for Lantana, Tera, and Bake Companies for 2017 and 2016.
(In millions)
Lantana
Tera
Bake
Current ratio
December 31, 2017
2.8 to 1
3.3 to 1
1.8 to 1
December 31, 2016
2.8 to 1
2.5 to 1
3.2 to 1
Inventory turnover ratio
December 31, 2017
6.8 times
5.4 times
6.0 times
December 31, 2016
7.6 times
5.5 times
12.6 times
Acid-test ratio
December 31, 2017
1.5 to 1
2.1 to 1
.54 to 1
December 31, 2016
1.3 to 1
2.0 to 1
1.2 to 1
A)
Which company has the best inventory management? Explain.
B)
Which company has the best short-term financial health? Explain.
ANSWER:
A)
Lantana Company has the best inventory management. Compared to the other
companies, Lantana sells the entire dollar amount of its inventory about 7 times per year.
Tera is stable at about 5 times per year. Bake Co. experienced a large decline from 12.6
times to 6 times from 2016 to 2017. Although Lantana experienced a decline, it was
more moderate.
B)
The acid-test ratio is the best indicator of short-term financial health. Tera has the
highest quick ratio, which indicates a better ability to stay afloat in the very short-term.
DIFFICULTY:
Moderate
LEARNING OBJECTIVES:
FACC.PONO.13.13-04 – LO: 13-04
KEYWORDS:
Bloom’s: Analyzing
213. Given below are three ratios calculated for Hall, Link, and Dollar Companies for 2017 and 2016.
(In millions)
Hall
Link
Dollar
Current ratio
Dec 31, 2017
2.8 to 1
2.3 to 1
1.8 to 1
Dec 31, 2016
2.0 to 1
1.5 to 1
2.2 to 1
Inventory turnover ratio
Dec 31, 2017
6.9 times
5.8 times
8.0 times
Dec 31, 2016
7.6 times
5.8 times
9.6 times
Acid-test ratio
Dec 31, 2017
2.5 to 1
2.1 to 1
0.5 to 1
Dec 31, 2016
1.0 to 1
1.4 to 1
1.2 to 1
A)
Which company has the greatest percentage of inventory and prepaids? How can you tell?
B)
Which company appears to be heading in the wrong direction concerning its ability to pay its
bills in a very short-run situation? Explain.
C)
Which company appears to be the most liquid? Explain.
ANSWER:
A)
The difference between the current ratio and the acid-test ratio is the inclusion of
inventory and prepaids in the numerator of the current ratio. Dollar has the largest
difference between the two ratios, which is caused by inventory and prepaids being
large.
B)
Dollar appears headed in the wrong direction concerning liquidity. Dollar’s acid-test
and current ratios both declined significantly, while Link’s improved. Hall Company
had a nice increase in its current ratio, but an even more improved acid-test ratio.
C)
Hall appears to be the most liquid of the three companies. Hall’s current ratio is the
highest, its acid-test ratio is the highest, and its inventory turnover ratio is in good
condition, except for a slight drop during 2017.
DIFFICULTY:
Moderate
LEARNING OBJECTIVES:
FACC.PONO.13.13-04 – LO: 13-04
KEYWORDS:
Bloom’s: Analyzing
214. The following information is summarized from the balance sheets of Gear Mart Corporation and Function Junction,
Inc. at December 31, 2016:
Gear Mart
Function Junction
Current Assets:
Cash and cash equivalents
$ 340,800
$100,200
Short-term investments
12,000
7,600
Accounts receivable, net
377,000
42,000
Notes receivable, net
36,300
18,000
Other current assets
207,400
40,000
Total current assets
$ 973,500
$207,800
Current liabilities
$ 860,900
$150,000
Other liabilities
5,000,400
300,500
Stockholders’ equity
2,400,300
800,700
1)
Using the information provided above, compute the following for each company at
December 31, 2017:
A. Working capital
B. Current ratio
C. Acid-test ratio
2)
Comment briefly on the liquidity of each of these two companies. Which company
appears to be the most liquid?
ANSWER:
1)
Gear Mart
Function Junction
A.
Current assets –
= $973,500 – $860,900
= $207,800 – $150,000
Current liabilities
= $112,600
= $57,800
B.
Current assets
$973,500
$207,800
Current liabilities
$860,900
$150,000
= 1.13 to 1
= 1.39 to 1
$377,000 + $36,300
C.
Current liabilities
$860,900
= 0.89 to 1
= 1.12 to 1
215. Given below is information for Short Corporation and Long Computers, Inc. at the end of 2016.
(In millions)
Short
Long
Cash and cash equivalents
$ 1,100
$ 300
Short-term investments/marketable securities
100
900
Accounts, notes, and other receivables, net
11,700
12,400
Inventories
1,200
1,000
Prepaid expenses
1,400
600
Total current assets
$15,500
$15,200
Current liabilities
$ 5,000
$ 4,000
Other liabilities
$ 2,300
$12,000
Stockholders’ equity
$ 5,300
$ 7,300
1)
Using the information provided above, compute the following for each company at
December 31, 2017:
A. Current ratio
B. Acid-test ratio
2)
Comment briefly on the liquidity of each of these two companies. Which appears to
be more liquid?
3)
What other ratios would help you to more fully assess the liquidity of these
companies?
ANSWER:
1)
A.
Short
$15,500/$5,000 = 3.1 to 1
Long
$15,200/$4,000 = 3.8 to 1
B.
Short
($1,100 + $100 + $11,700)/$5,000 = 2.6 to 1
Long
($300 + $900 + $12,400)/$4,000 = 3.4 to 1
2)
Long has the higher current ratio and a significantly higher acid-test ratio. Long also
has almost four times as much current assets as current liabilities.
3)
Other ratios that help assess cash flow are: cash flows from operations to current
liabilities ratio, accounts receivable turnover ratio, and the inventory turnover ratio.
DIFFICULTY:
Moderate
LEARNING OBJECTIVES:
FACC.PONO.13.13-04 – LO: 13-04
KEYWORDS:
Bloom’s: Analyzing
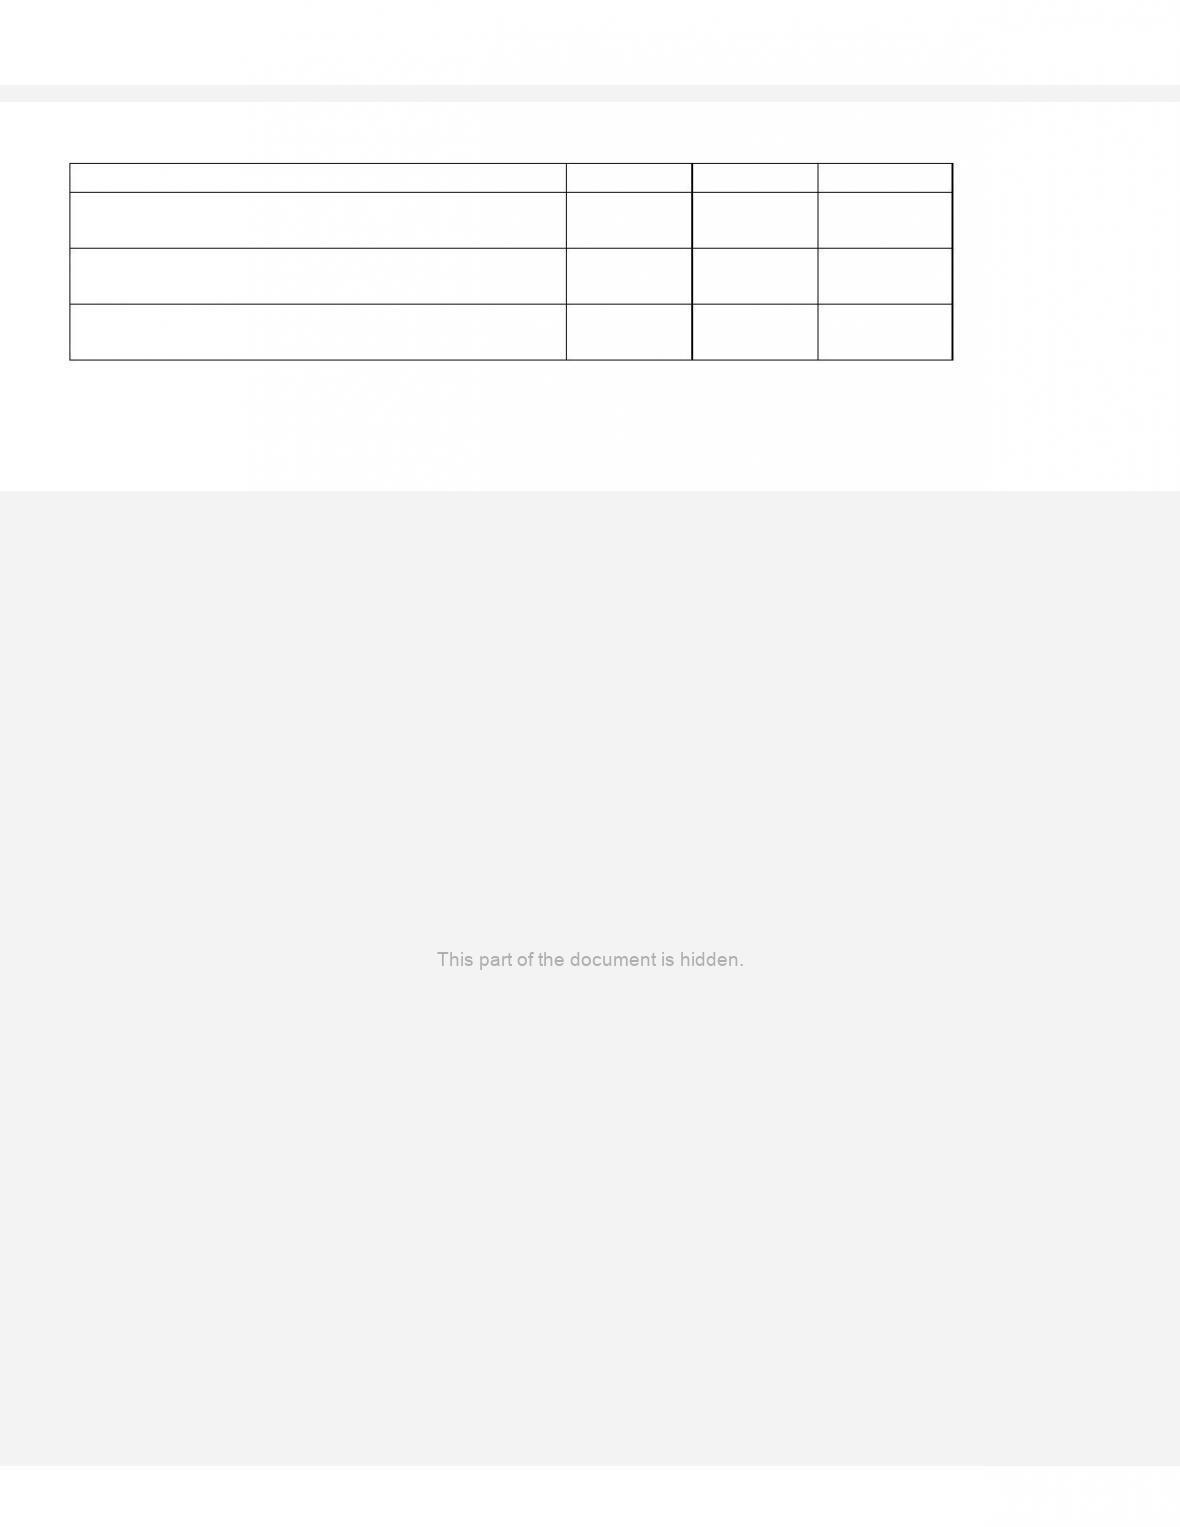
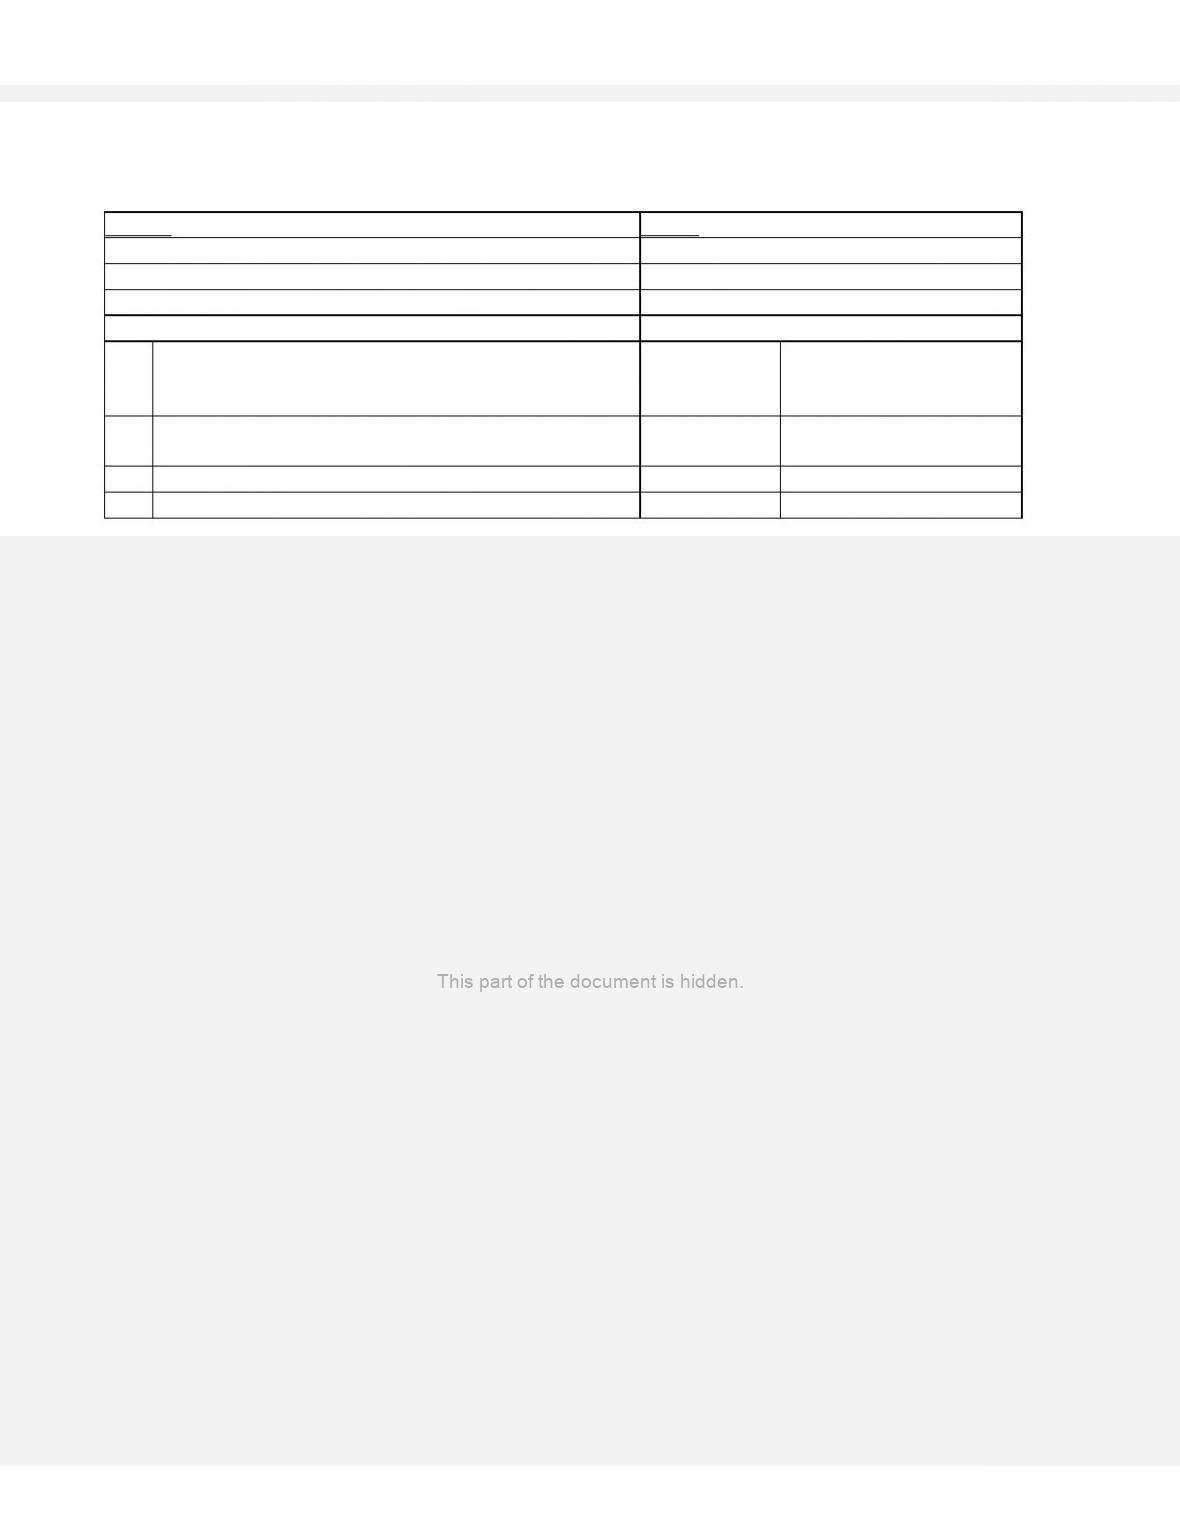
216. Assume that the current ratio is 2:1 for the company in question. Show the effect of each of the transactions below on
total assets and the current ratio by using one of the following symbols in each box to complete the table. If the numerator
and denominator of a ratio both increase or both decrease by the same amount, the effect of the event on the ratio is
“insufficient data.”
Symbol
Action
+
Increase
–
Decrease
N
No effect
O
Insufficient data
Transactions
Effect on
Total Assets
Effect on
Current Ratio
1
Cash received from customers for accounts
receivable balances owed.
2
Cash sale of long-term asset at more than the
asset’s original cost.
3
Declaration and payment of cash dividend.
4
Payment of interest expense.
5
Purchase of long-term asset for cash.
6
Purchase of office supplies for cash.
ANSWER:
Transactions
Effect on
Total Assets
Effect on
Current Ratio
1
Cash received from customers for
accounts receivable balances owed.
N
N
2
Cash sale of long-term asset at more than
the asset’s original cost.
+
+
3
Declaration and payment of cash
dividend.
–
–
4
Payment of interest expense.
–
–
5
Purchase of long-term asset for cash.
N
–
6
Purchase of office supplies for cash.
N
N
DIFFICULTY:
Moderate
LEARNING OBJECTIVES:
FACC.PONO.13.13-04 – LO: 13-04
KEYWORDS:
Bloom’s: Analyzing
217. The following account balances are taken from the records of the Odessa Industries:
December 31
2018
2017
2016
Accounts receivable
$180,000
$120,000
$90,000
Net credit sales
$900,000
$840,000
Odessa extends credit terms requiring full payment in 45 days, with no discount for early payment.
Required:
1. Compute Odessa’s accounts receivable turnover ratio for 2018 and 2017.
2. Compute the number of days’ sales in receivables for 2018 and 2017. Assume 360 days in a year.
3. Comment on the efficiency of Odessa’s collection efforts over the two-year period.
ANSWER:
1. Accounts receivable turnover:
Net credit sales/Average accounts receivable:
2018: $900,000/[($180,000 + $120,000)/2] = $900,000/$150,000 = 6.0 times
2017: $840,000/[($120,000 + $90,000)/2] = $840,000/$105,000 = 8.0 times
2. Number of days’ sales in receivables:
2018: 360/6 = 60 days
2017: 360/8 = 45 days
3. The average age of a receivable in 2017 was the same number of days as the maximum
credit period of 45 days. The average age in 2018 of 60 days, however, is significantly in
excess of the credit period. The company needs to investigate this increase and decide
whether efforts are needed to speed up the collection process. The company may decide that
allowing customers more liberal payment terms has had a positive effect on sales, as
evidenced by the increase in sales, and not want to press its customers for earlier payment.
Conversely, the company may find that allowing an extra 15 days for payment causes cash
flow problems.
DIFFICULTY:
Moderate
LEARNING OBJECTIVES:
FACC.PONO.13.13-04 – LO: 13-04
KEYWORDS:
Bloom’s: Analyzing

Chapter 13: Financial Statement Analysis
Culinary Delights Company
Use the financial statements for Culinary Delights Company to answer the questions that follow.
Consolidated Statement of Earnings and Retained Earning
Year ended December 31,
2018
2017
2016
In thousands of dollars except for per share amounts
Earnings
Revenues:
Net sales
$2,004,719
$1,937,021
$1,835,987
Investment and other income
18,636
17,153
14,614
Total revenues
$2,023,355
$1,954,174
$1,850,601
Costs and expenses:
Cost of goods sold
$ 848,363
$ 847,366
$ 814,483
Costs (gain) related to factory closure and sale
(10,404)
3,300
10,436
Selling, distribution and general administrative
743,902
708,310
656,473
Interest
615
958
1,097
Total cost and expenses
$1,582,476
$1,559,934
$1,482,489
Earnings before income taxes
$ 440,879
$ 394,240
$ 368,112
Income taxes
136,378
122,614
128,840
Net earnings
$ 304,501
$ 271,626
$ 239,272
Retained Earnings
Retained earnings at beginning of year
$1,032,139
$ 898,512
$ 497,481
Dividends declared
(per share: 2017—$1.31; 2016—$1.19)
(152,023)
(137,999)
(87,301)
Retained earnings at end of year
$1,184,617
$1,032,139
$ 649,452
Per Share Amounts
Net earnings per average share of common stock
$2.63
$2.34
$1.99
Dividends paid per share of common stock
$1.30
$1.17
$1.02
Consolidated Balance Sheets
at December 31
2017
2018
ASSETS
In thousands of dollars
Current assets:
Cash and cash equivalents
$ 214,572
$ 206,627
Short-term investments, at amortized cost
137,112
120,728
Accounts receivable, net
194,877
175,967
Inventory
256,108
247,392
Other prepaid assets
25,376
30,538
Deferred income taxes—current
15,027
16,421
Total current assets
$ 843,072
$ 797,673
Chapter 13: Financial Statement Analysis
Marketable equity securities, at fair value
39,888
26,375
Deferred charges and other assets
92,183
59,566
Deferred income taxes—noncurrent
25,522
29,038
Property, plant, and equipment, at cost:
Land
$ 36,013
$ 26,298
Buildings and building equipment
310,212
277,808
Machinery and equipment
642,556
566,766
$ 988,781
$ 870,872
Less accumulated depreciation
468,691
440,398
$ 520,090
$ 430,474
Total assets
$1,520,755
$1,343,126
LIABILITIES AND STOCKHOLDERS’ EQUITY
2017
2016
Current liabilities:
Accounts payable
$ 76,691
$ 71,001
Accrued expenses
67,848
78,378
Dividends payable
23,222
22,034
Income and other taxes payable
49,491
53,460
Deferred income taxes—current
1,374
943
Total current liabilities
$ 218,626
$ 225,816
Deferred income taxes—noncurrent
$ 40,312
$ 30,874
Other noncurrent liabilities
104,885
101,057
Stockholders’ equity:
Preferred stock—no par, Auth. 20,000 shares;
Issued 0
Common stock—no par, Auth. 400,000
shares; Issued 2017: 93,007; 2016: 92,545
$ 12,401
$ 2,339
Class B common—conv. Auth. 80,000 shares;
Issued 2017: 23,214; 2016: 23,676
3,095
3,157
Additional paid-in capital
272
226
Retained earnings
1,184,617
1,032,139
Foreign currency translation adjustment
(61,339)
(65,034)
Unrealized holding gains on marketable equity
securities
24,698
25,915
Common stock in treasury, at cost
(2017: 111 shares; 2016: 252 shares)
(6,712)
(13,363)
Total stockholders’ equity
$1,157,032
$ 985,379
Total liabilities and stockholders’ equity
$1,520,855
$1,343,126
218. Refer to the financial statements from Culinary Delights Company.
Required:
(A) Calculate the company’s current and acid-test ratios for 2017. Would you lend this company $4,000,000 at 10% over a
one-year period? Explain. (Note: The statements provided are in “thousands.”)
(B) Suppose the company has credit terms of 20 days and all sales are on credit. During 2017, what credit management
problems does this company have, if any? Explain
ANSWER:
(A) Current ratio: Current assets/Current liabilities = $843,072/$218,626 = 3.86 to 1
Acid-test ratio: Quick assets/Current liabilities = ($843,072 – $256,108 – $25,376 –
$15,027)/$218,626 = 2.5 to 1
The company has very strong liquidity ratios. These are indicators of the company’s ability to
pay its current debt when it is due. The money should be loaned to Culinary Delights
Company.
(B) Culinary Delights’ customers pay in approximately 33 days. This is 13 days more than
the company’s credit policy. Management should work on collections to reduce the collection
period. The company may also want to evaluate the customers to which it gives credit.
RATIONALE:
Calculation for Part B: Net sales / Average Accounts Receivable = Accounts receivable
turnover; $2,004,719/ [(194,877 + 175,967) ÷ 2] = $2,004,719 / $185,422 = 10.8 360 days /
Accounts Receivable Turnover = No. of Days Sales in Receivables; 360 / 10.8 =33 days sales
in receivables
DIFFICULTY:
Moderate
LEARNING OBJECTIVES:
FACC.PONO.13.13-04 – LO: 13-04
KEYWORDS:
Bloom’s: Analyzing
219. Refer to the financial statements of Culinary Delights Company.
Required:
(A) Culinary Delights’ cash flow from operations for 2017 is $323,847 (in thousands). Evaluate Culinary Delights’ short-
term cash flow position during 2017. Is the company in danger of problems? Explain.
(B) Evaluate Culinary Delights’ inventory management during 2017.
ANSWER:
(A) 2017: Net cash flows from operating activities/Average current liabilities = $323,847 /
[($218,626 + $225,816) / 2] = 145.7%
This ratio indicates that Culinary Delights’ has cash flows generated from operations that are
145.7% of the current liabilities due. This is a healthy indicator of the company’s ability to
generate cash to pay its current debt.
(B) 2017 – Inventory turnover ratio = Cost of goods sold/Average inventory = $848,363 /
[($256,108 + $247,392) / 2] = 3.37 times
DIFFICULTY:
Moderate
KEYWORDS:
Bloom’s: Analyzing
220. Refer to the financial statements of Culinary Delights Company.
Required:
(A) Calculate Culinary Delights’ return on sales ratio for 2017 and 2016. Assume that the income tax rate is 30%. What
information is provided with this ratio?
(B) Calculate the return on common stockholders’ equity ratio for 2017 and 2016. Stockholders’ equity at December 31,
2015, was $897,431 (in thousands). Why is the denominator an average instead of a single amount?
ANSWER:
(A) (Net income + Interest expense, net of tax)/Net sales =
2017: ($304,501 + $615 – (.3 × $615))/$2,004,719 = 15.2%
2016: ($271,626 + $958 – (.3 × $958))/$1,937,021 = 14.1%
This is a broad consideration of the earnings made by the company for all shareholders, not
only the common stockholders. This company earned 15.2% of every sales dollar during
2015, up 1.1% from 2017.
(B) (Net income – preferred dividends)/Average common stockholders’ equity =
2017: ($304,501 – $0)/[($1,157,032 + $985,379)/2] = 28.4%
2016: ($271,626 – $0)/[($985,379 + $897,431)/2] = 28.9%
Since net income covers an entire year, the denominator is adjusted to be the average over the
entire year.
DIFFICULTY:
Moderate
LEARNING OBJECTIVES:
FACC.PONO.13.13-06 – LO: 13-06
KEYWORDS:
Bloom’s: Analyzing
221. The following account balances are taken from the records of Clarke Inc., a wholesaler:
December 31
2018
2017
2016
Merchandise inventory
$ 240,000
$ 180,000
$150,000
Cost of goods sold
6,400,000
9,600,000
Required:
1. Compute Clarke’s inventory turnover ratio for 2018 and 2017.
2. Compute the number of days’ sales in inventory for 2018 and 2017. Assume 360 days in a year.
3. Comment on your answers in (1) and (2) relative to the company’s management of inventory over the two years. What
problems do you see in its inventory management?
ANSWER:
1. Inventory turnover:
Cost of goods sold/Average inventory:
2018: $6,400,000/[($240,000 + $180,000)/2] = $6,400,000/$210,000 = 30.48 times
2017: $9,600,000/[($180,000 + $150,000)/2] = $9,600,000/$165,000 = 58.18 times
2. Number of days’ sales in inventory:
2018: 360/30.48 = 11.8 days
2017: 360/58.18 = 6.2 days
3. Inventory turnover has declined dramatically from the prior year. Many different
explanations are possible for this decline, such as problems in the sales effort, over-pricing of
the products relative to the competition, or inferior produce. Management needs to
investigate the problem and decide who should be held responsible for the slow movement.
The company may find that no one department or individual is totally responsible and that
many different parts of the business need to work together to improve the turnover of
inventory.
DIFFICULTY:
Moderate
LEARNING OBJECTIVES:
FACC.PONO.13.13-04 – LO: 13-04
KEYWORDS:
Bloom’s: Analyzing
222. The following information was obtained from the 2017 and 2016 financial statements
Better Books and Tenacious Texts. Assume all sales are on credit for both companies.
(in millions)
Better Books
Tenacious Texts
Accounts and notes receivable, net
12/31/17
$ 3,100
$ 4,800
12/31/16
3,320
4,500
Inventories
12/31/17
2,080
2,530
12/31/16
2,250
2,320
Net revenue
2017
32,010
44,050
2016
28,900
39,500
Cost of goods sold
2017
11,370
20,350
2016
10,400
18,000
Required:
1. Using the information provided, compute the following for each company for 2017 (rounded to two decimals):
a. Accounts receivable turnover ratio
b. Number of days’ sales in receivables
c. Inventory turnover ratio
d. Number of days’ sales in inventory
e. Cash-to-cash operating cycle
2. Comment briefly on the liquidity of each of these two companies.
ANSWER:
1. Calculations (all dollar amounts in millions):
a. Accounts receivable turnover ratio:
Better Books
223. The following information was summarized from the balance sheets of the Better Books and Tenacious Texts at
December 31, 2016:
(in millions)
Better Books
Tenacious Texts
Cash and cash equivalents
$ 5,800
$ 3,150
Short-term investments/marketable securities
280
210
Accounts and notes receivables, net*
3,100
4,700
Inventories
2,200
2,500
Prepaid expenses and other current assets
1,920
1,320
Total current assets
$13,300
$11,880
Current liabilities
$13,900
$ 9,800
Required:
1. Using the information provided, compute the following for each company at the end of 2016:
a. Current ratio
b. Quick ratio
2. Better Books reported cash flow from operations of $7,500 million during 2016. Tenacious Texts reported cash flow
from operations of $7,000 million. Current liabilities reported by Better Books and Tenacious Texts at December 31,
2015, were $13,200 million and $7,700 million, respectively. Compute the cash flow from operations to current liabilities
ratio for each company for 2016.
3. Comment briefly on the liquidity of each of these two companies. Which appears to be more liquid?
4. What other ratios would help you more fully assess the liquidity of these companies?
ANSWER:
1. Calculations (all dollar amounts in millions):
Better Books
Tenacious Texts
a. Current ratio $13,300/$13,900 = 0.96 to 1
Current ratio $11,880/$9,800 = 1.21 to 1
b. Quick assets $5,800 + $280 + $3,100 =
$9,180
Quick assets $3,150 + $210 + $4,700 =
$8,060
Acid-test or Quick ratio $9,180/$13,900 =
0.66 to 1
Acid-test or Quick ratio $8,060/$9,800 = 0.82
to 1
Moderate
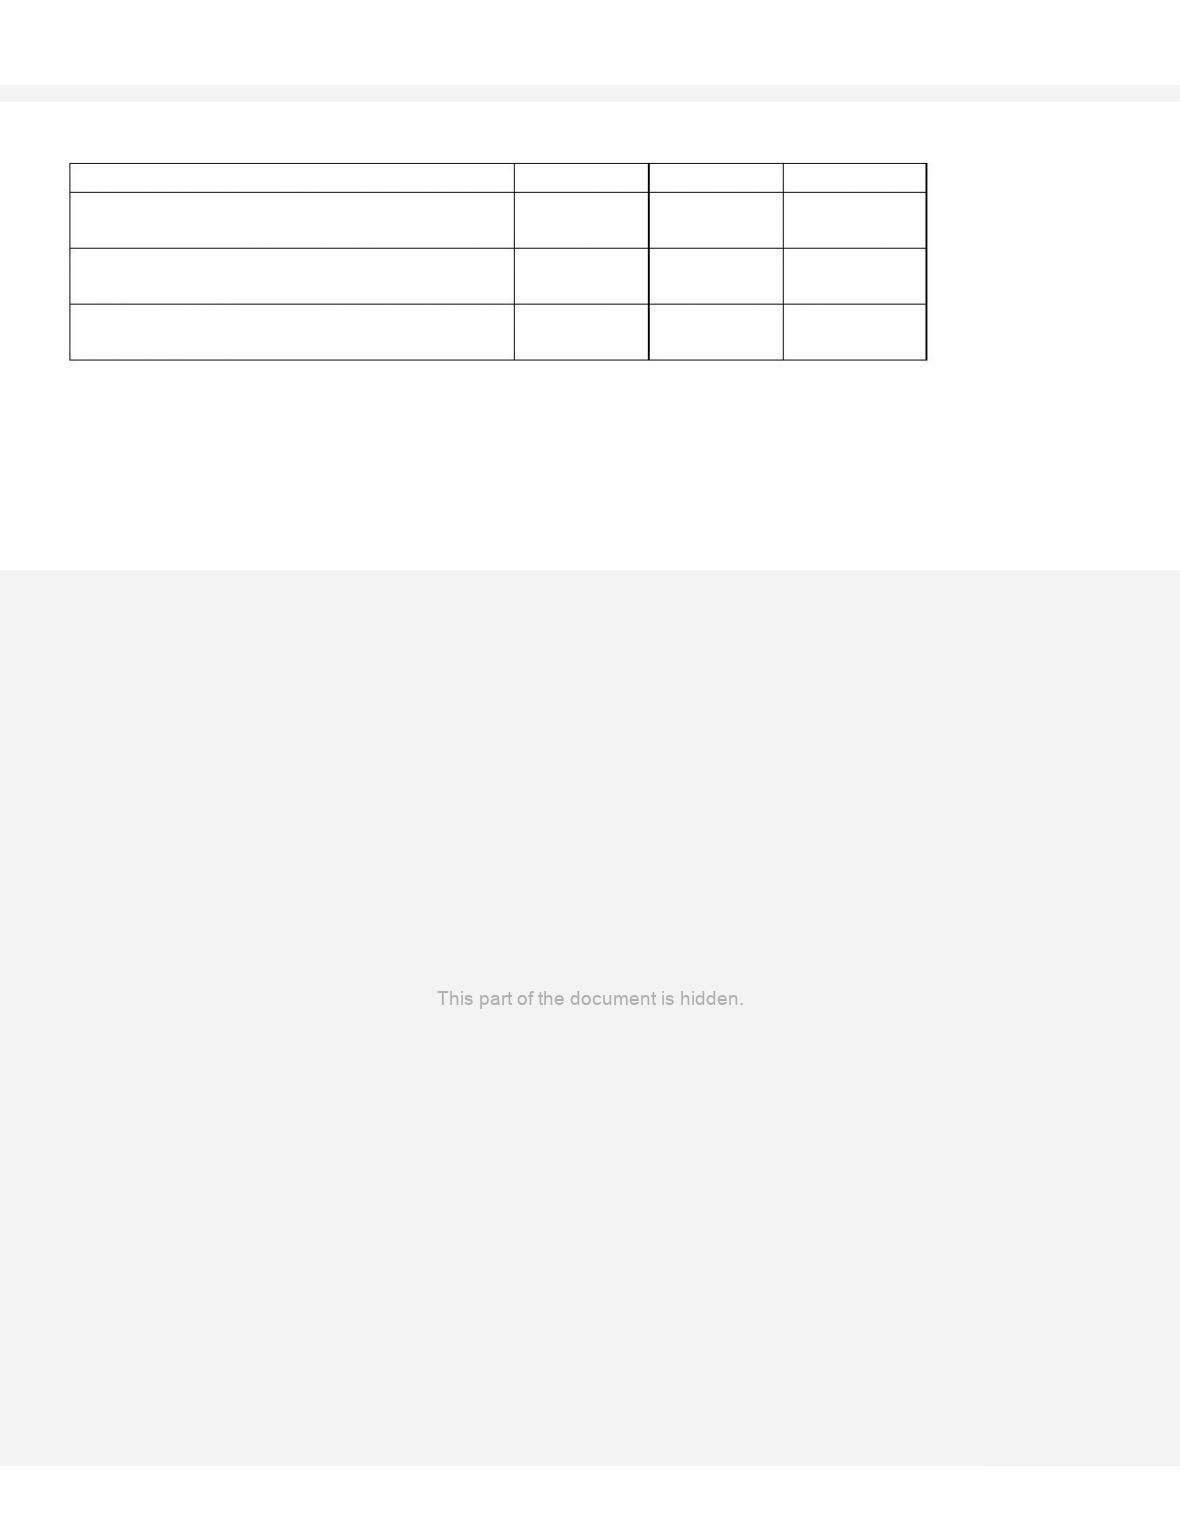
224. Show the effect of each of the transactions below on total liabilities and the debt-to–equity ratio by using one of the
following symbols in each box to complete the table. If the numerator and denominator of a ratio both increase or both
decrease by the same amount, the effect of the event on the ratio is “insufficient data.”
Symbol
Action
+
Increase
–
Decrease
N
No effect
O
Insufficient data
Transactions
Effect on
Total
Liabilities
Effect on
Debt-to-Equity
Ratio
1
Cash received from customers for accounts receivable
balances owed.
2
Declaration and payment of cash dividend.
3
Purchase of long-term asset for cash.
ANSWER:
Transactions
Effect on
Total
Liabilities
Effect on
Debt-to-Equity
Ratio
1
Cash received from customers for
accounts receivable balances owed.
N
N
2
Declaration and payment of cash
dividend.
N
+
3
Purchase of long-term asset for cash.
N
N
DIFFICULTY:
Moderate
LEARNING OBJECTIVES:
FACC.PONO.13.13-05 – LO: 13-05
KEYWORDS:
Bloom’s: Analyzing
225. The following information was obtained from the comparative financial statements included in Arco Inc.’s 2017
annual report. (All amounts are in millions of dollars.)
12/31/17
12/31/16
Total liabilities
$95,050
$90,960
Total stockholders’ equity
13,460
27,470
For the Years Ended
12/31/17
12/31/16
Interest expense
$ 730
$ 600
Provision for income taxes
4,300
4,070
Net income
14,000
10,400
Net cash provided by operating activities
from continuing operations
18,700
16,000
Cash dividends paid
2,450
2,010
Payments for plant, rental machines and other property
4,010
4,630
Payments to settle debt
10,000
11,530
Required:
1. Using the information provided, compute the following for 2017 and 2016:
a. Debt-to-equity ratio (at each year-end)
b. Times interest earned ratio
c. Debt service coverage ratio
d. Cash flow from operations to capital expenditures ratio
2. Comment briefly on the company’s solvency.
ANSWER:
1. Calculations (all dollar amounts are in millions):
2017
2016
a. Debt-to-equity ratio
$95,050/$13,460 = 7.06
to 1
$90,960/$27,470 = 3.31
to 1
b.Times interest earned
$19,030/$730 = 26.07
to 1
$15,070/$600 = 25.12
to 1
c. Debt service coverage
ratio*
$23,730/$10,730 = 2.21
times
$20,670/$12,130 = 1.70
times
d. Cash flow from
operations to capital
$16,250/$4,010 =
$13,990/$4,630 =
($18,700 –
$2,450)/$4,010 =
405.24%
($16,000 –
$2,010)/$4,630 =
302.16%
*The amounts for interest and taxes represent interest expense and income tax expense rather
than the amounts paid.
2. Arco’s debt-to–equity ratio increased during 2017, due to both an increase in the amount of
debt outstanding at the end of 2017 and a decrease in stockholders’ equity. The other three
ratios for the two years all indicate that the company is highly solvent.
DIFFICULTY:
Moderate
LEARNING OBJECTIVES:
FACC.PONO.13.13-05 – LO: 13-05
KEYWORDS:
Bloom’s: Analyzing
226. Kim Chen Corporation is a wholesaler of scuba gear. During 2017, Chen expanded its retail business by adding over
50 dive shops. The following information is obtained from the comparative financial statements included in the company’s
2017 annual report (all amounts are in thousands of dollars):
Dec. 31, 2017
Dec. 31, 2016
Total liabilities
$26,000
$18,000
Total stockholders’ equity
34,000
38,000
FOR THE FISCAL YEARS ENDED
Dec. 31, 2017
Dec. 31, 2016
Depreciation expense
$ 2,000
$ 6,000
Interest expense
3,400
3,200
Income tax expense
12,600
18,100
Net income
6,000
15,000
Net cash provided by (used by) operations
41,000
(400)
Total dividends paid
2,000
12,000
Cash used to purchase plant assets
32,000
18,000
Payments on long-term debt
1,600
1,800
1) Using the information provided above, compute the following for 2017 and 2016:
A. Debt-to-equity ratio (at each year-end)
B. Times interest earned ratio
2) Comment briefly on the company’s solvency.
3) What other ratios will help you assess the solvency? What information will they provide that
you do not already have concerning the company’s solvency?
ANSWER:
1)
A. Total liabilities/Total stockholders’ equity =
2017: $26,000/$34,000 = .76 to 1
2016: $18,000/$38,000 = .47 to 1
B. (Net income + Interest expense + Income tax expense)/Interest expense =
2017: ($6,000 + $3,400 + $12,600)/$3,400 = 6.47 to 1
2016: ($15,000 + $3,200 + $18,100)/$3,200 = 11.34 to 1
2)
Both the debt-to–equity ratio and the times interest earned ratio are indicators of
solvency. The debt-to-equity ratio indicates the company’s ability to pay liabilities,
which is about 76 cents of every dollar of net worth for 2017. The times interest earned
expense incurred. The times interest earned ratio has declined substantially from 2016
to 2017.
3)
Moderate
FACC.PONO.13.13-05 – LO: 13-05
The debt service coverage ratio is an indicator of the company’s ability to pay both
principal and interest. For this reason, it is a better indicator of overall solvency. The
cash flow from operation to capital expenditures ratio is helpful in that it indicates the