1
Corporate Finance, 4e (Berk / DeMarzo)
Chapter 11 Optimal Portfolio Choice and the Capital Asset Pricing Model
11.1 The Expected Return of a Portfolio
1) Which of the following statements is FALSE?
A) Without trading, the portfolio weights will decrease for the stocks in the portfolio whose returns are
above the overall portfolio return.
B) The expected return of a portfolio is simply the weighted average of the expected returns of the
investments within the portfolio.
C) Portfolio weights add up to 1 so that they represent the way we have divided our money between
the different individual investments in the portfolio.
D) A portfolio weight is the fraction of the total investment in the portfolio held in an individual
investment in the portfolio.
Use the information for the question(s) below.
Suppose you invest $20,000 by purchasing 200 shares of Abbott Labs (ABT) at $50 per share, 200 shares
of Lowes (LOW) at $30 per share, and 100 shares of Ball Corporation (BLL) at $40 per share.
2
3) The weight on Abbott Labs in your portfolio is:
A) 50%
B) 40%
C) 30%
D) 20%
4) The weight on Lowes in your portfolio is:
A) 40%
B) 20%
C) 50%
D) 30%
5) The weight on Ball Corporation in your portfolio is:
A) 50%
B) 40%
C) 20%
D) 30%
3
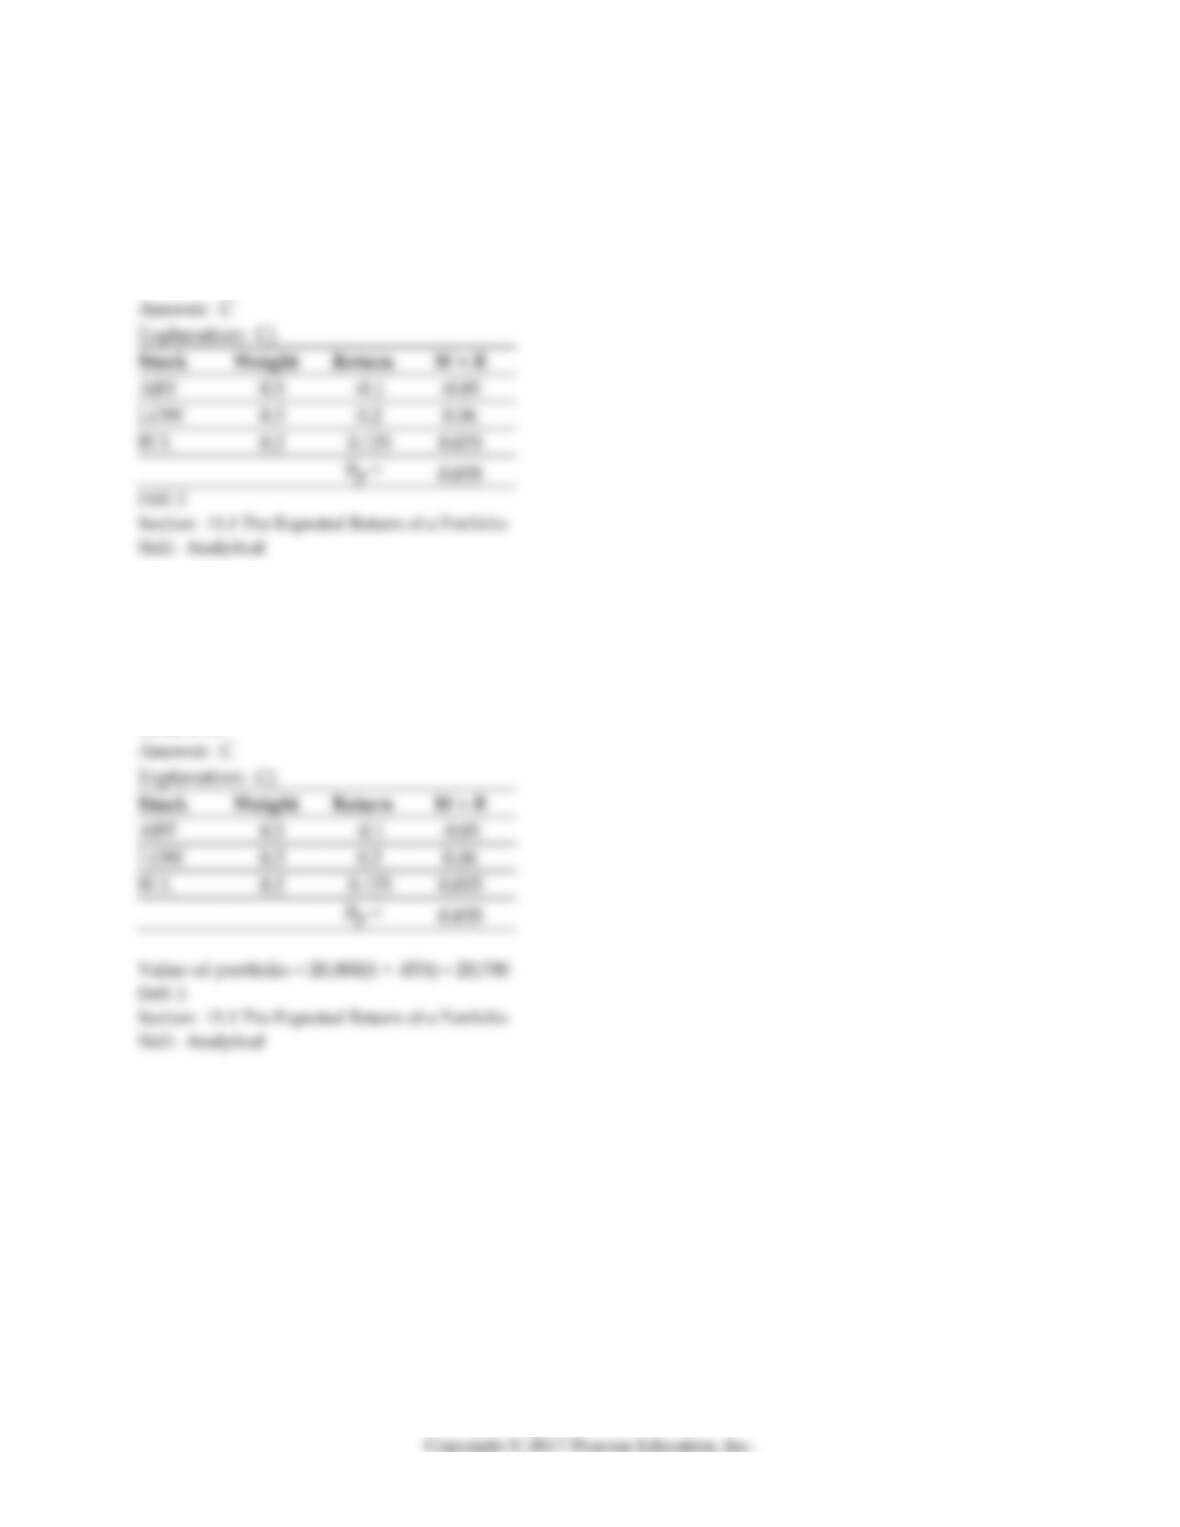
6) Suppose over the next year Ball has a return of 12.5%, Lowes has a return of 20%, and Abbott Labs
has a return of –10%. The return on your portfolio over the year is:
A) 0%
B) 7.5%
C) 3.5%
D) 5.0%
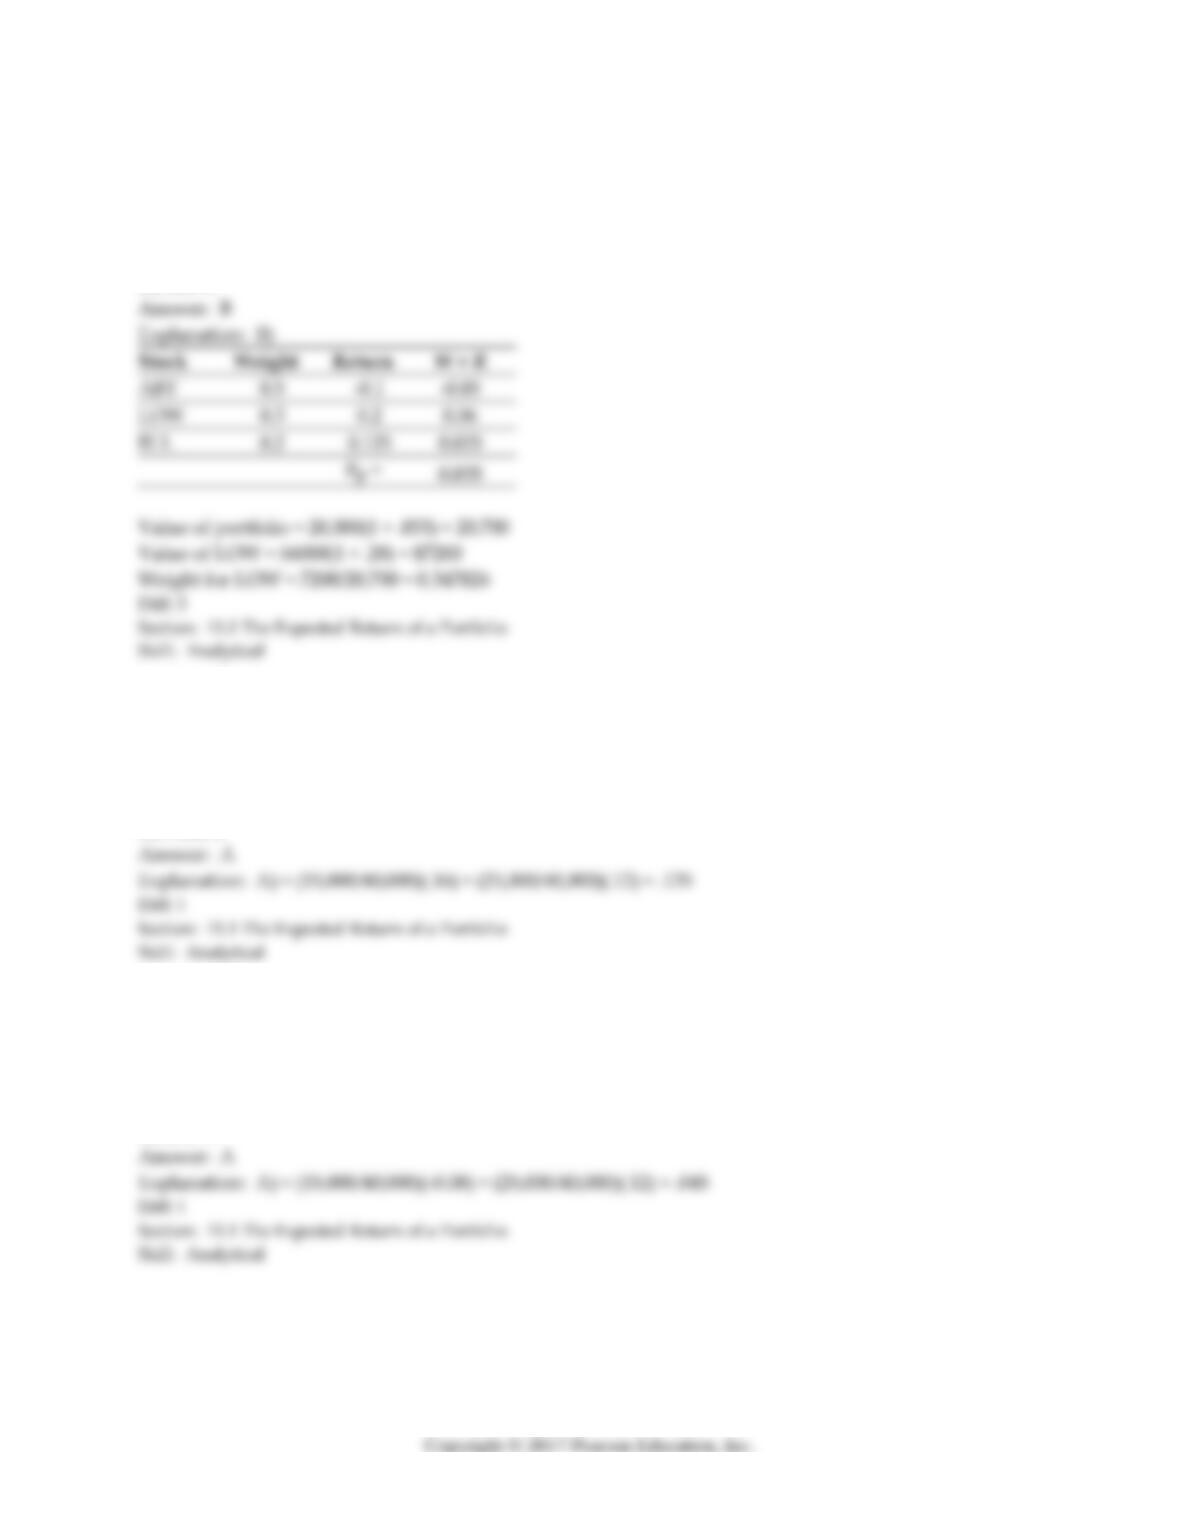
7) Suppose over the next year Ball has a return of 12.5%, Lowes has a return of 20%, and Abbott Labs
has a return of –10%. The value of your portfolio over the year is:
A) $21,000
B) $20,000
C) $20,700
D) $21,500
4
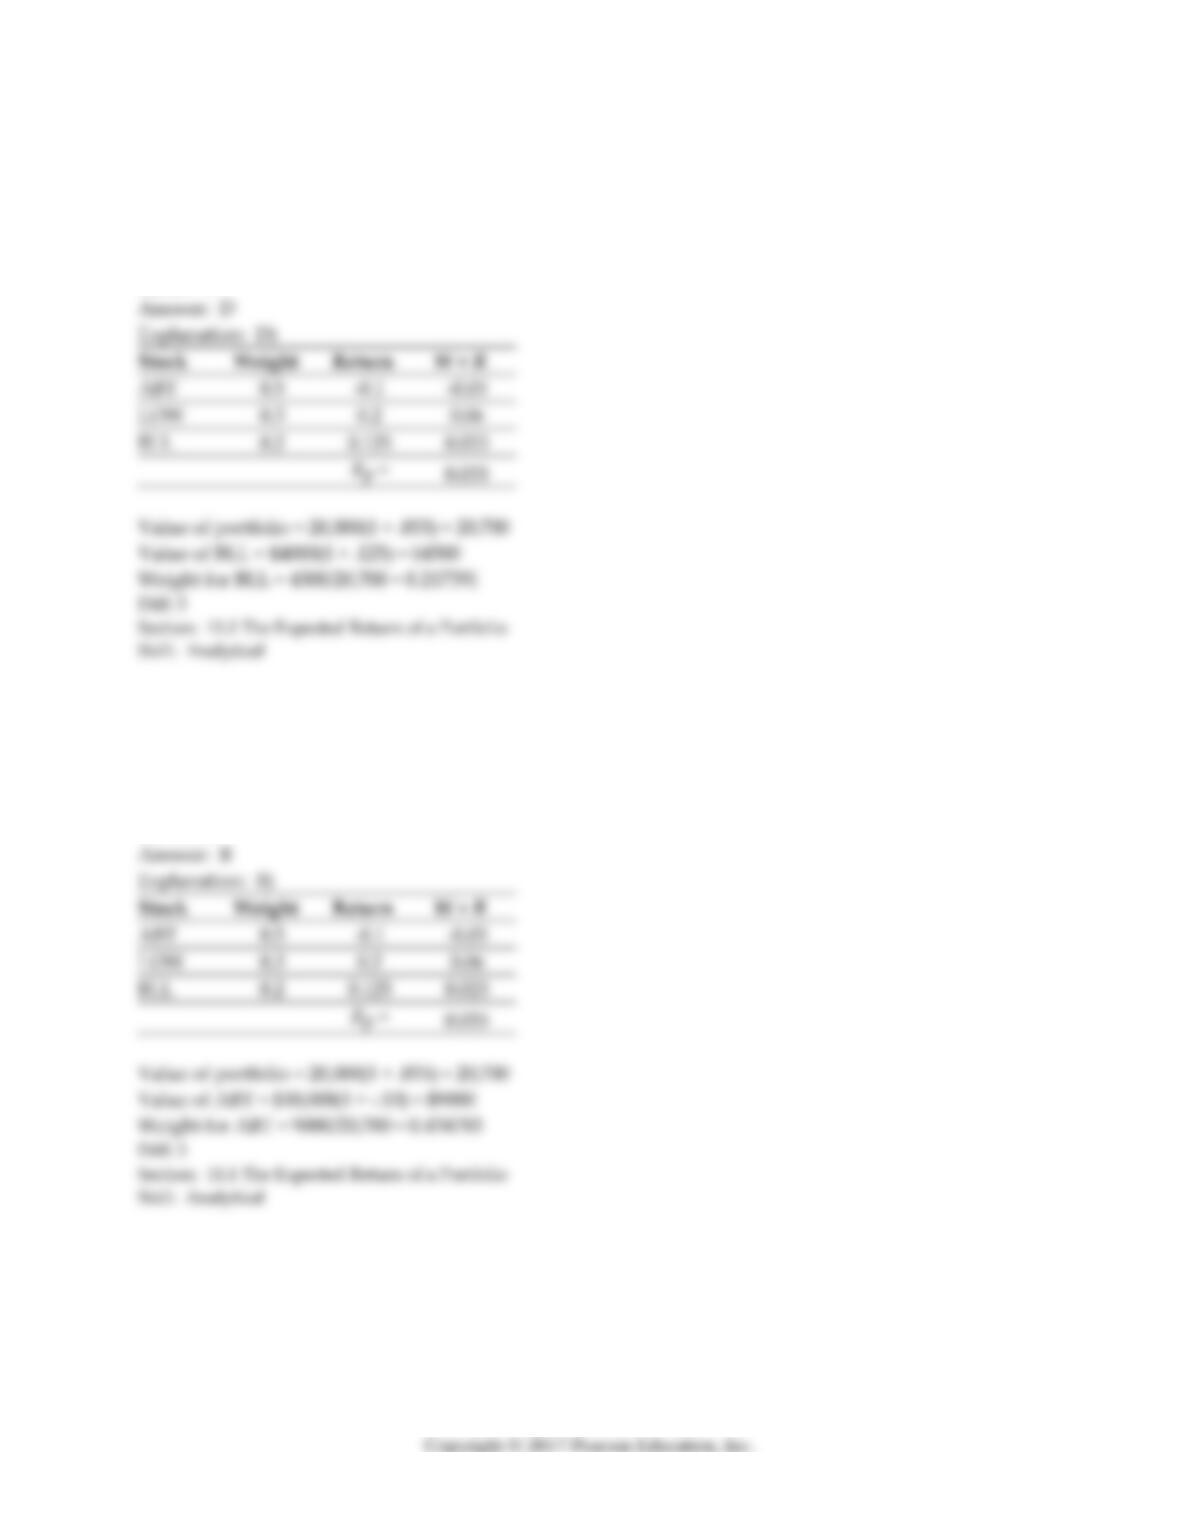
8) Suppose over the next year Ball has a return of 12.5%, Lowes has a return of 20%, and Abbott Labs
has a return of –10%. The weight on Ball Corporation in your portfolio after one year is closest to:
A) 20.0%
B) 12.5%
C) 20.7%
D) 21.7%
9) Suppose over the next year Ball has a return of 12.5%, Lowes has a return of 20%, and Abbott Labs
has a return of –10%. The weight on Abbott Labs in your portfolio after one year is closest to:
A) -10.0%
B) 43.5%
C) 45.0%
D) 50.0%
5
10) Suppose over the next year Ball has a return of 12.5%, Lowes has a return of 20%, and Abbott Labs
has a return of –10%. The weight on Lowes in your portfolio after one year is closest to:
A) 20.0%
B) 34.8%
C) 30.0%
D) 36.0%
11) Suppose you invest $15,000 in Merck stock and $25,000 in Home Depot stock. You expect a return
of 16% for Merck and 12% for Home Depot. What is the expected return on your portfolio?
A) 13.50%
B) 14.00%
C) 13.75%
D) 14.50%
12) Suppose you invest $15,000 in Merck stock and $25,000 in Home Depot stock. You receive an actual
return of -8% for Merck and 12% for Home Depot. What is the actual return on your portfolio?
A) 4.50%
B) 4.00%
C) 10.00%
D) 2.00%
6
11.2 The Volatility of a Two-Stock Portfolio
1) Which of the following statements is FALSE?
A) The covariance and correlation allow us to measure the co-movement of returns.
B) Correlation is the expected product of the deviations of two returns.
C) Because the prices of the stocks do not move identically, some of the risk is averaged out in a
portfolio.
D) The amount of risk that is eliminated in a portfolio depends on the degree to which the stocks face
common risks and their prices move together.
2) Which of the following statements is FALSE?
A) While the sign of the correlation is easy to interpret, its magnitude is not.
B) Independent risks are uncorrelated.
C) When the covariance equals 0, the returns are uncorrelated.
D) To find the risk of a portfolio, we need to know more than the risk and return of the component
stocks; we need to know the degree to which the stocks’ returns move together.
3) Which of the following statements is FALSE?
A) Dividing the covariance by the volatilities ensures that correlation is always between -1 and +1.
B) Volatility is the square root of variance.
C) The closer the correlation is to 0, the more the returns tend to move together as a result of common
risk.
D) If two stocks move together, their returns will tend to be above or below average at the same time,
and the covariance will be positive.
7
4) Which of the following statements is FALSE?
A) Stock returns will tend to move together if they are affected similarly by economic events.
B) Stocks in the same industry tend to have more highly correlated returns than stocks in different
industries.
C) Almost all of the correlations between stocks are negative, illustrating the general tendency of stocks
to move together.
D) With a positive amount invested in each stock, the more the stocks move together and the higher
their covariance or correlation, the more variable the portfolio will be.
5) Which of the following statements is FALSE?
A) A stock’s return is perfectly positively correlated with itself.
B) When the covariance equals 0, the stocks have no tendency to move either together or in opposition
of one another.
C) The closer the correlation is to -1, the more the returns tend to move in opposite directions.
D) The variance of a portfolio depends only on the variance of the individual stocks.
6) Which of the following statements is FALSE?
A) If two stocks move in opposite directions, one will tend to be above average when to other is below
average, and the covariance will be negative.
B) The correlation between two stocks has the same sign as their covariance, so it has a similar
interpretation.
C) The covariance of a stock with itself is simply its variance.
D) The covariance allows us to gauge the strength of the relationship between stocks.
8
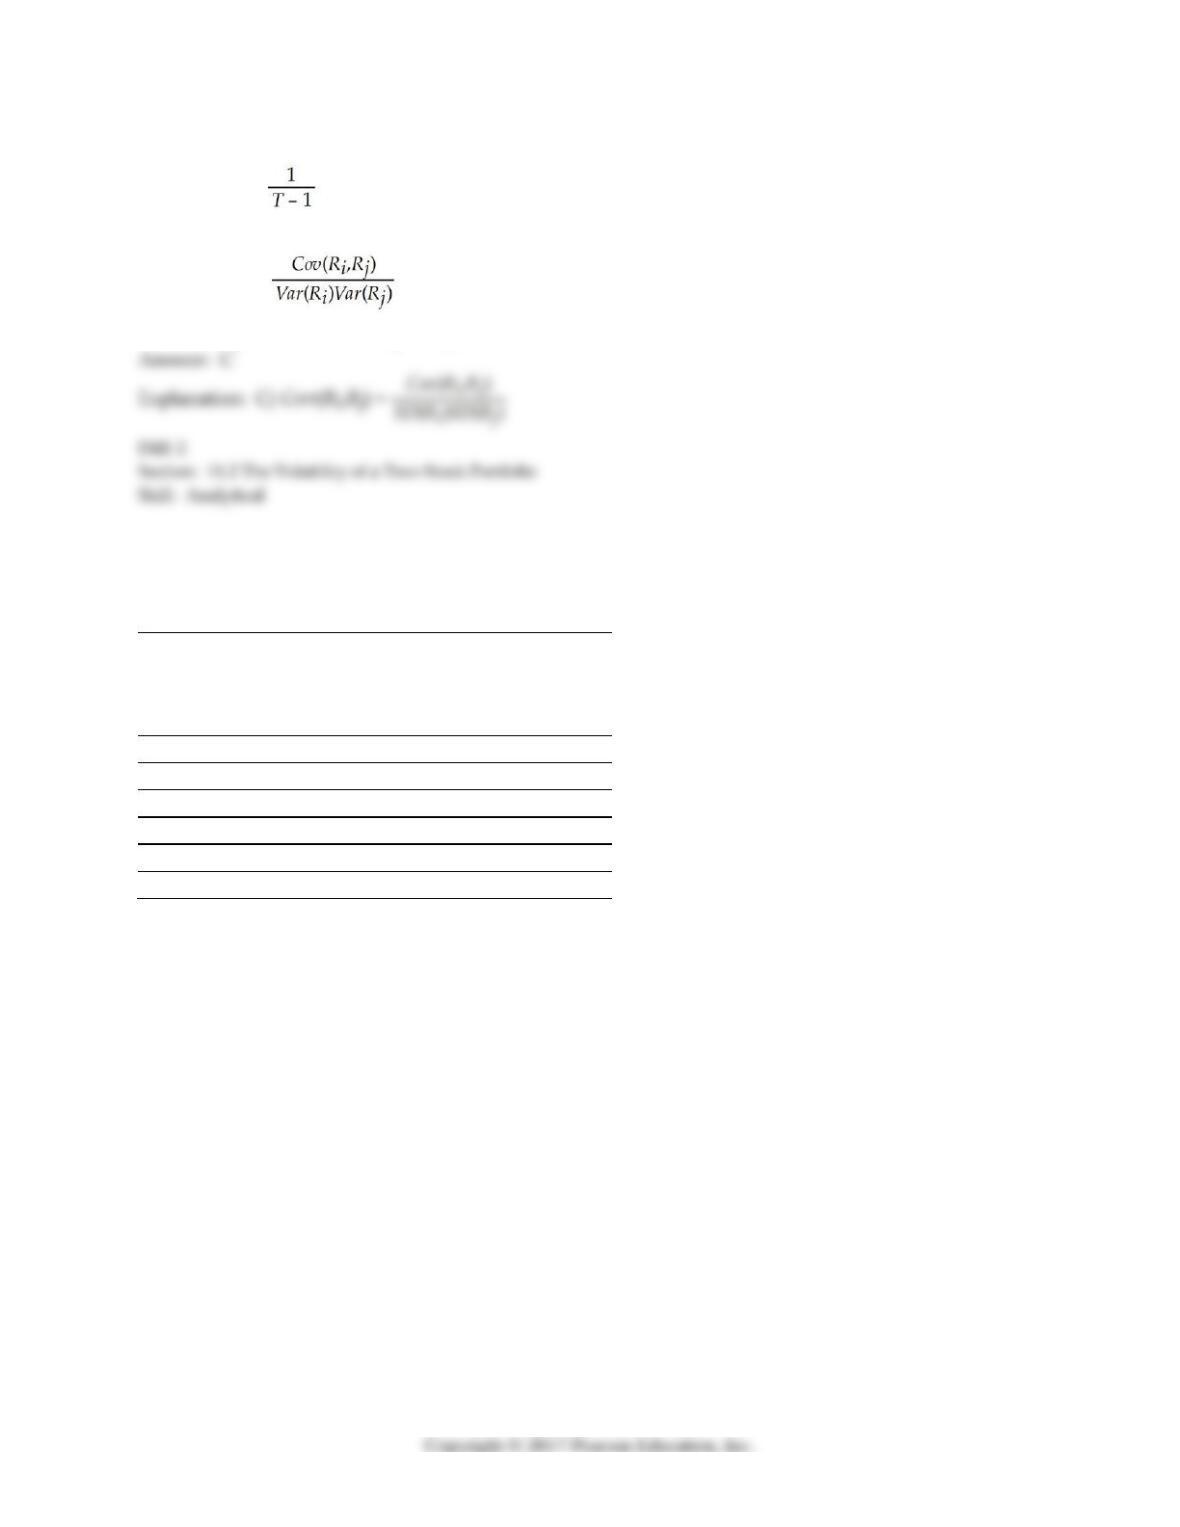
7) Which of the following equations is INCORRECT?
A) Cov(Ri,Rj) = Σ(Ri – Ri)(Rj – Rj)
B) Var(Rp) = x12Var(R1) + x22Var(R2) + 2X1X2Cov(R1,R2)
C) Corr(Ri,Rj) =
D) Cov(Ri,Rj) = E[(Ri – E[Ri])(Rj – E[Rj])]
Use the table for the question(s) below.
Consider the following returns:
Year End
Stock X
Realized
Return
Stock Y
Realized
Return
Stock Z
Realized
Return
2004
20.1%
-14.6%
0.2%
2005
72.7%
4.3%
-3.2%
2006
-25.7%
-58.1%
-27.0%
2007
56.9%
71.1%
27.9%
2008
6.7%
17.3%
-5.1%
2009
17.9%
0.9%
-11.3%
9
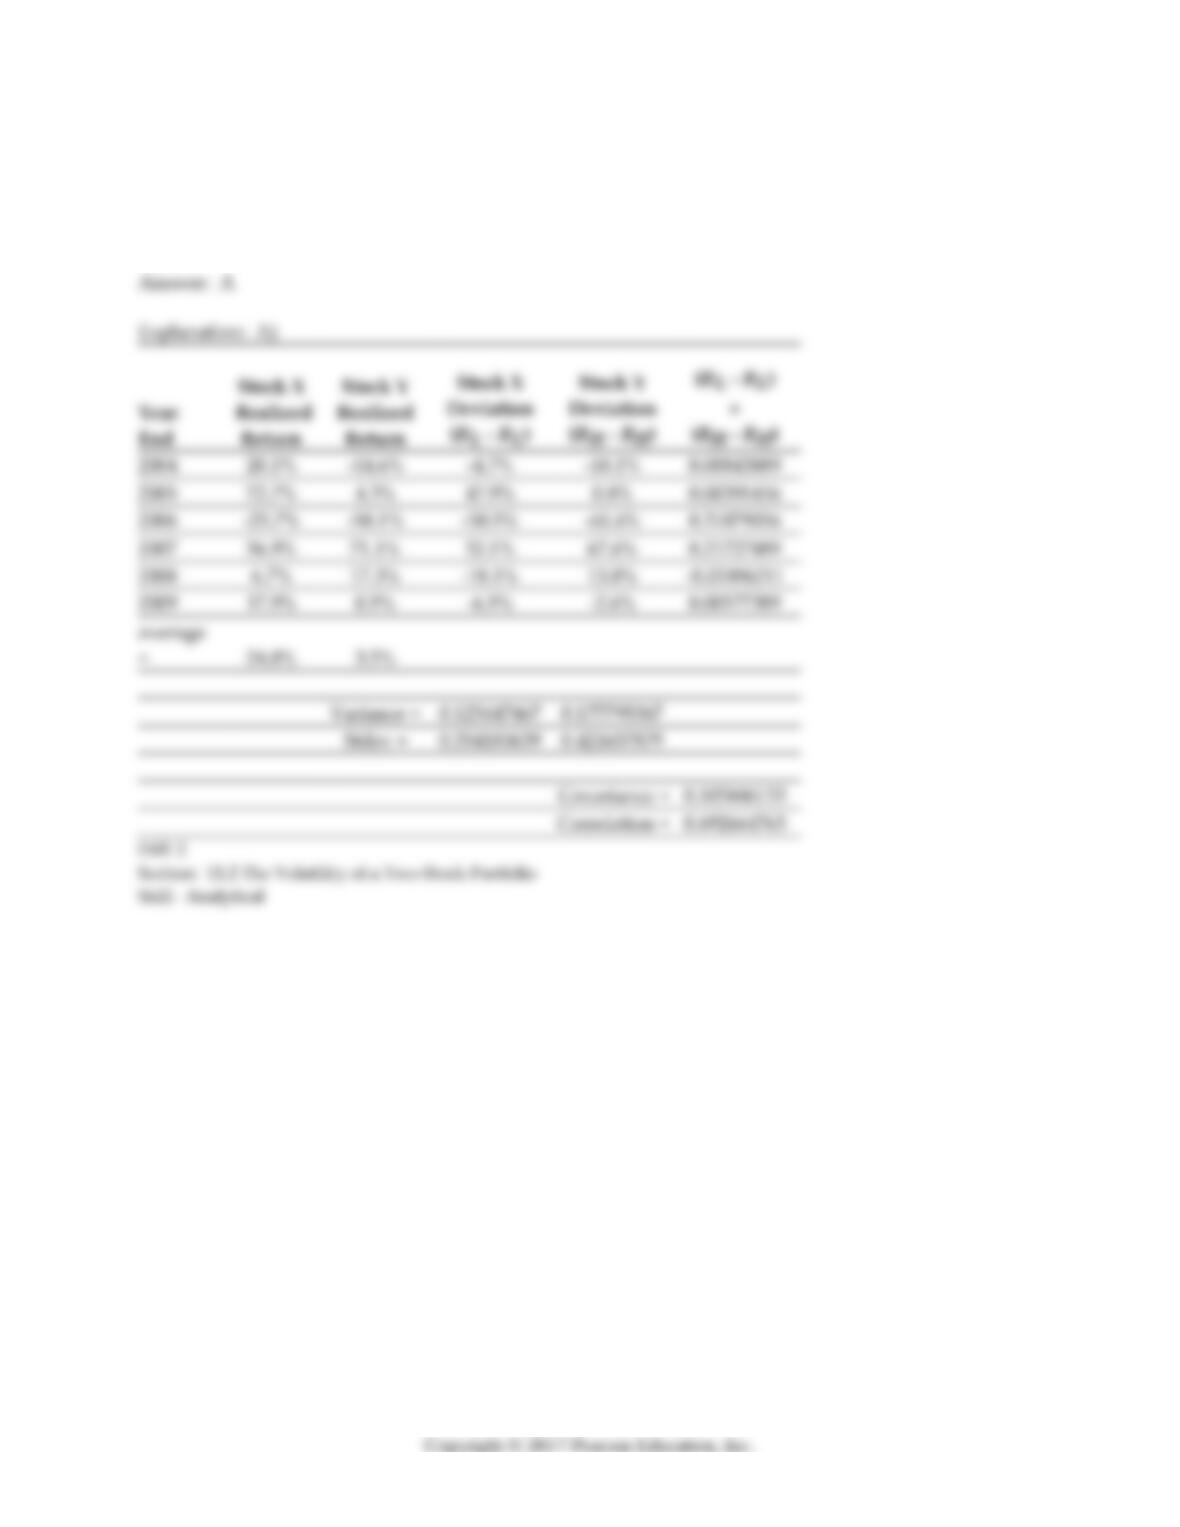
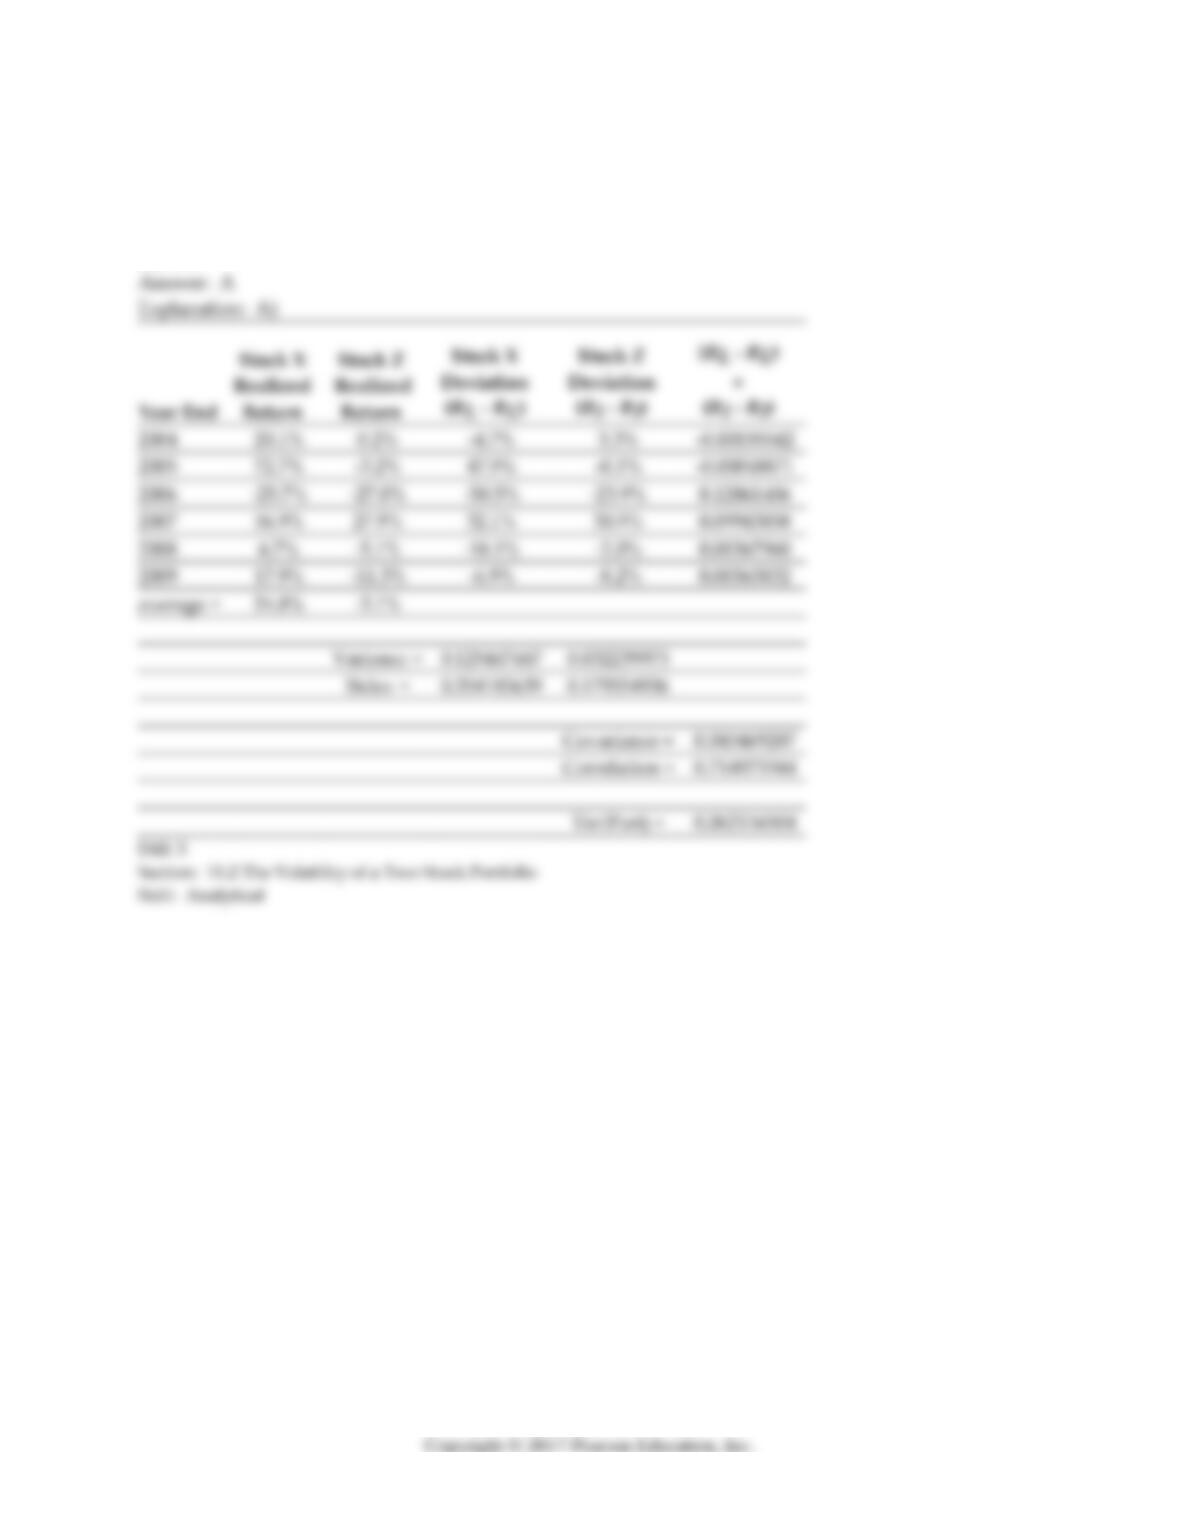
8) The covariance between Stock X’s and Stock Y’s returns is closest to:
A) 0.10
B) 0.29
C) 0.12
D) 0.69
10
9) The Volatility on Stock X’s returns is closest to:
A) 35%
B) 10%
C) 13%
D) 42%

11
10) The Volatility on Stock Y’s returns is closest to:
A) 35%
B) 31%
C) 42%
D) 18%

12
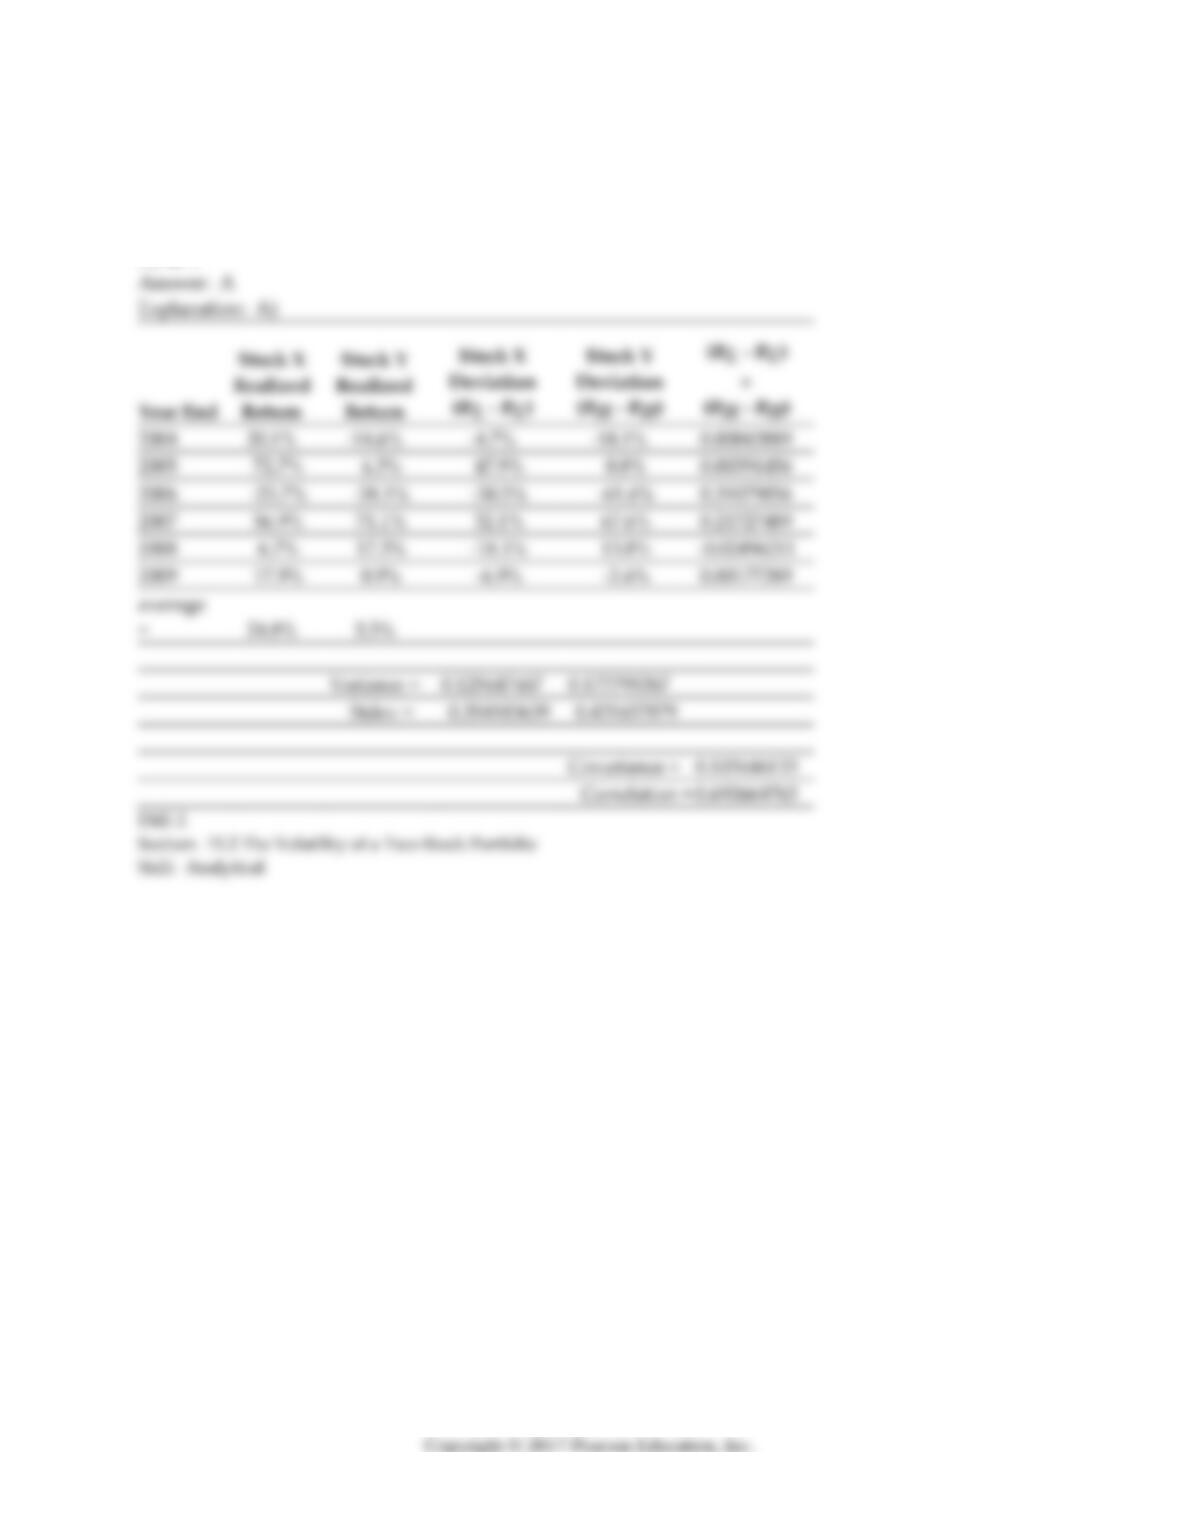
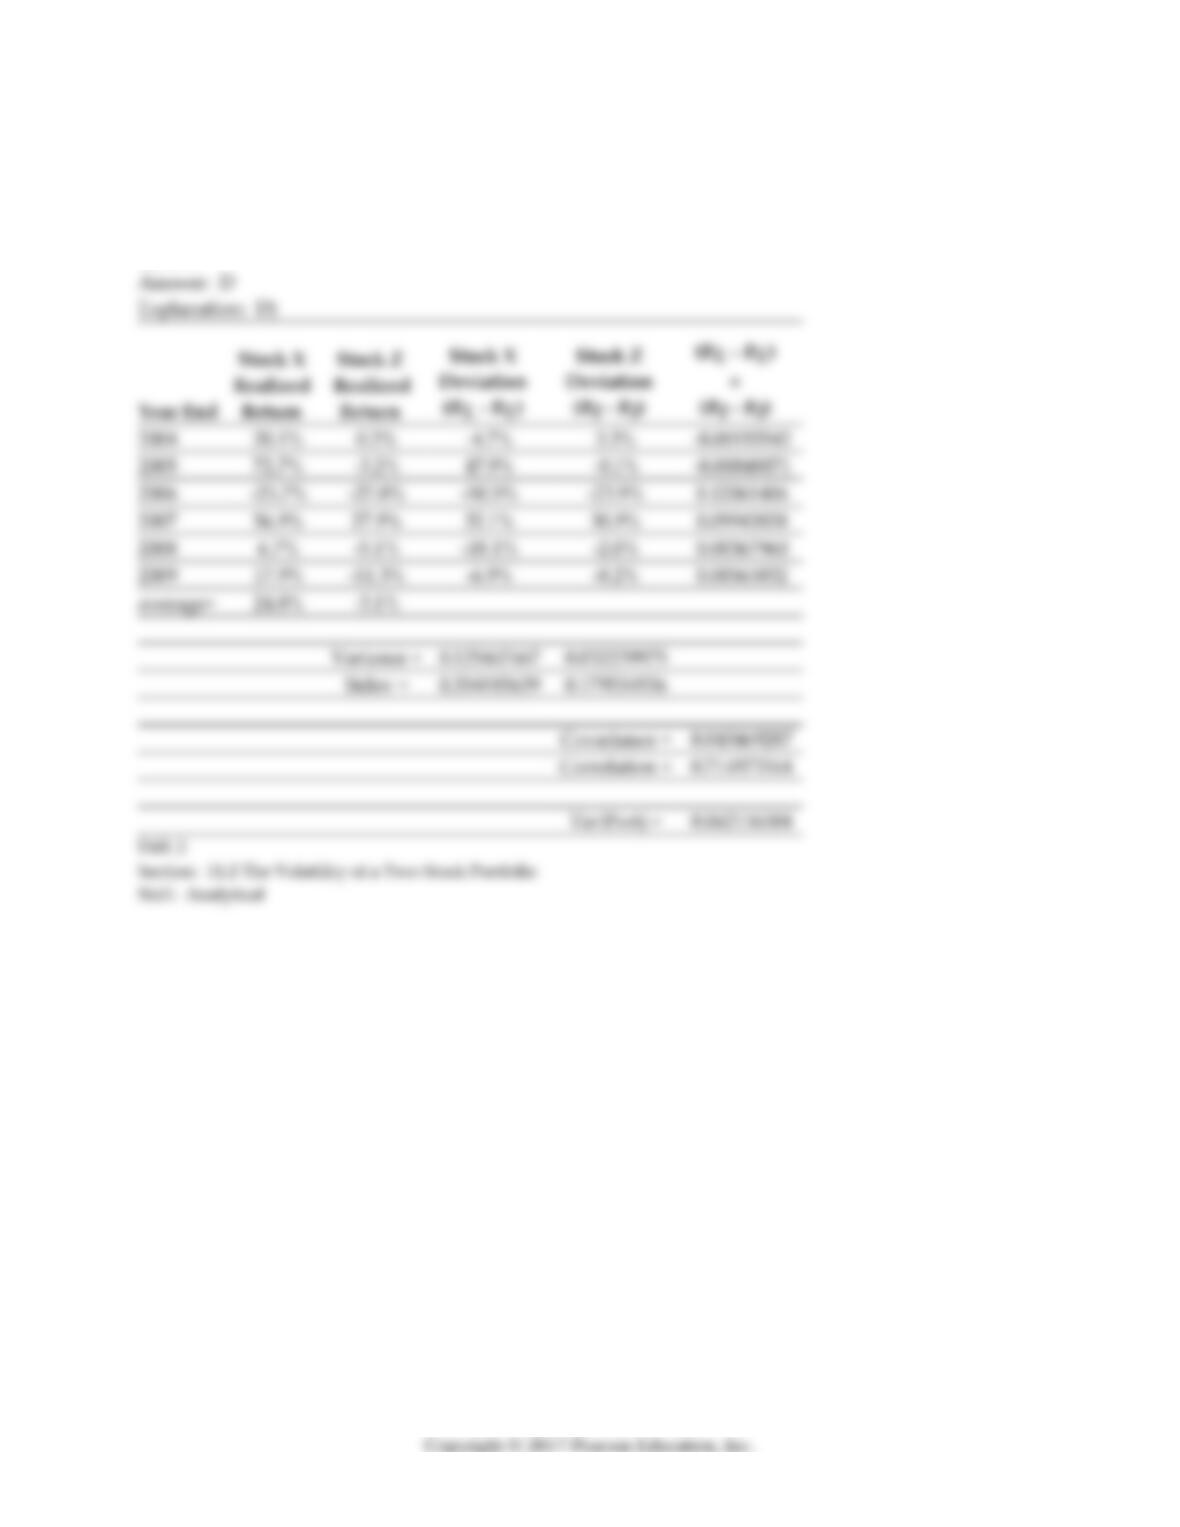
11) The Correlation between Stock X’s and Stock Y’s returns is closest to:
A) 0.58
B) 0.29
C) 0.69
D) 0.10
13
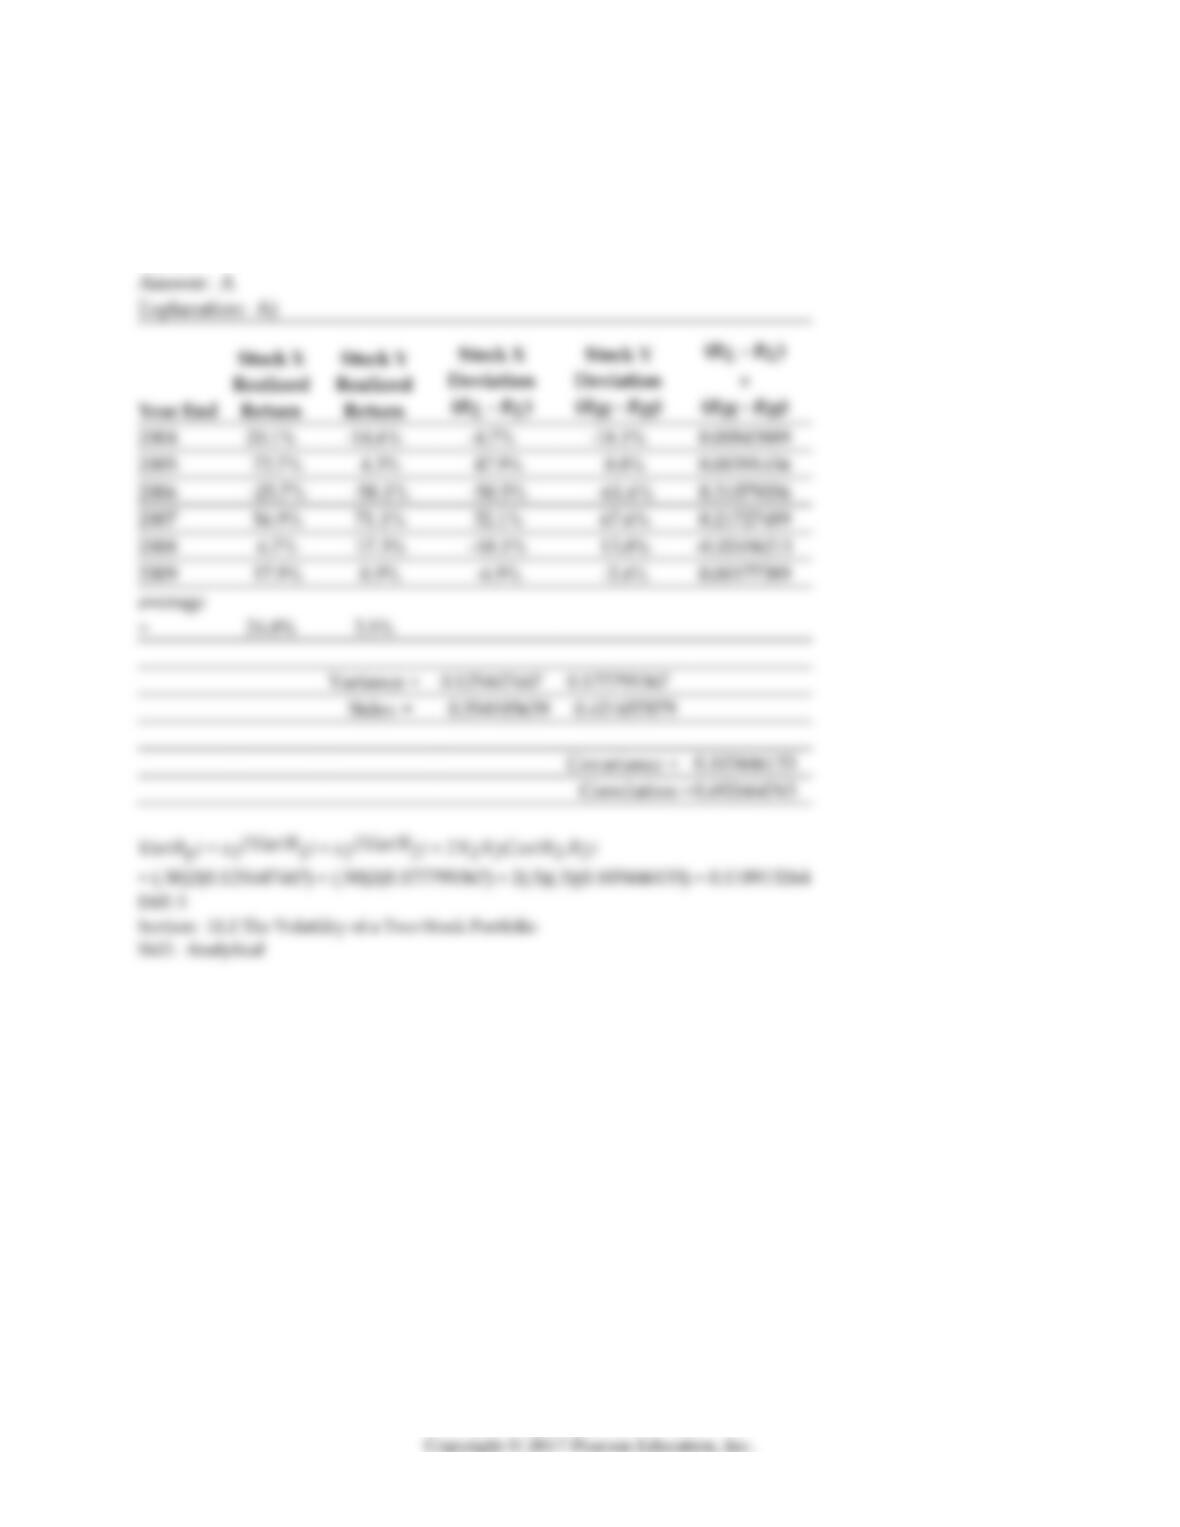
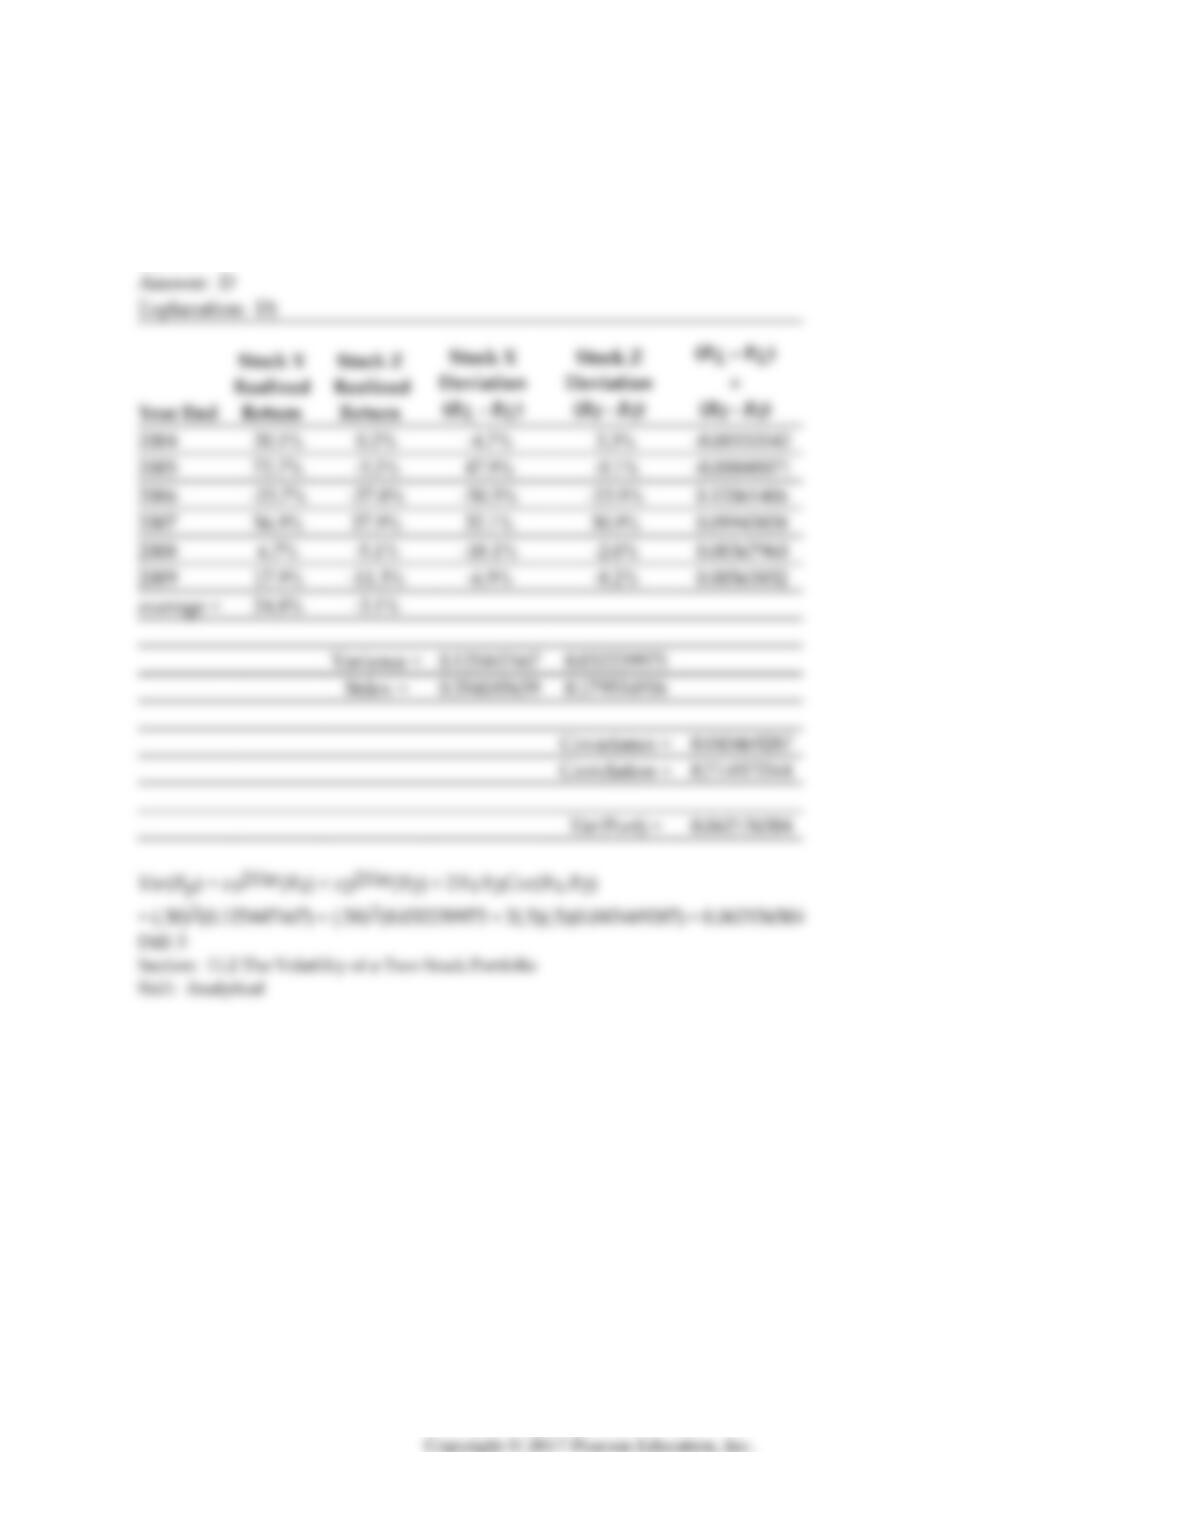
12) The variance on a portfolio that is made up of equal investments in Stock X and Stock Y is closest to:
A) 0.12
B) 0.10
C) 0.69
D) 0.29
14
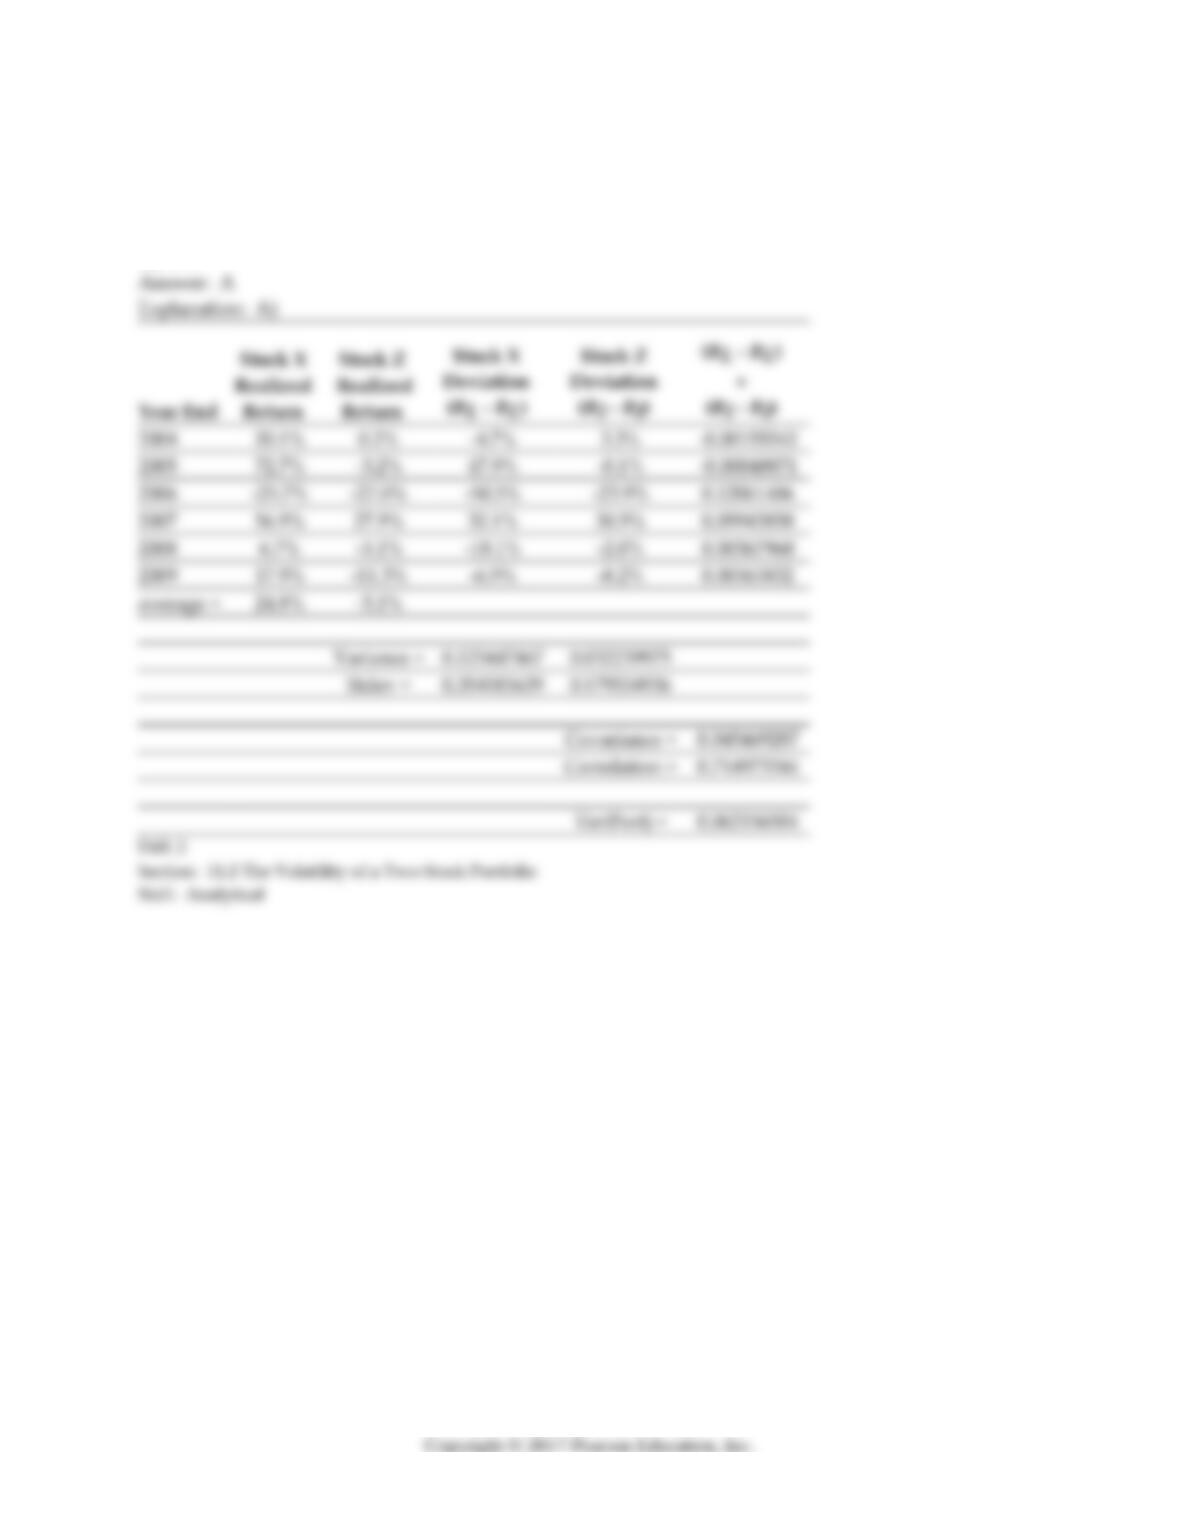
13) The covariance between Stock X’s and Stock Z’s returns is closest to:
A) 0.05
B) 0.06
C) 0.10
D) 0.71
15
14) The Correlation between Stock X’s and Stock Z’s returns is closest to:
A) 0.71
B) 0.60
C) 0.62
D) 0.05
16
15) The variance on a portfolio that is made up of equal investments in Stock X and Stock Z is closest to:
A) 0.62
B) 0.05
C) 0.12
D) 0.06
17
16) The Volatility on Stock Z’s returns is closest to:
A) 3%
B) 13%
C) 16%
D) 18%
18
Use the table for the question(s) below.
Consider the following covariances between securities:
Duke
Microsoft
Wal-Mart
Duke
0.0568
-0.0193
0.0037
Microsoft
-0.0193
0.2420
0.1277
Wal-Mart
0.0037
0.1277
0.1413
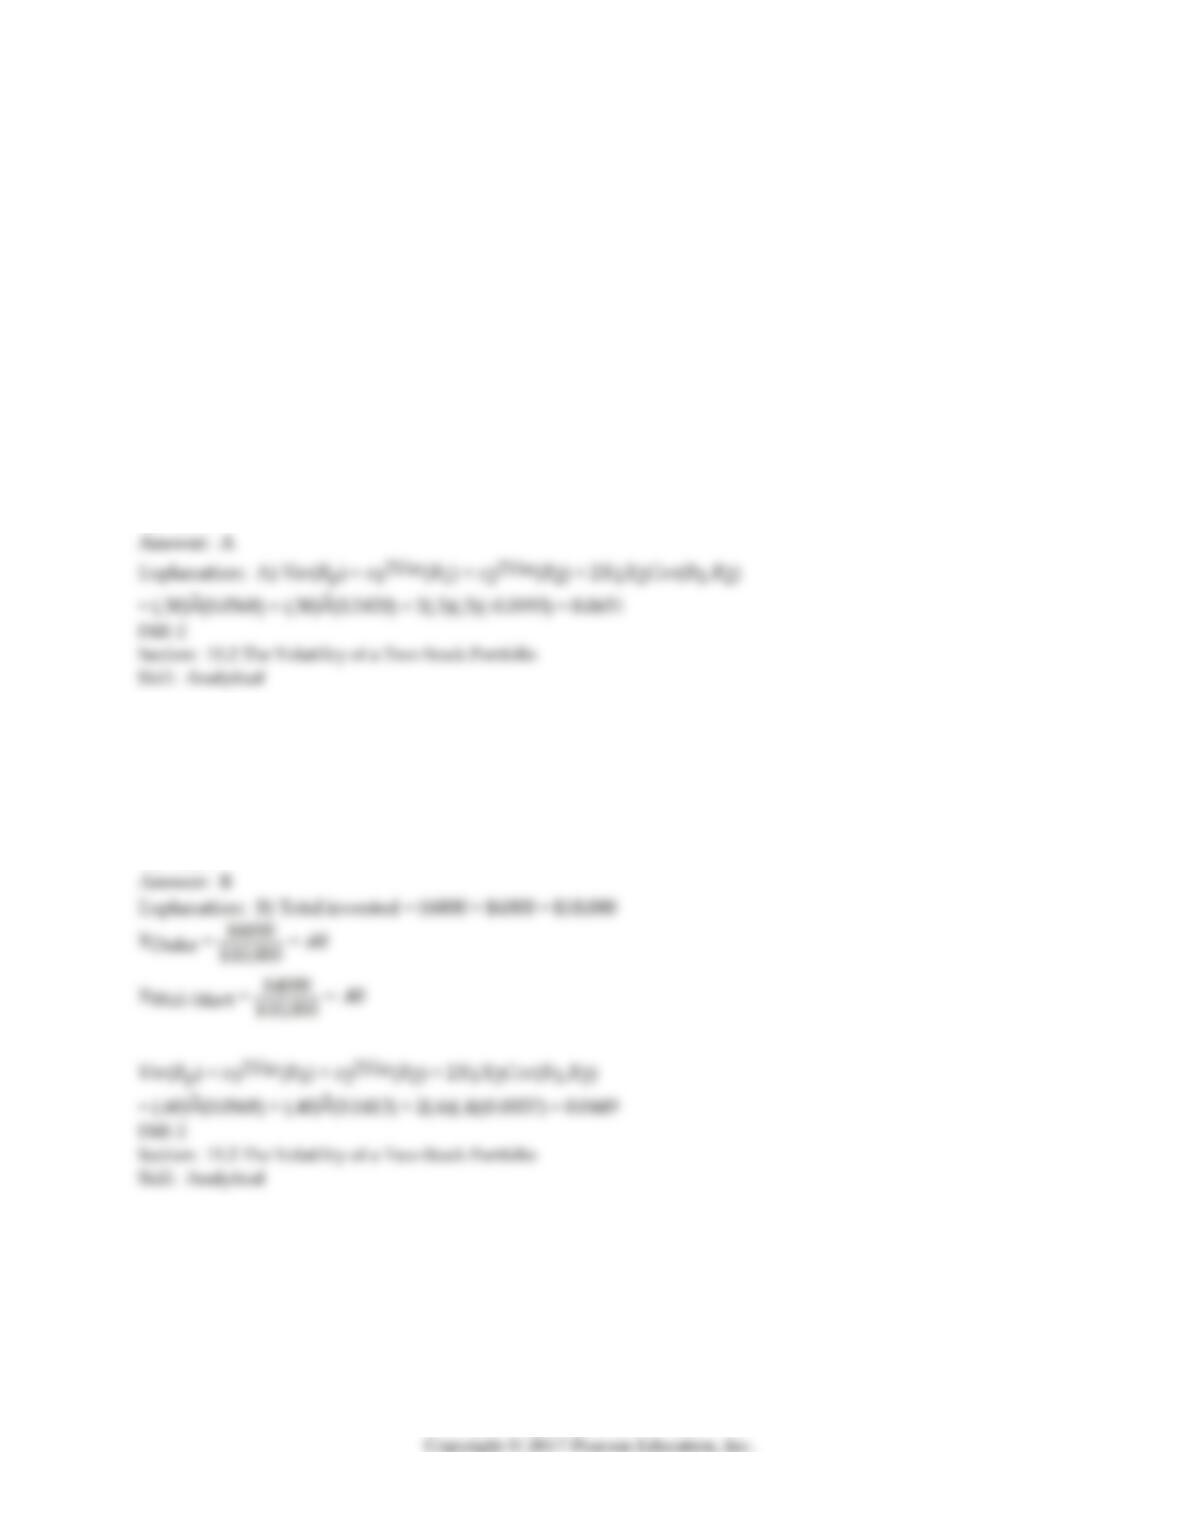
17) The variance on a portfolio that is made up of equal investments in Duke Energy and Microsoft
stock is closest to:
A) .065
B) 0.090
C) .149
D) -0.020
18) The variance on a portfolio that is made up of a $6000 investments in Duke Energy and a $4000
investment in Wal-Mart stock is closest to:
A) .050
B) .045
C) .051
D) -0.020
19
Use the table for the question(s) below.
Consider the following returns:
Year End
Stock X
Realized
Return
Stock Y
Realized
Return
Stock Z
Realized
Return
2004
20.1%
-14.6%
0.2%
2005
72.7%
4.3%
-3.2%
2006
-25.7%
-58.1%
-27.0%
2007
56.9%
71.1%
27.9%
2008
6.7%
17.3%
-5.1%
2009
17.9%
0.9%
-11.3%
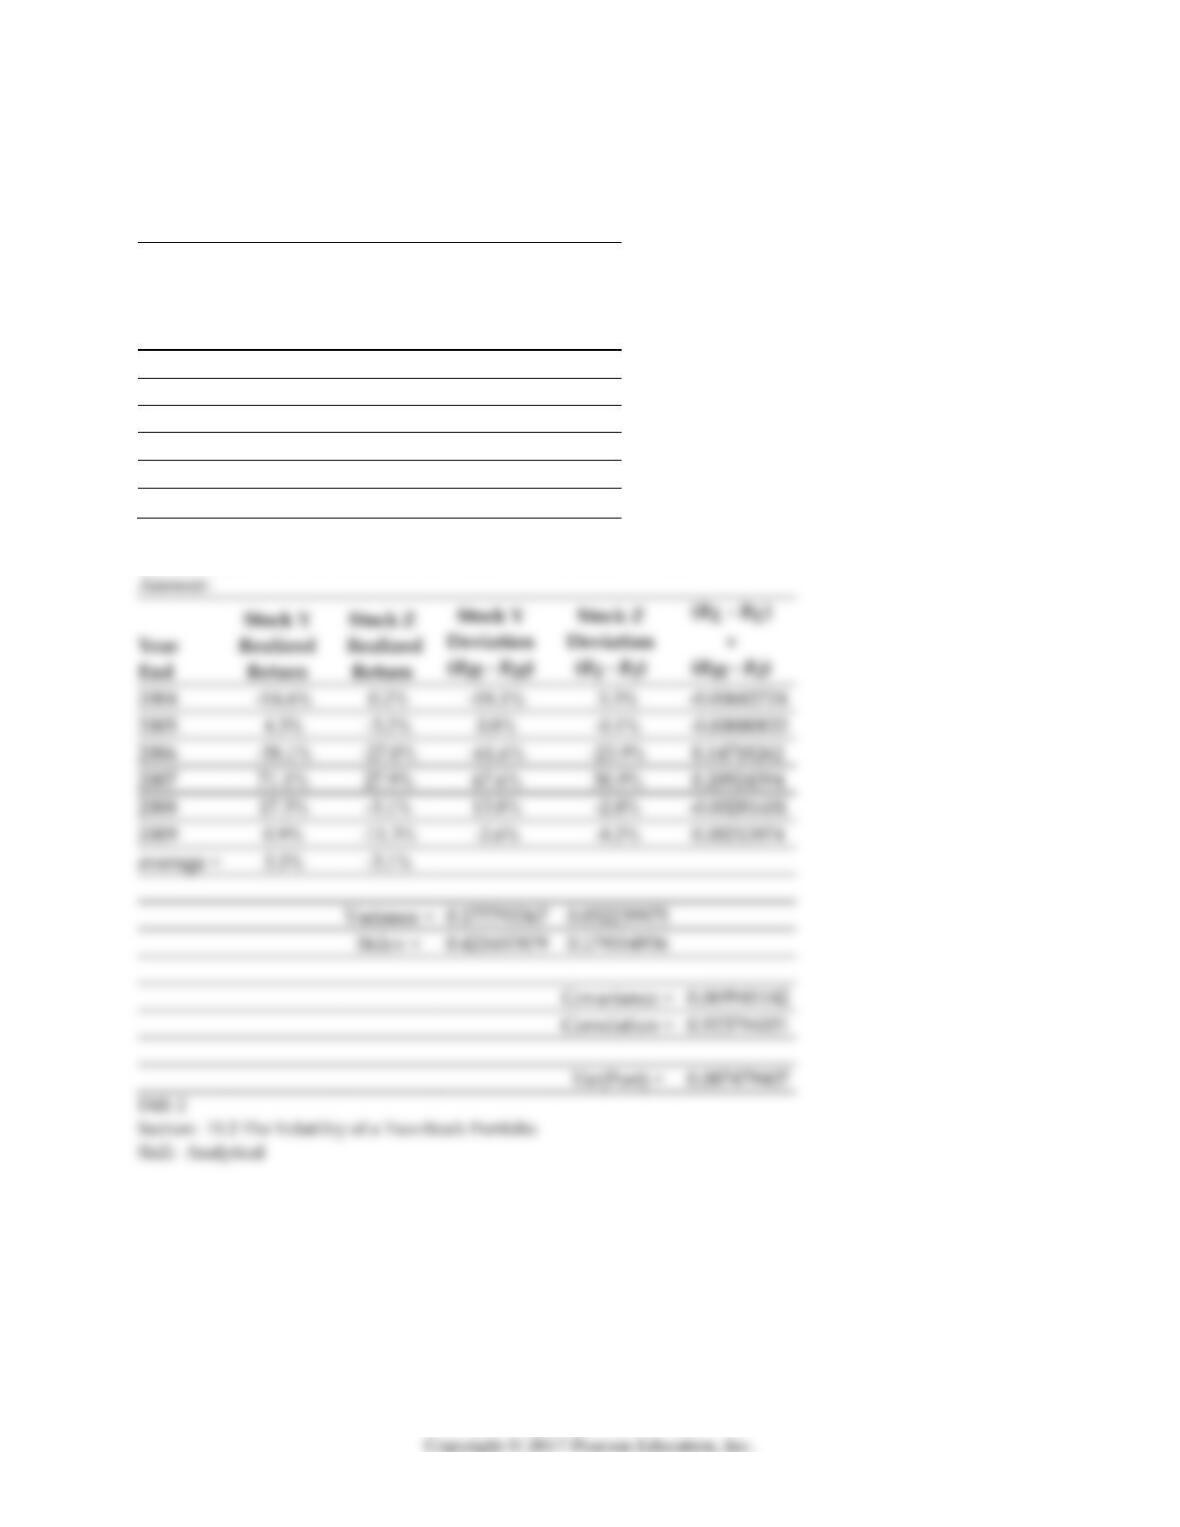
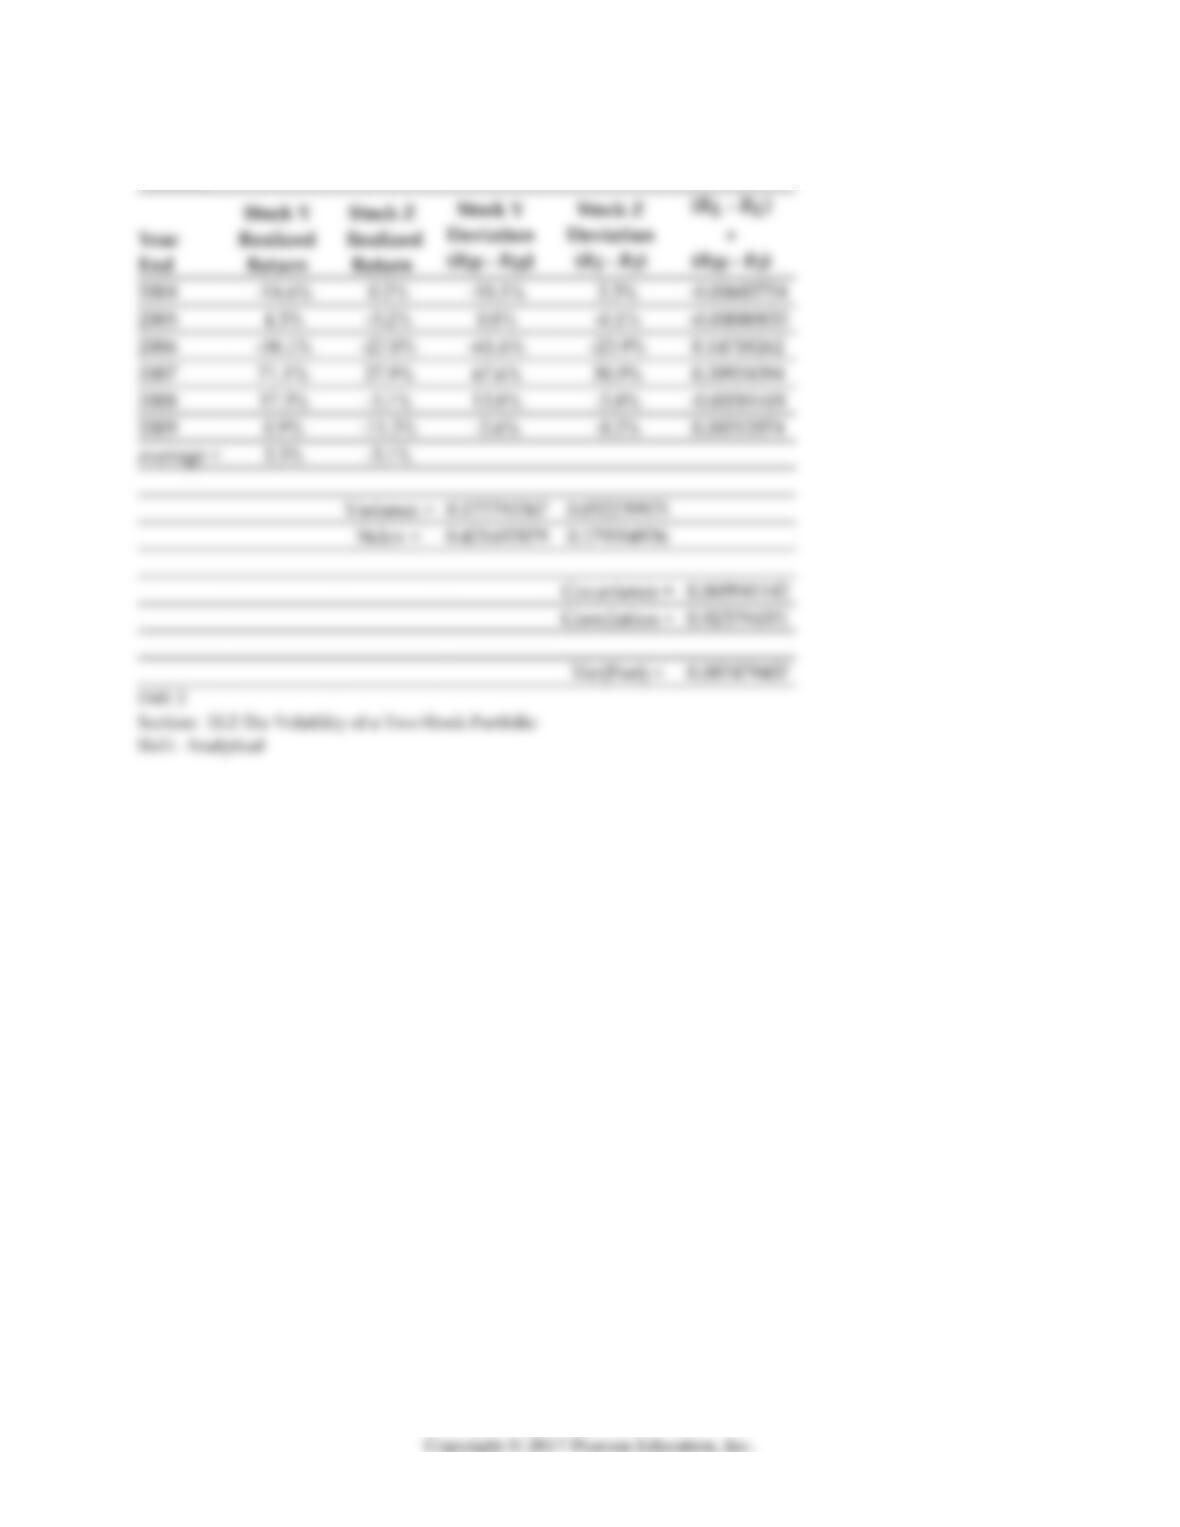
19) Calculate the covariance between Stock Y’s and Stock Z’s returns .
End
2004
-14.6%
3.3%
2005
-0.1%
2006
-58.1%
-27.0%
2007
2008
-5.1%
-2.0%
2009
-11.3%
-8.2%
Stdev =
20
20) Calculate the correlation between Stock Y’s and Stock Z’s returns .
Answer: