
1
Corporate Finance, 4e (Berk / DeMarzo)
Chapter 10 Capital Markets and the Pricing of Risk
10.1 Risk and Return: Insights from 89 Years of Investor History
1) Which of the following investments offered the lowest overall return over the past eighty years?
A) Small stocks
B) Treasury Bills
C) S&P 500
D) Corporate bonds
2) Which of the following investments offered the highest overall return over the past eighty years?
A) Treasury Bills
B) S&P 500
C) Small stocks
D) Corporate bonds
3) Which of the following investments had the largest fluctuations in overall return over the past eighty
years?
A) Small stocks
B) S&P 500
C) Corporate bonds
D) Treasury Bills
4) Which of the following statements is TRUE?
A) Small stocks have outperformed the S&P 500 in every year since 1925.
B) The S&P 500 is more volatile than corporate bonds.
C) Corporate bonds underperformed inflation during most years since 1925.
D) Treasury Bills outperformed inflation during every year since 1925.
2
10.2 Common Measures of Risk and Return
1) Which of the following statements is FALSE?
A) The variance increases with the magnitude of the deviations from the mean.
B) The variance is the expected squared deviation from the mean.
C) Two common measures of the risk of a probability distribution are its variance and standard
deviation.
D) If the return is riskless and never deviates from its mean, the variance is equal to one.
2) Which of the following statements is FALSE?
A) When an investment is risky, there are different returns it may earn.
B) In finance, the variance of a return is also referred to as its volatility.
C) The expected or mean return is calculated as a weighted average of the possible returns, where the
weights correspond to the probabilities.
D) The variance is a measure of how “spread out” the distribution of the return is.
3) Which of the following statements is FALSE?
A) The standard deviation is the square root of the variance.
B) Because investors dislike only negative resolutions of uncertainty, alternative measures that focus
solely on downside risk have been developed, such as the semi-variance and the expected tail loss.
C) While the variance and the standard deviation are the most common measures of risk, they do not
differentiate between upside and downside risk.
D) While the variance and the standard deviation both measure the variability of the returns, the
variance is easier to interpret because it is in the same units as the returns themselves.

3
4) Which of the following equations is INCORRECT?
A) Var(R) =
B) SD(R) =
C) Var(R) = PR × (R – E[R])2
D) E[R] = PR × R
Use the table for the question(s) below.
Consider the following probability distribution of returns for Alpha Corporation:
Current
Stock Price
($)
Stock Price in
One Year ($)
Return R
Probability
PR
$35
40%
25%
$25
$25
0%
50%
$20
–20%
25%
5) The expected return for Alpha Corporation is closest to:
A) 6.67%
B) 5.00%
C) 10%
D) 0.00%
6) The variance of the return on Alpha Corporation is closest to:
A) 5.00%
B) 4.75%
C) 3.625%
D) 3.75%
4
7) The standard deviation of the return on Alpha Corporation is closest to:
A) 22.4%
B) 19.0%
C) 21.8%
D) 19.4%
8) Suppose an investment is equally likely to have a 35% return or a -20% return. The expected return
for this investment is closest to:
A) 7.5%
B) 15%
C) 5%
D) 10%
9) Suppose an investment is equally likely to have a 35% return or a -20% return. The variance on the
return for this investment is closest to:
A) .151
B) .0378
C) 0
D) .075
5
10) Suppose an investment is equally likely to have a 35% return or a -20% return. The standard
deviation on the return for this investment is closest to:
A) 38.9%
B) 0%
C) 19.4%
D) 27.5%
10.3 Historical Returns of Stocks and Bonds
1) Which of the following statements is FALSE?
A) The expected return is the return that actually occurs over a particular time period.
B) If you hold the stock beyond the date of the first dividend, then to compute you return you must
specify how you invest any dividends you receive in the interim.
C) The average annual return of an investment during some historical period is simply the average of
the realized returns for each year.
D) The realized return is the total return we earn from dividends and capital gains, expressed as a
percentage of the initial stock price.
2) Which of the following statements is FALSE?
A) We measure the degree of estimation error statistically through the standard error of the estimate.
B) When focusing on the returns of a single security, its common practice to assume that all dividends
are immediately invested at the risk-free rate.
C) We estimate the standard deviation or volatility as the square root of the variance.
D) We estimate the variance by computing the average squared deviation from the average realized
return.

6
3) Which of the following statements is FALSE?
A) The standard error provides an indication of how far the sample average might deviate from the
expected return.
B) The 95% confidence interval for the expected return is defined as the Historical Average Return plus
or minus three standard errors.
C) We can use a security’s historical average return to estimate its actual expected return.
D) The standard error is the standard deviation of the average return.
4) Which of the following statements is FALSE?
A) The compounded geometric average return is most often used for comparative purposes.
B) We should use the arithmetic average return when we are trying to estimate an investment’s
expected return over a future horizon based on its past performance.
C) The geometric average return will always be above the arithmetic average return and the difference
grows with the volatility of the annual returns.
D) The geometric average return is a better description of the long-run historical performance of an
investment.
5) If a stock pays dividends at the end of each quarter, with realized returns of R1, R2, R3, and R4 each
quarter, then the annual realized return is calculated as:
A) Rannual =
B) Rannual = (1 + R1)(1 + R2)(1 + R3)(1 + R4)
C) Rannual = (1 + R1)(1 + R2)(1 + R3)(1 + R4) – 1
D) Rannual = R1 + R2 + R3 + R4

7
Use the table for the question(s) below.
Consider the following Price and Dividend data for General Electric Company:
Date
Price ($)
Dividend
($)
December 31, 2008
$14.64
January 26, 2009
$13.35
$0.10
April 28, 2009
$9.14
$0.10
July 29, 2009
$10.74
$0.10
October 28, 2009
$8.02
$0.10
December 30, 2009
$7.72
6) Assume that you purchased General Electric Company stock at the closing price on December 31,
2008 and sold it after the dividend had been paid at the closing price on January 26, 2009. Your
dividend yield for this period is closest to:
A) -8.15%
B) 0.75%
C) 0.70%
D) -8.80%
7) Assume that you purchased General Electric Company stock at the closing price on December 31,
2008 and sold it after the dividend had been paid at the closing price on January 26, 2009. Your capital
gains rate (yield) for this period is closest to:
A) 0.75%
B) 0.70%
C) -8.80%
D) -8.15%
8
8) Assume that you purchased General Electric Company stock at the closing price on December 31,
2008 and sold it after the dividend had been paid at the closing price on January 26, 2009. Your total
return rate (yield) for this period is closest to:
A) 0.75%
B) -8.80%
C) 0.70%
D) -8.15%
9) Assume that you purchased Ford Motor Company stock at the closing price on December 31, 2008
and sold it at the closing price on December 30, 2009. Your realized annual return for the year 2009 is
closest to:
A) -45.1%
B) -44.5%
C) -48.5%
D) -47.3%

9
Use the table for the question(s) below.
Consider the following realized annual returns:
Year End
Index
Realized
Return
Stock A
Realized
Return
2000
23.6%
46.3%
2001
24.7%
26.7%
2002
30.5%
86.9%
2003
9.0%
23.1%
2004
-2.0%
0.2%
2005
-17.3%
-3.2%
2006
-24.3%
-27.0%
2007
32.2%
27.9%
2008
4.4%
-5.1%
2009
7.4%
-11.3%
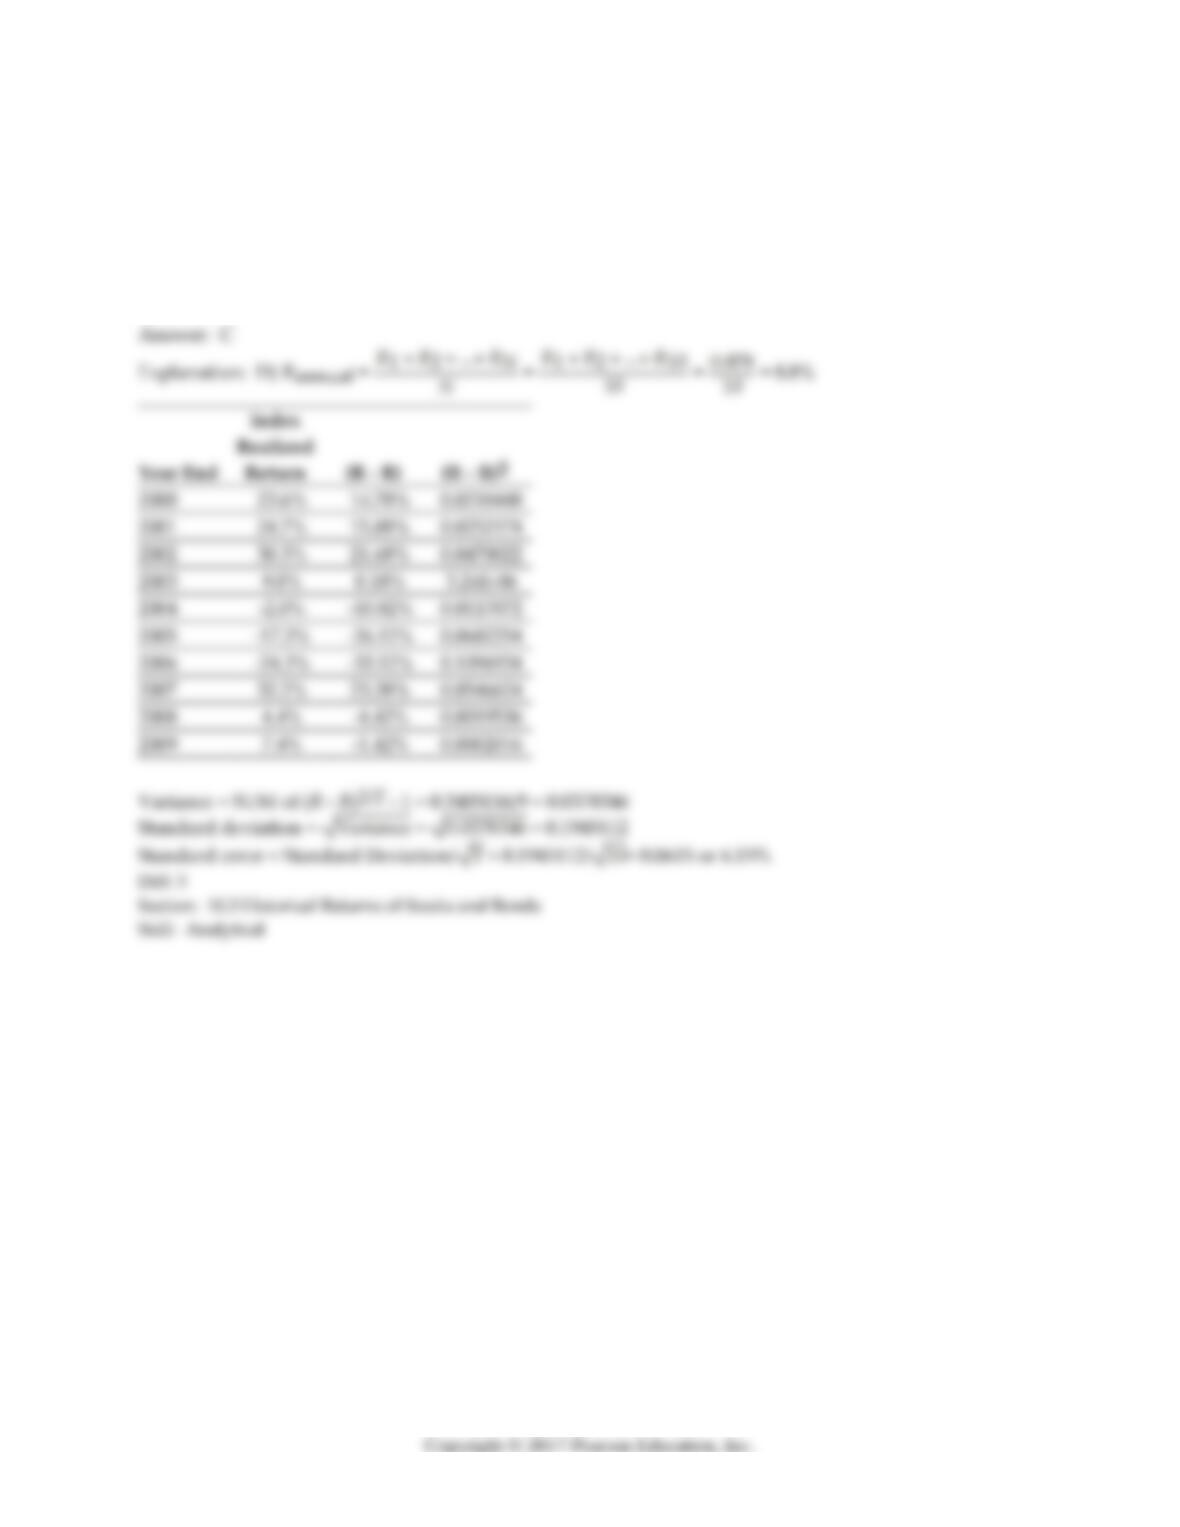
10) The average annual return on the Index from 2000 to 2009 is closest to:
A) 7.10%
B) 4.00%
C) 9.75%
D) 8.75%
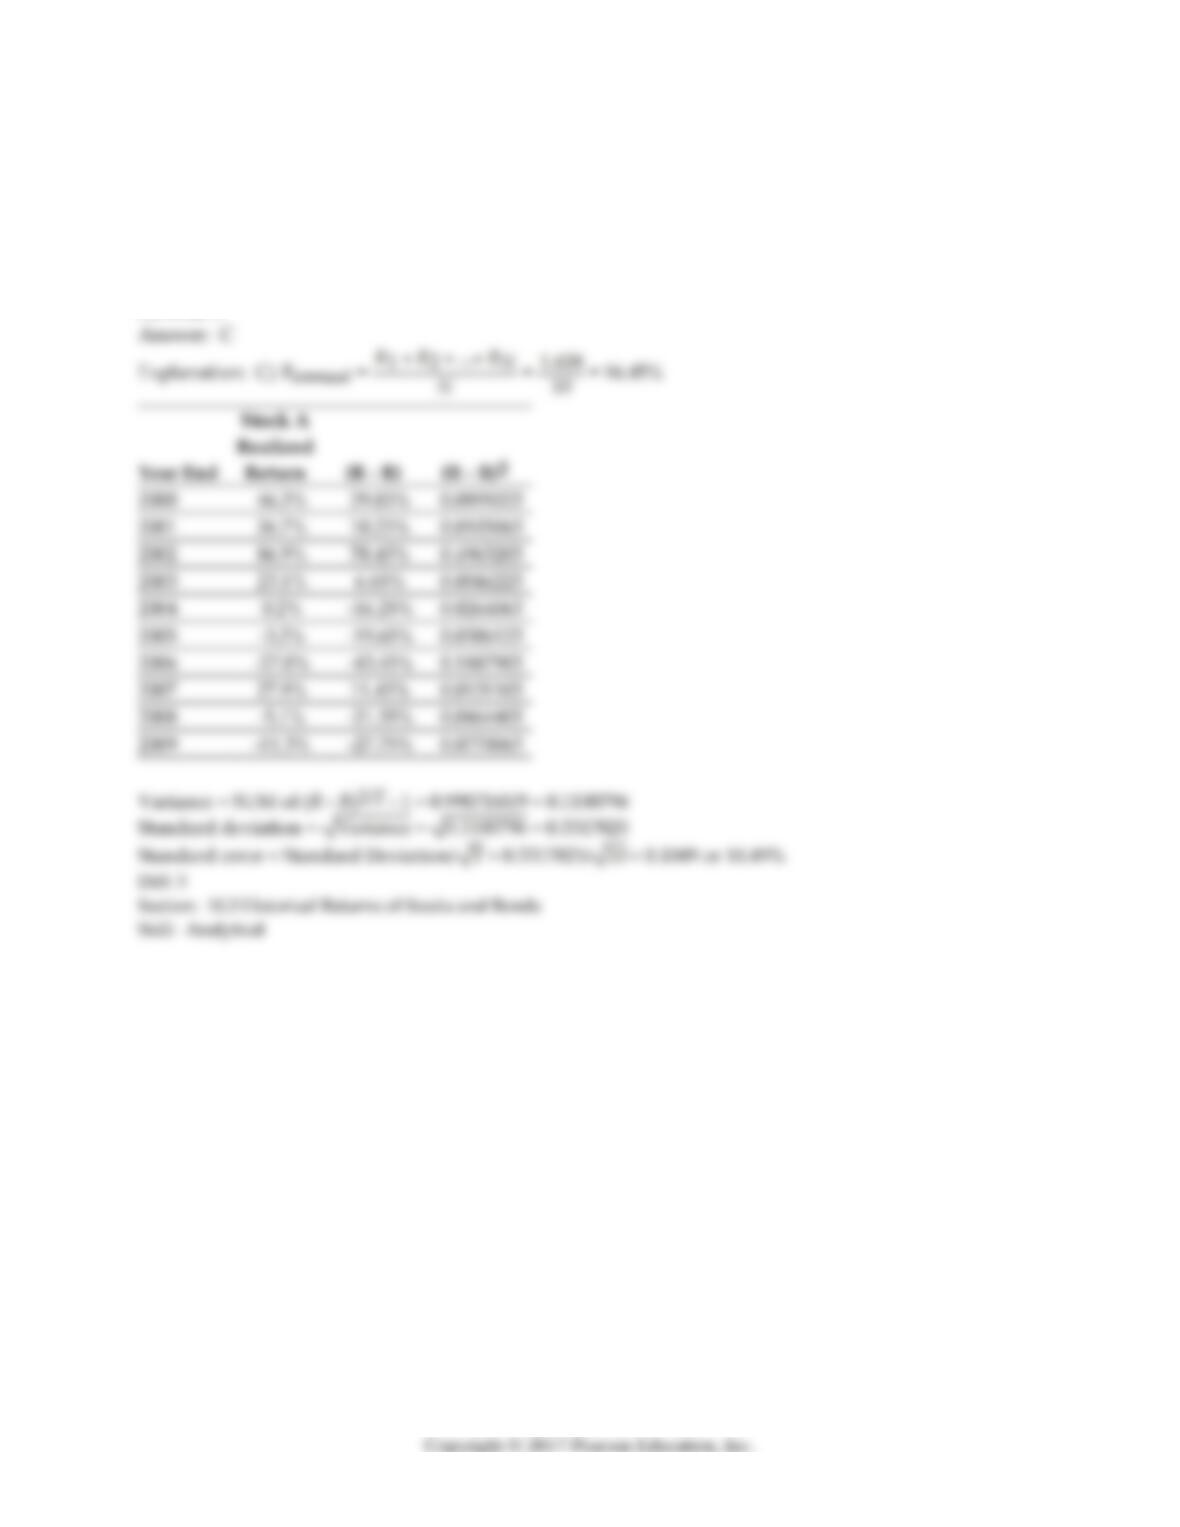
11) The average annual return on Stock A from 2000 to 2009 is closest to:
A) 29.9%
B) 16.40%
C) 18.2%
D) 18.7%
10
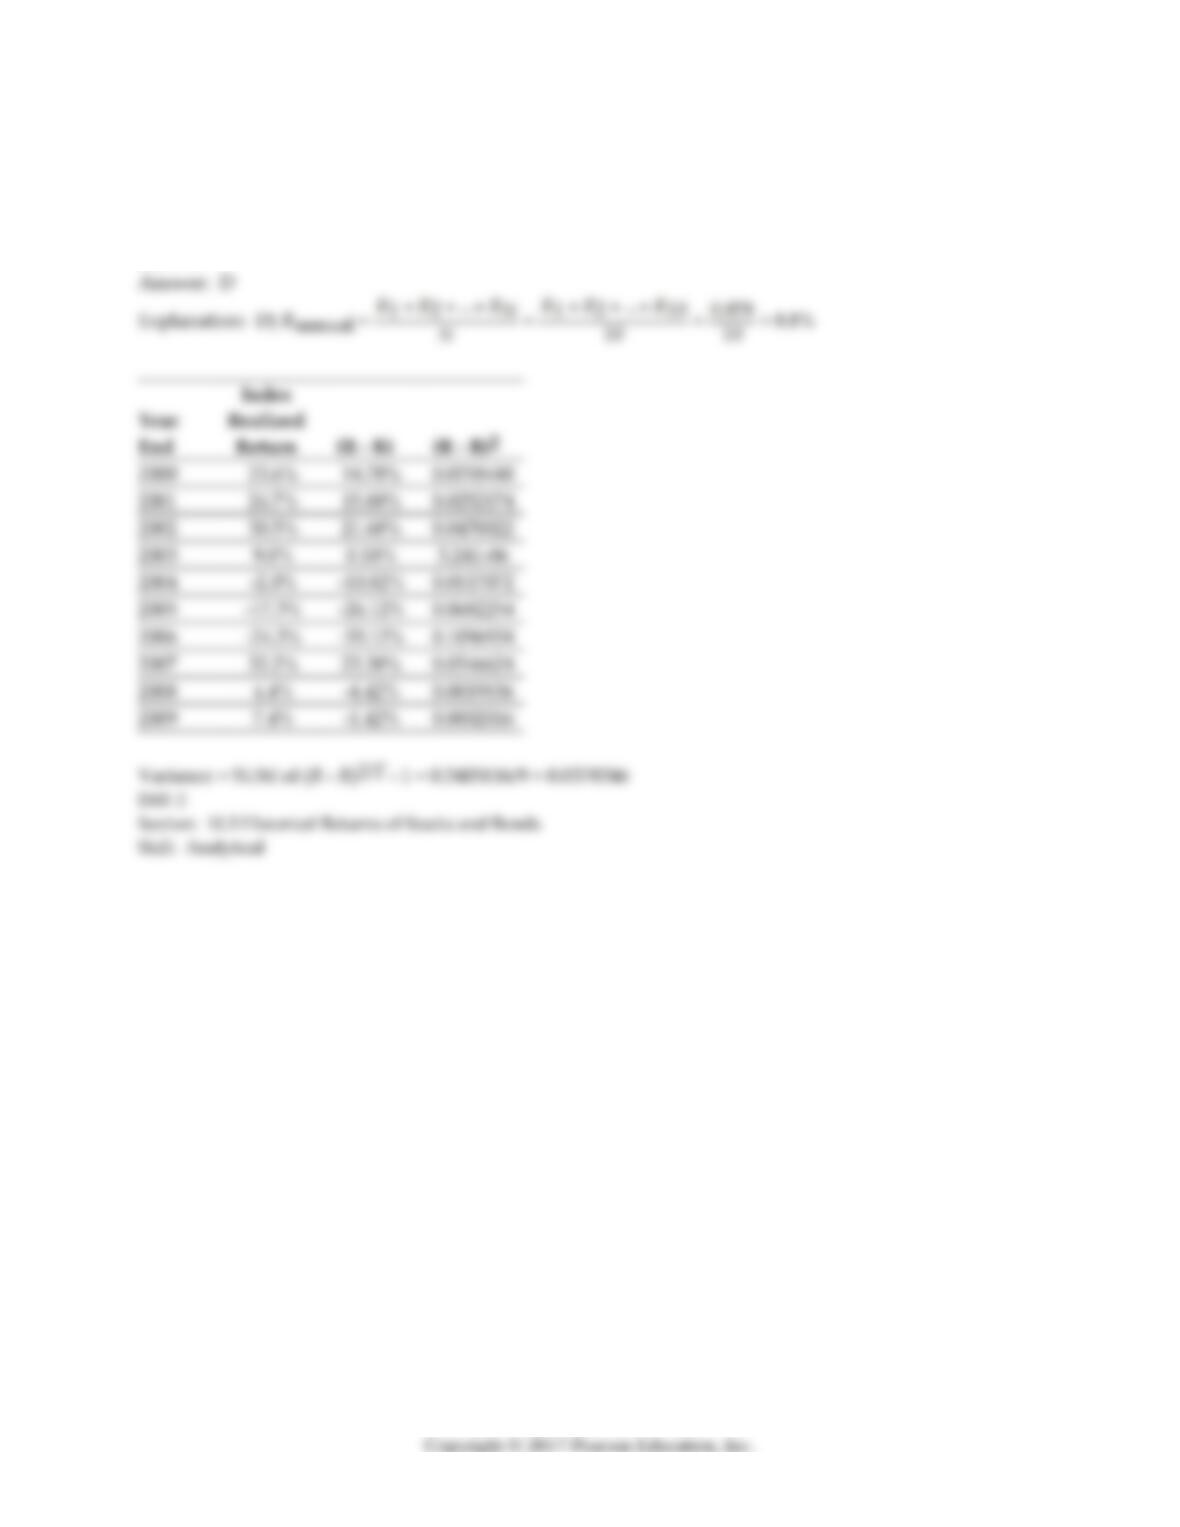
12) The variance of the returns on the Index from 2000 to 2009 is closest to:
A) .0450
B) .3400
C) .1935
D) .0375
11
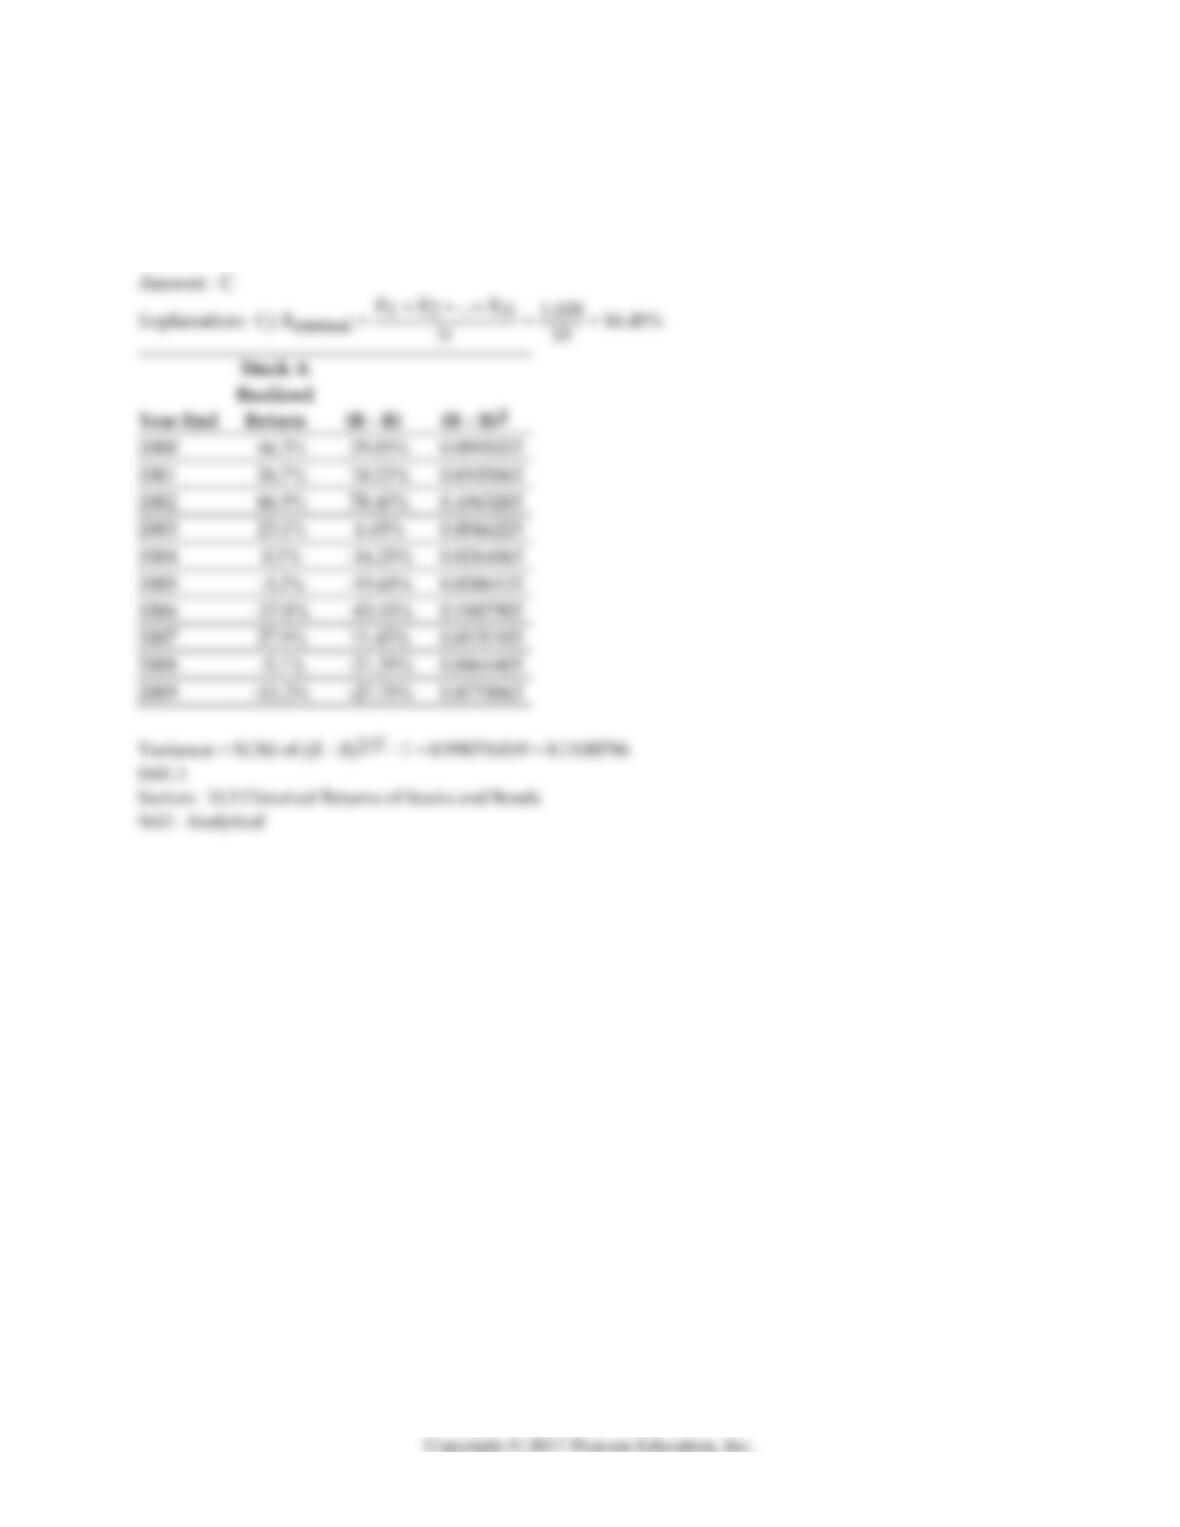
13) The variance of the returns on Stock A from 2000 to 2009 is closest to:
A) .3145
B) .0990
C) .1100
D) .9890
12
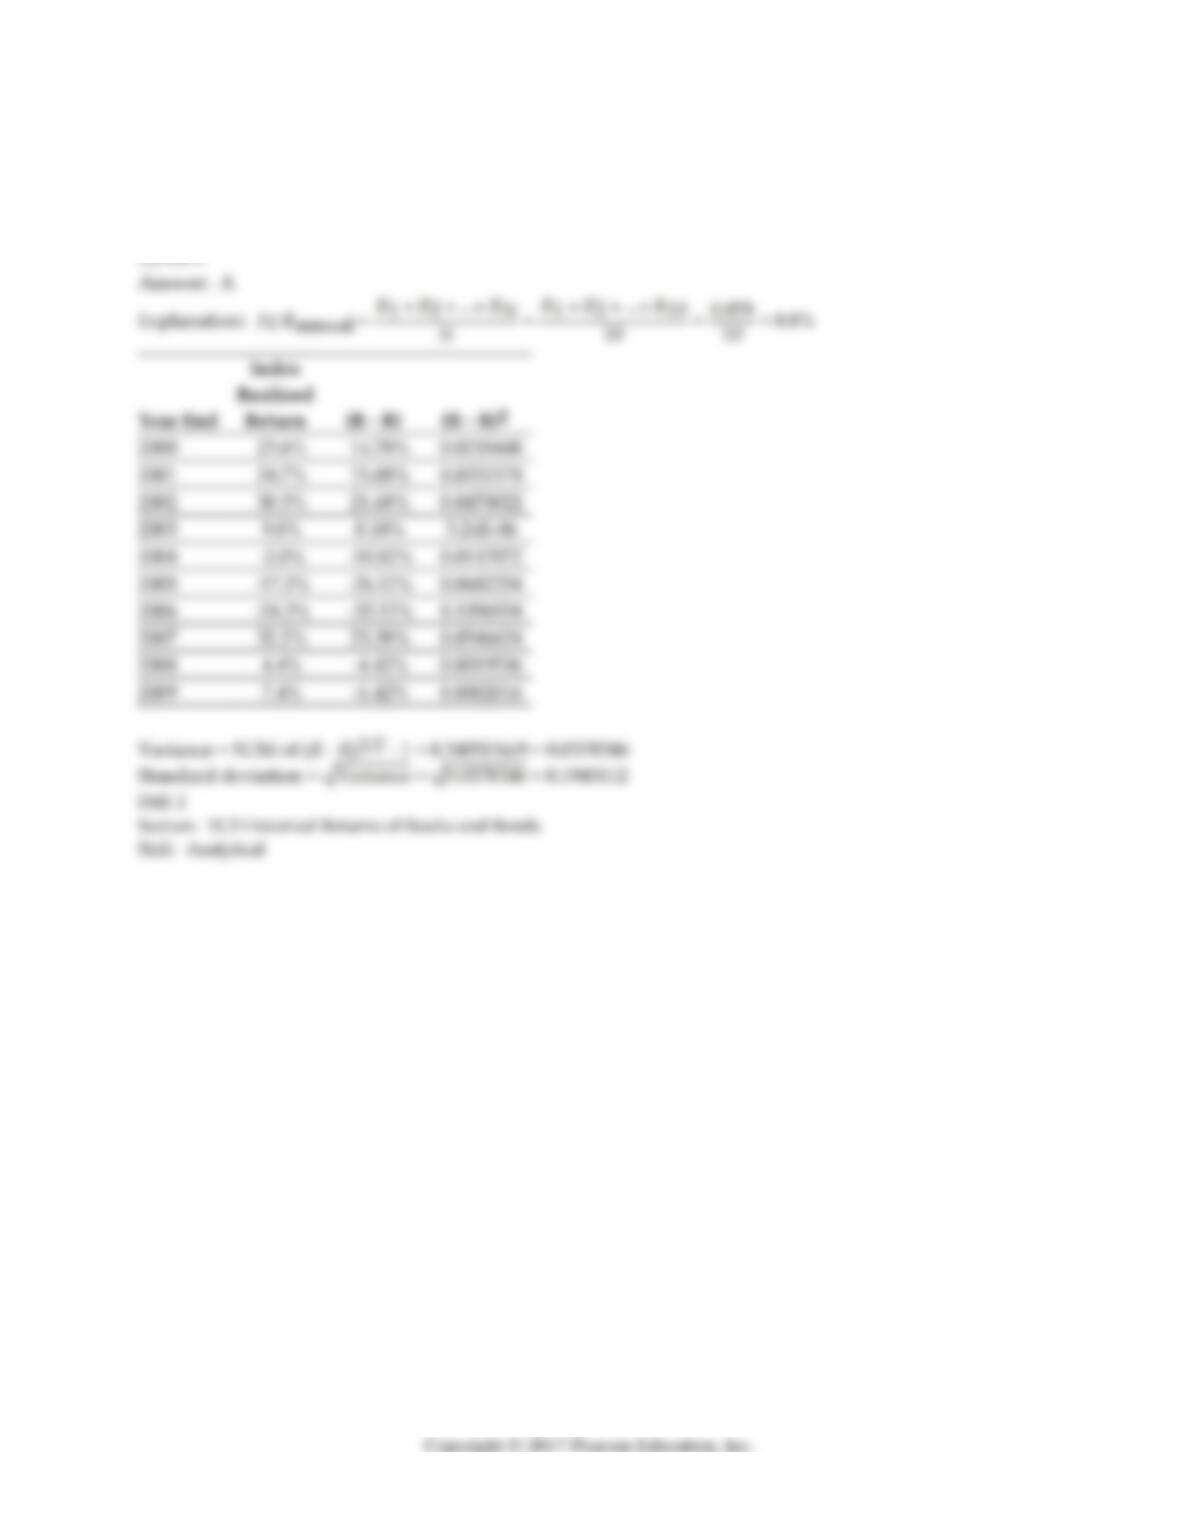
14) The standard deviation of the returns on the Index from 2000 to 2009 is closest to:
A) 19.5%
B) 20.5%
C) 3.8%
13
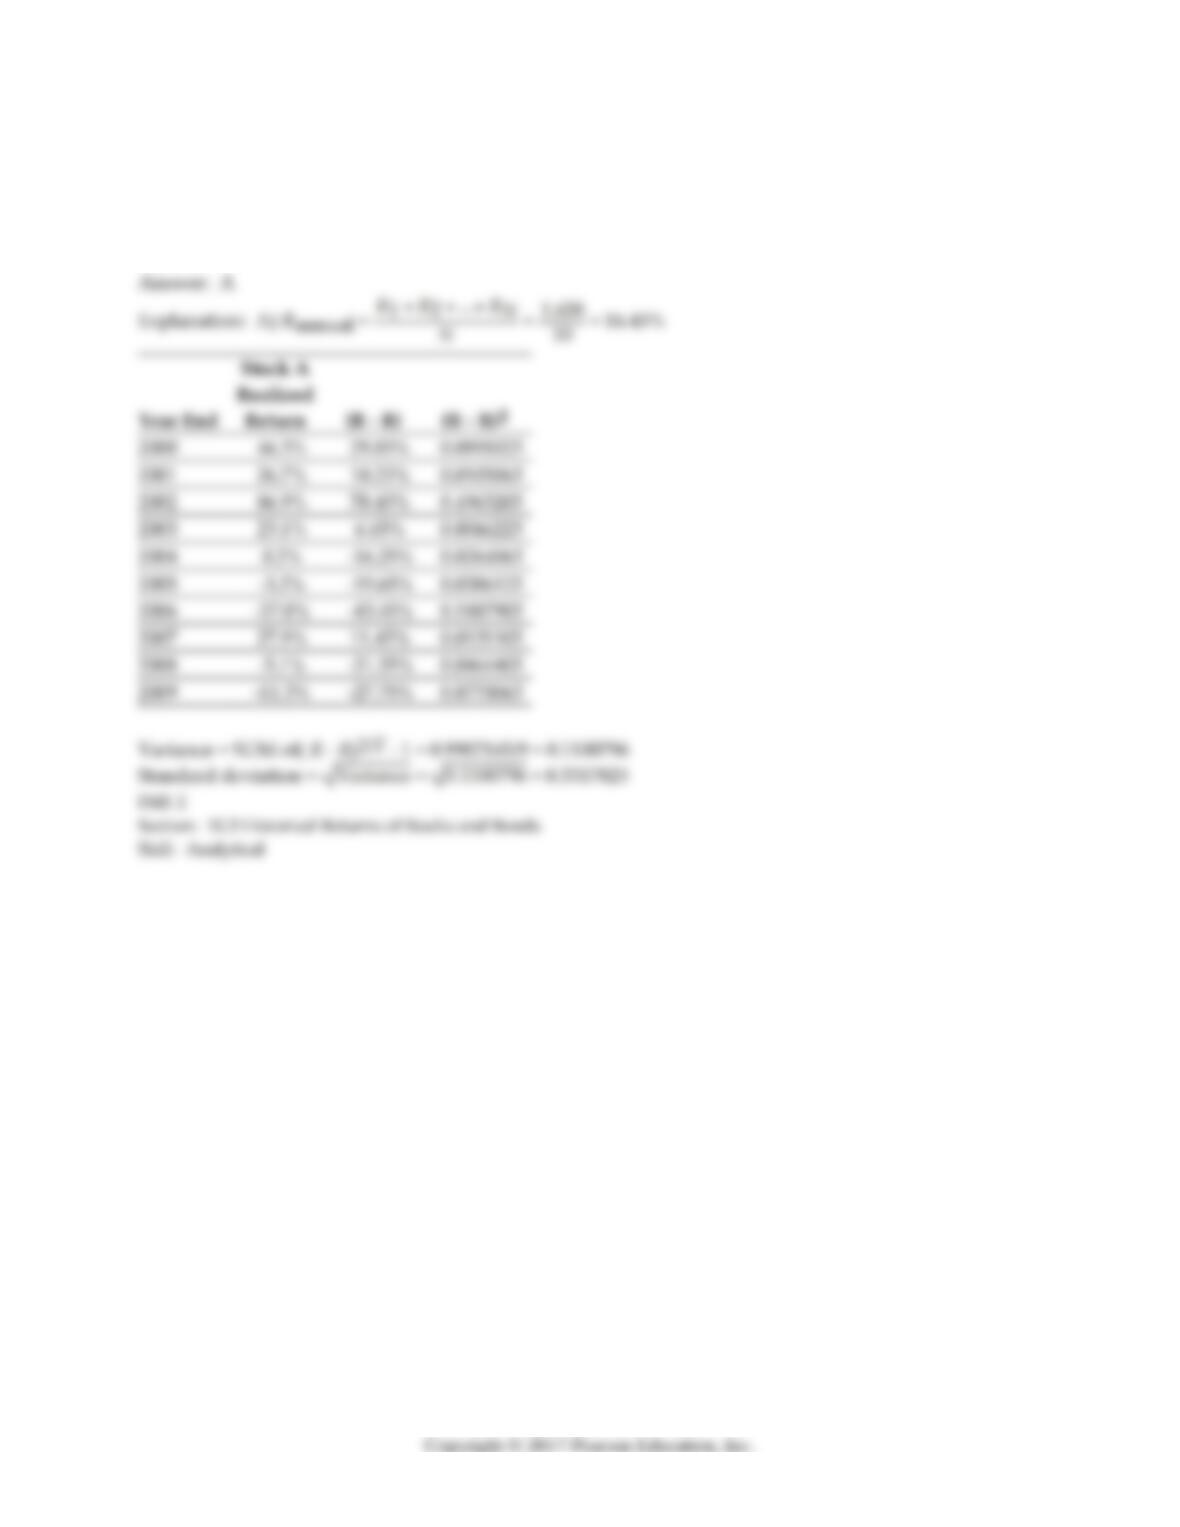
15) The standard deviation of the returns on Stock A from 2000 to 2009 is closest to:
A) 33.2%
B) 16.4%
C) 31.5%
D) 11.0%
14
16) Suppose that you want to use the 10 year historical average return on the Index to forecast the
expected future return on the Index. The standard error of your estimate of the expected return is
closest to:
A) 19.4%
B) 3.8%
C) 6.2%
D) 1.95%
15
17) Suppose that you want to use the 10 year historical average return on Stock A to forecast the
expected future return on Stock A. The standard error of your estimate of the expected return is closest
to:
A) 16.4%
B) 3.32%
C) 10.49%
D) 33.20%
16
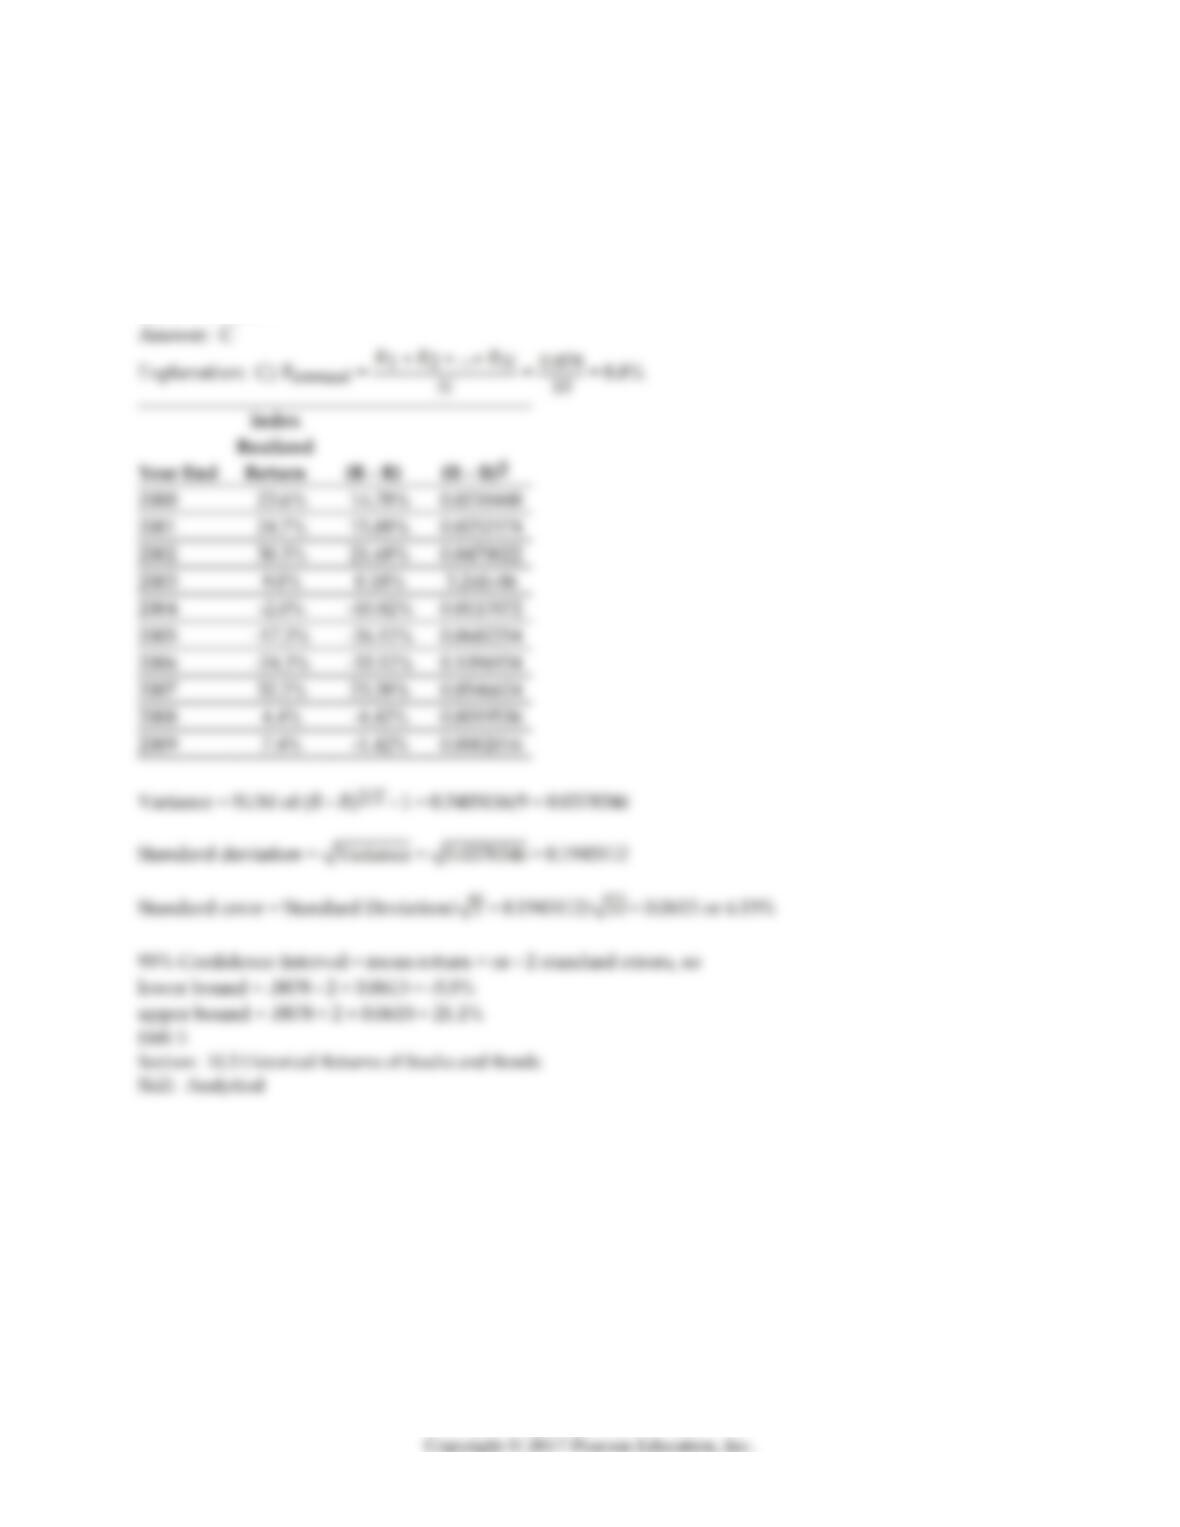
18) Suppose that you want to use the 10 year historical average return on the Index to forecast the
expected future return on the Index. The 95% confidence interval for your estimate of the expect return
is closest to:
A) -9.6% to 27.3%
B) 6.8% to 10.7%
C) -3.5% to 21.1%
D) 4.9% to 12.7%
17
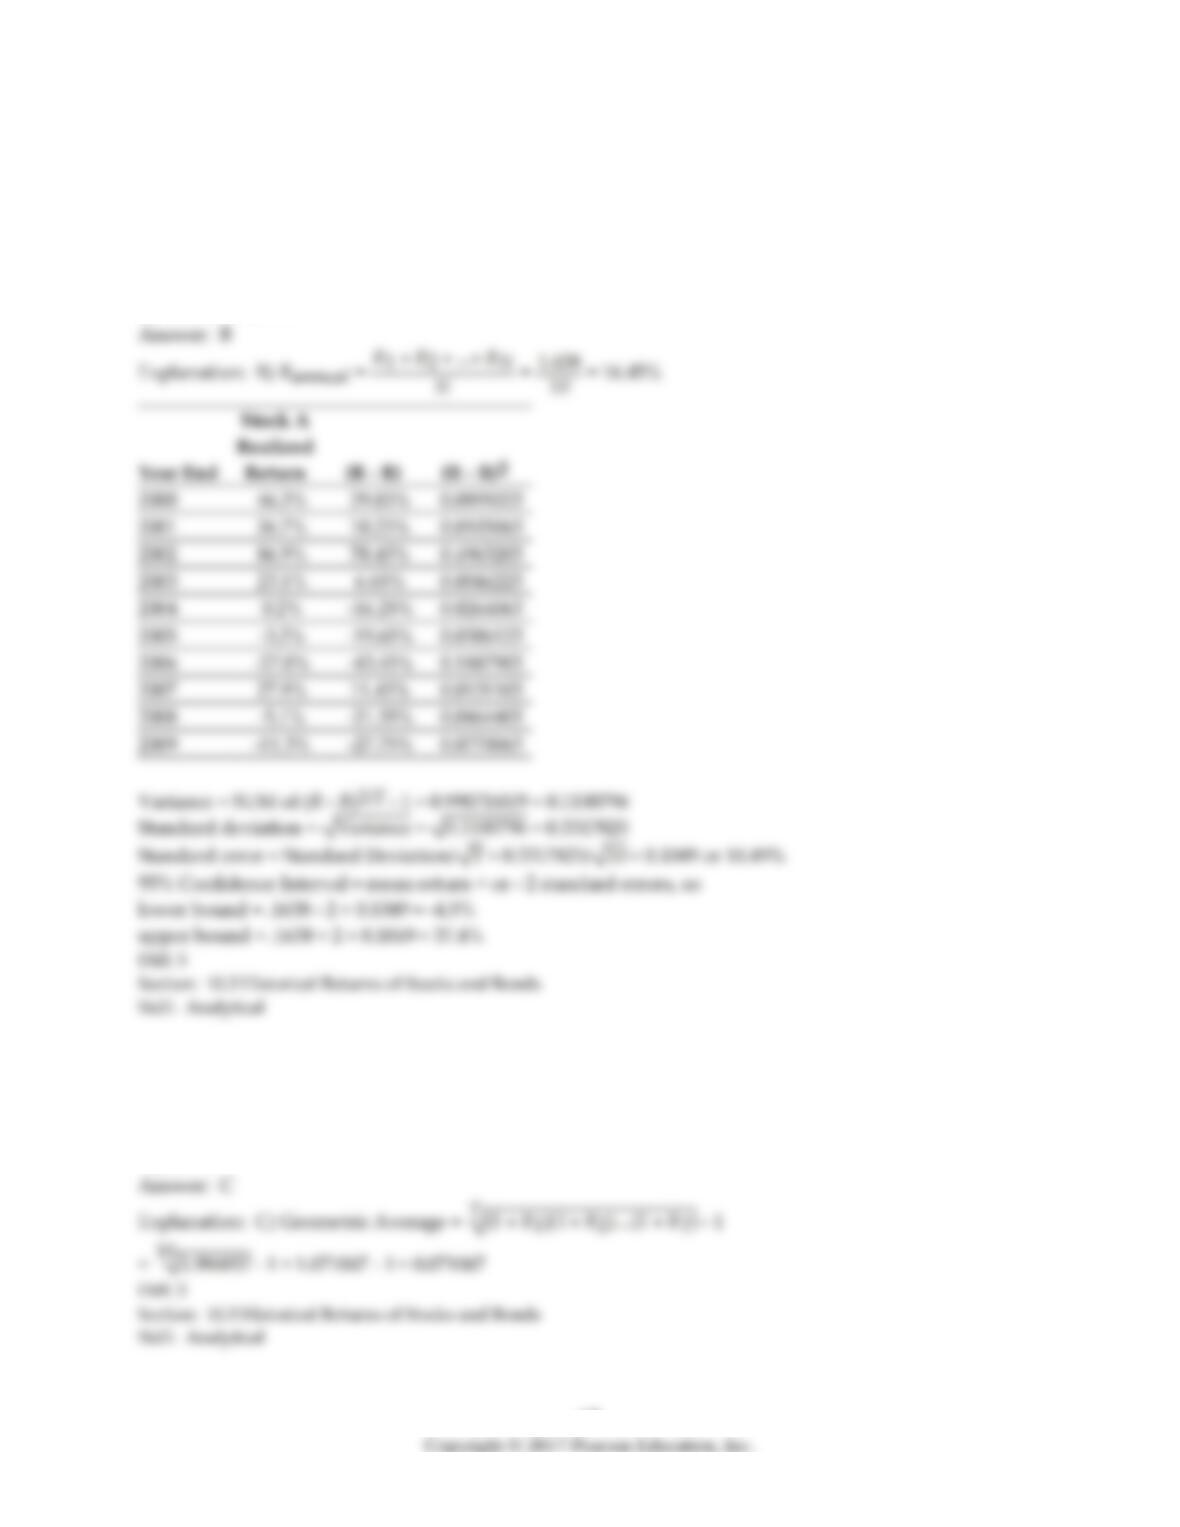
19) Suppose that you want to use the 10 year historical average return on Stock A to forecast the
expected future return on Stock A. The 95% confidence interval for your estimate of the expect return is
closest to:
A) 13.2% to 19.5%
B) -4.5% to 37.4%
C) 6.5% to 26.3%
D) -15.0% to 47.9%
20) The geometric average annual return on the Index from 2000 to 2009 is closest to:
A) 9.75%
B) 8.75%
C) 7.10%
D) 8.35%
21) The geometric average annual return on Stock A from 2000 to 2009 is closest to:
A) 12.4%
B) 16.7%
C) 13.2%
D) 17.8%
Use the table for the question(s) below.
Consider the following Price and Dividend data for J. P. Morgan Chase:
Date
Price ($)
Dividend ($)
December 31, 2008
$40.06
February 9, 2009
$36.80
$0.50
May 7, 2009
$30.41
$0.50
August 10, 2009
$34.86
$0.50
November 8, 2009
$25.86
$0.50
December 30, 2009
$18.86
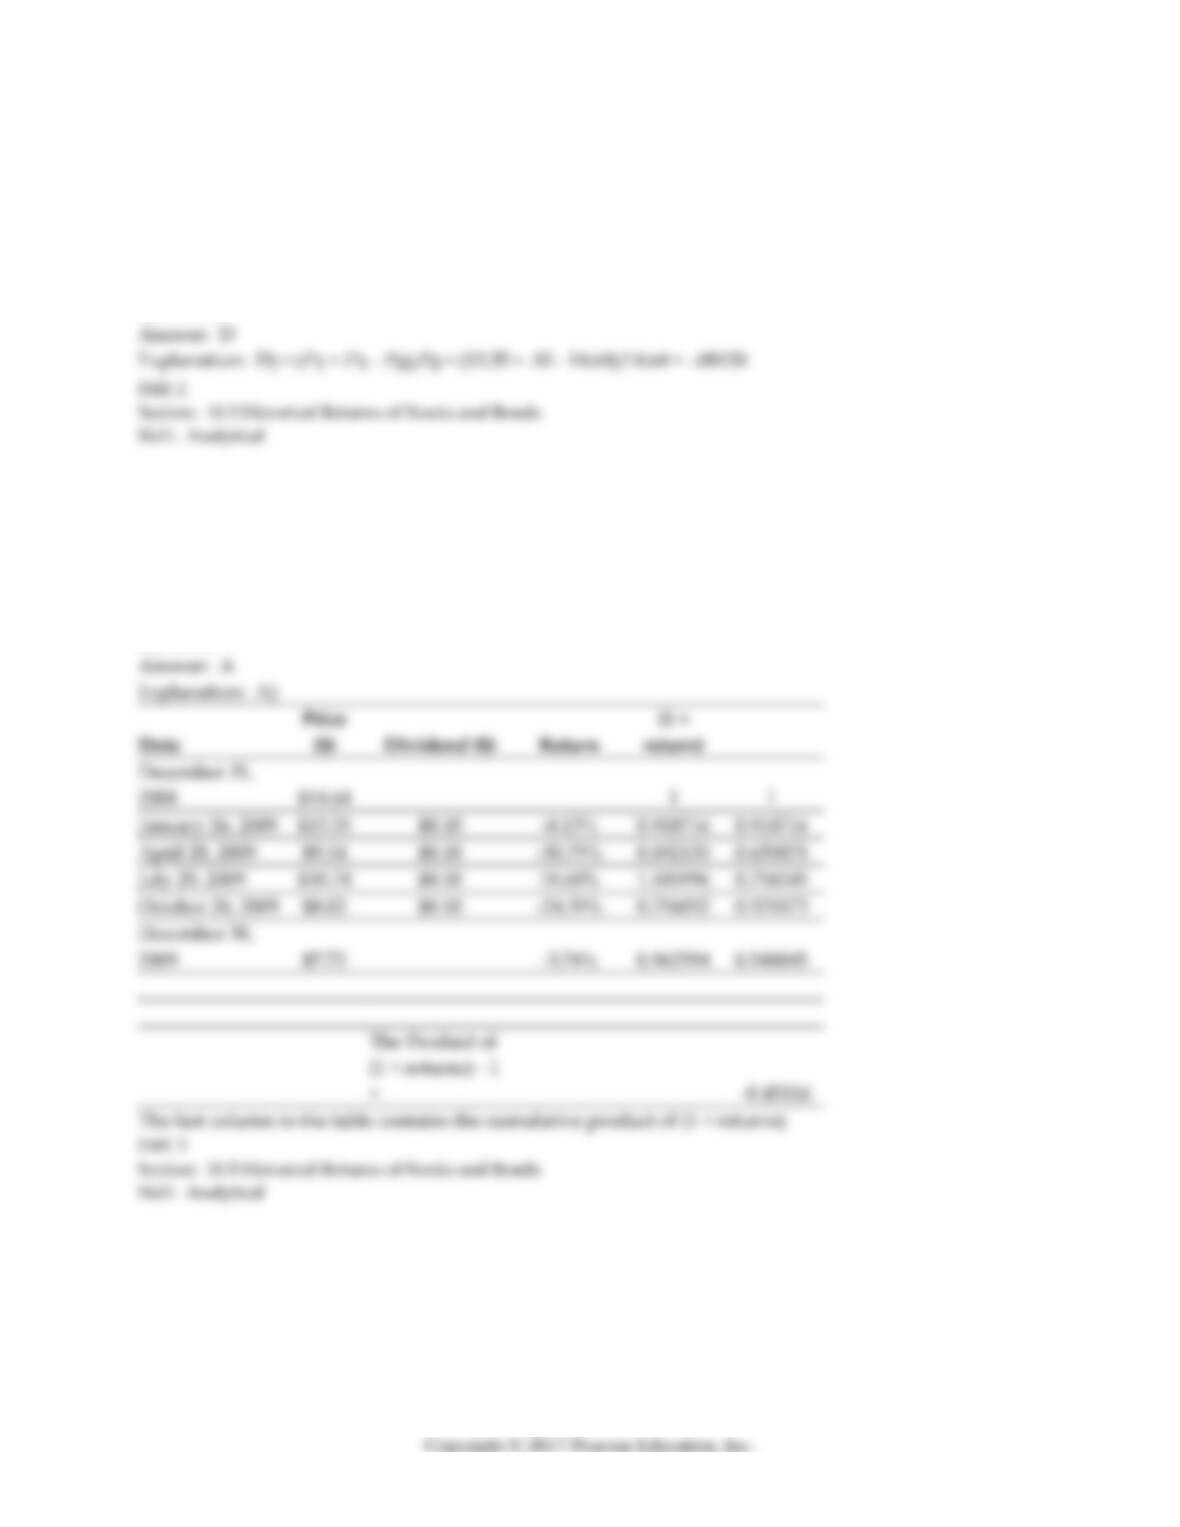
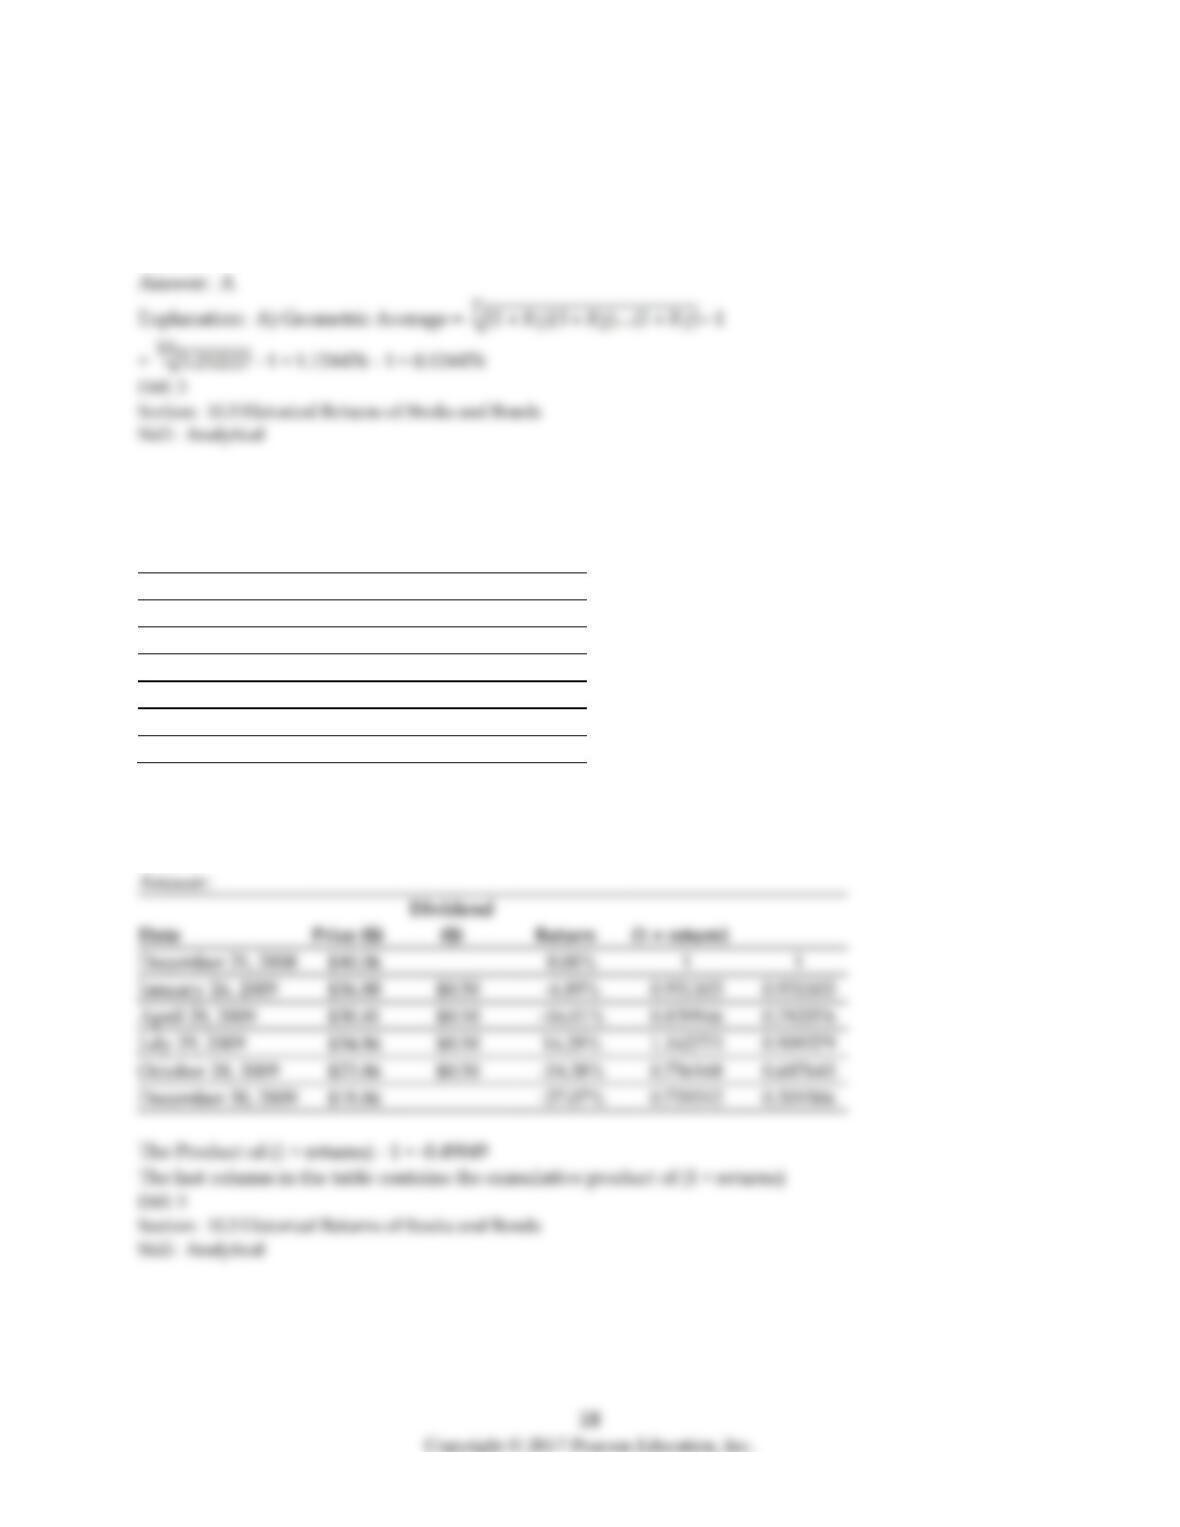
22) Assume that you purchased J. P. Morgan Chase stock at the closing price on December 31, 2008 and
sold it at the closing price on December 30, 2009. Calculate your realized annual return is for the year
2005.
Date
Price ($)
Return
(1 + return)
December 31, 2008
January 26, 2009
April 28, 2009
July 29, 2009
October 28, 2009
December 30, 2009
19
Use the table for the question(s) below.
Consider the following realized annual returns:
Year End
Market
Realized
Return
Stock B
Realized
Return
2000
21.2%
88.3%
2001
30.3%
56.4%
2002
22.3%
114.6%
2003
25.3%
68.4%
2004
-11.0%
-62.8%
2005
-11.3%
52.7%
2006
-20.8%
-22.0%
2007
33.1%
6.9%
2008
13.0%
9.2%
2009
7.3%
-0.9%
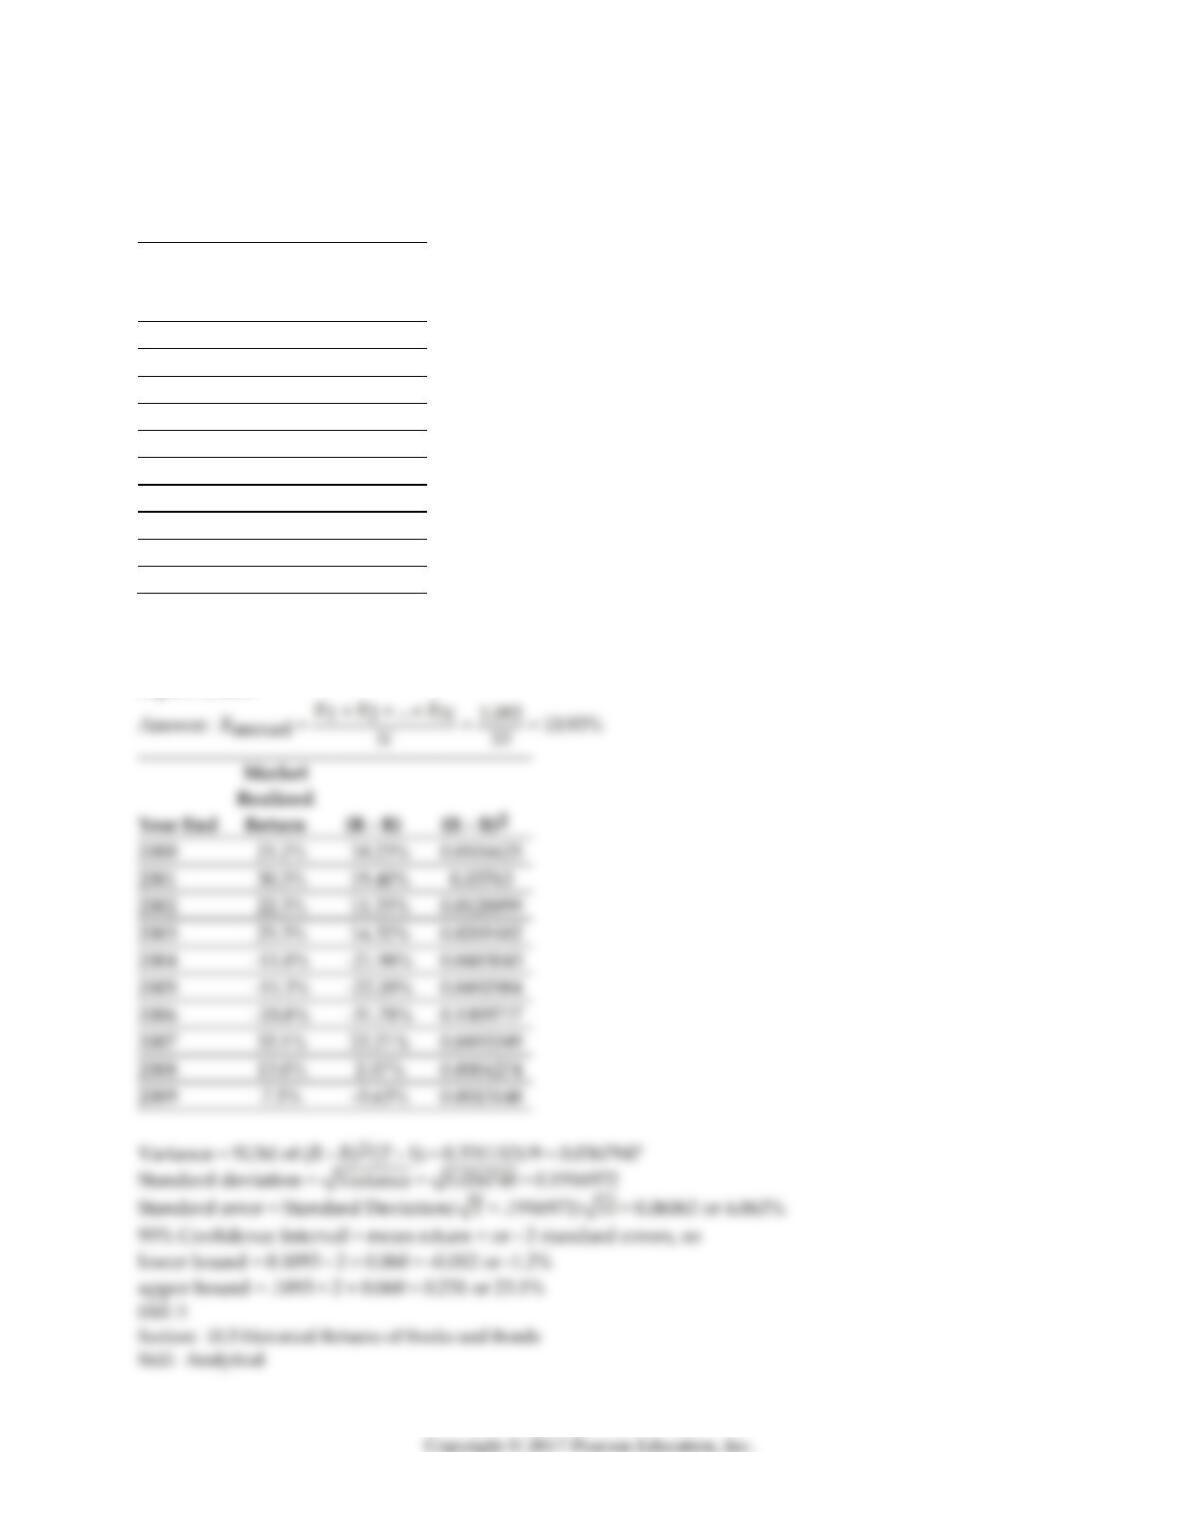
23) Suppose that you want to use the 10 year historical average return on the Market to forecast the
expected future return on the Market. Calculate the 95% confidence interval for your estimate of the
expect return.
Year End
Realized
Return
2000
21.2%
2001
30.3%
0.03763
2002
22.3%
2003
25.3%
2004
-11.0%
2005
-11.3%
2006
-20.8%
2007
33.1%
2008
13.0%
2009
-3.63%
20
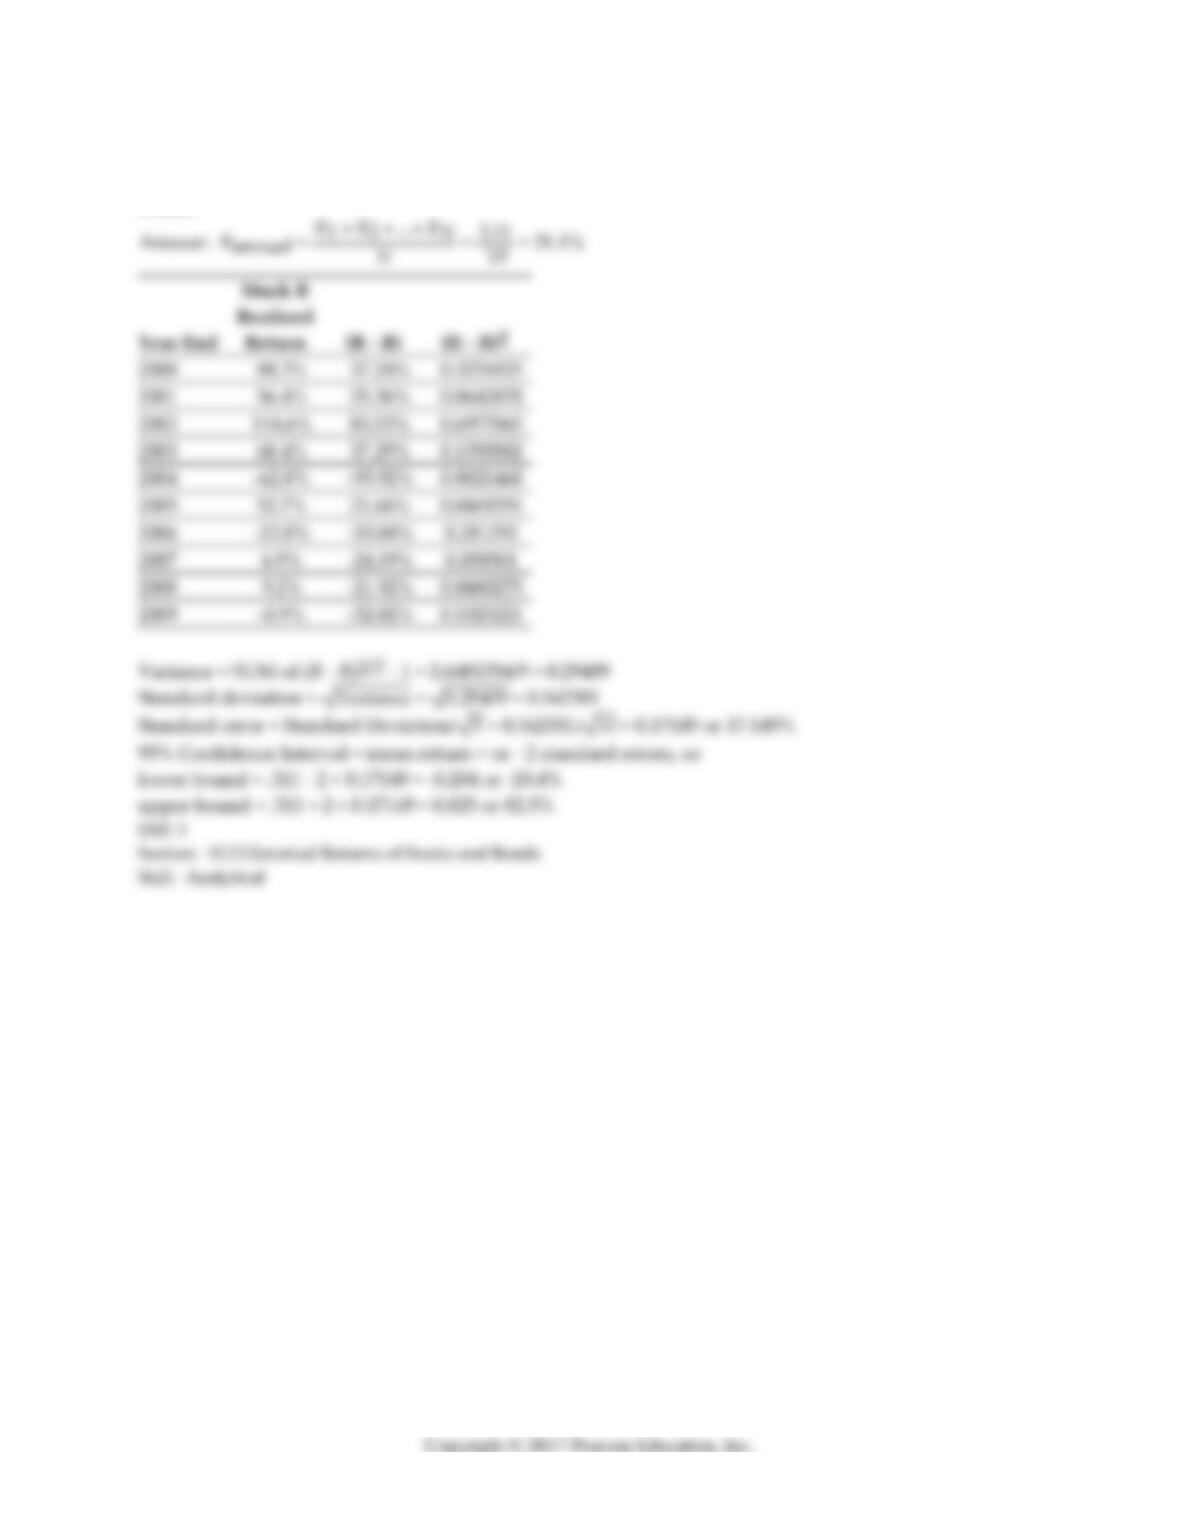
24) Suppose that you want to use the 10 year historical average return on Stock B to forecast the
expected future return on Stock B. Calculate the 95% confidence interval for your estimate of the expect
return.