36) Refer to the Ace Electronics annual report above. Using vertical analysis, 2012 Net income
would be represented as ________.
A) 28%
B) 26%
C) 18%
D) 15%
The following information is provided from EZ Electronics’ annual report for the years ended
December 31:
2012 2011 2010
Sales $120,000 $110,000 $100,000
Cost of goods sold 40,000 34,000 30,000
Gross profit 80,000 76,000 70,000
Operating expenses 48,000 42,000 40,000
Income before taxes 32,000 34,000 30,000
Income tax expense 9,600 10,200 9,000
Net income $ 22,400 $ 23,800 $ 21,000
37) Refer to the EZ Electronics annual report above. Using vertical analysis, 2010 sales would be
represented as ________.
A) 100%
B) 91%
C) 83%
D) 21%
38) Refer to the EZ Electronics annual report above. Using vertical analysis, 2010 cost of goods
sold would be represented as ________.
A) 100%
B) 30%
C) 43%
D) 143%
39) Refer to the EZ Electronics annual report above. Using vertical analysis, 2011 cost of goods
sold would be represented as ________.
A) 100%
B) 31%
C) 43%
D) 143%
40) Refer to the EZ Electronics annual report above. Using vertical analysis, 2012 cost of goods
sold would be represented as ________.
A) 100%
B) 31%
C) 43%
D) 33%
41) Refer to the EZ Electronics annual report above. Using vertical analysis, 2010 gross profit
would be represented as ________.
A) 100%
B) 30%
C) 70%
D) 143%
42) Refer to the EZ Electronics annual report above. Using vertical analysis, 2011 gross profit
would be represented as ________.
A) 100%
B) 76%
C) 145%
D) 69%
43) Refer to the EZ Electronics annual report above. Using vertical analysis, 2012 gross profit
would be represented as ________.
A) 67%
B) 150%
C) 40%
D) 80%
44) Refer to the EZ Electronics annual report above. Using vertical analysis, 2010 operating
expenses would be represented as ________.
A) 100%
B) 40%
C) 60%
D) 250%
45) Refer to the EZ Electronics annual report above. Using vertical analysis, 2011 operating
expenses would be represented as ________.
A) 38%
B) 42%
C) 176%
D) 262%
46) Refer to the EZ Electronics annual report above. Using vertical analysis, 2012 operating
expenses would be represented as ________.
A) 48%
B) 250%
C) 40%
D) 214%
47) Refer to the EZ Electronics annual report above. Using vertical analysis, 2010 income tax
expense would be represented as ________.
A) 100%
B) 9%
C) 30%
D) 43%
48) Refer to the EZ Electronics annual report above. Using vertical analysis, 2011 income tax
expense would be represented as ________.
A) 9%
B) 100%
C) 30%
D) 43%
49) Refer to the EZ Electronics annual report above. Using vertical analysis, 2012 income tax
expense would be represented as ________.
A) 19%
B) 100%
C) 30%
D) 8%
50) Refer to the EZ Electronics annual report above. Using vertical analysis, 2010 net income
would be represented as ________.
A) 19%
B) 100%
C) 21%
D) 22%
51) Refer to the EZ Electronics annual report above. Using vertical analysis, 2011 net income
would be represented as ________.
A) 19%
B) 100%
C) 20%
D) 22%
52) Refer to the EZ Electronics annual report above. Using vertical analysis, 2012 net income
would be represented as ________.
A) 19%
B) 100%
C) 21%
D) 22%
53) Owners’ contributions and dividends are reported as special items on income statements.
54) Horizontal analysis is a technique used to evaluate a series of financial statement data over a
period of time.
55) Vertical analysis is a technique used to evaluate a series of financial statement data over a
period of time.
56) In horizontal analysis, each item in a financial statement is expressed as a percentage of a
selected line on the statement.
57) In vertical analysis, each item in a financial statement is expressed as a percentage of a
selected line on the statement.
58) In horizontal analysis, each item on an income statement is expressed as a percentage of
sales.
59) In vertical analysis, each item on an income statement is expressed as a percentage of sales.
60) In horizontal analysis, each item on a balance sheet is expressed as a percentage of total
assets.
61) The notes to the financial statements are the last place to look for additional information
whenever an analysis reveals something interesting or suspicious.
62) What is vertical analysis?
63) What is horizontal analysis?
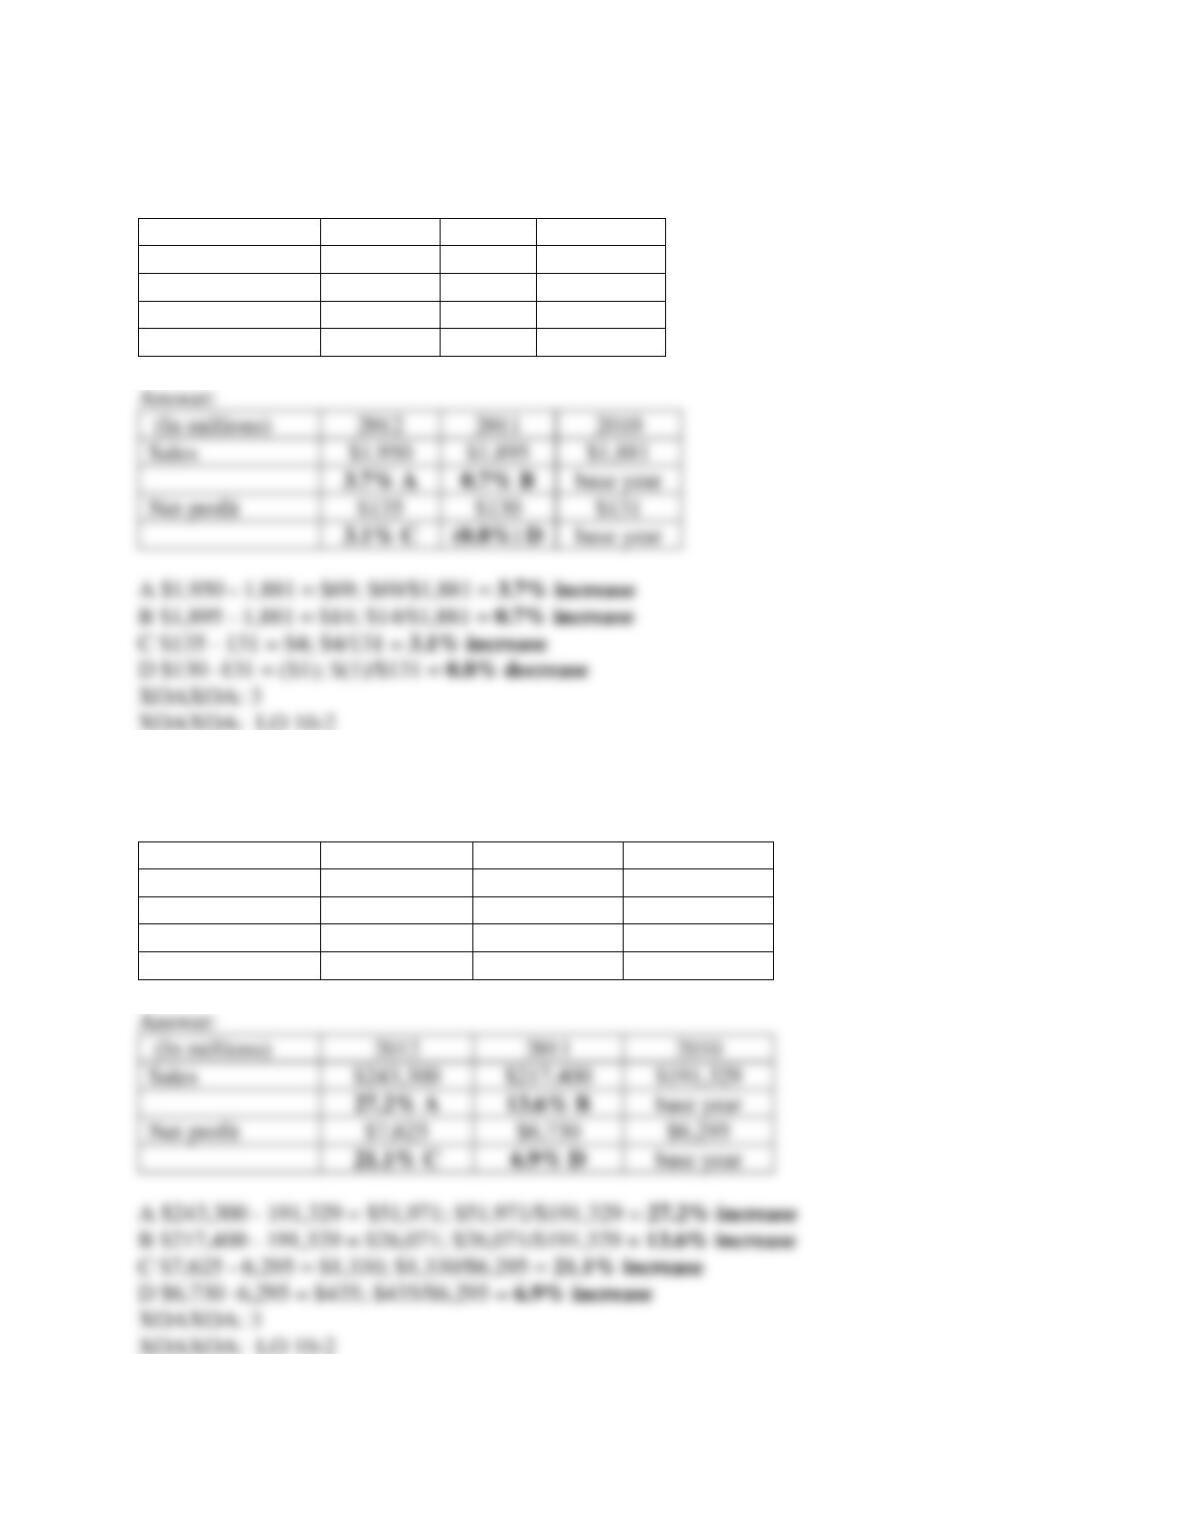
64) Use the Information below for Third World Company to complete the horizontal analysis for
sales and net profit for 2011 and 2012. Use 2010 as the base year.
(In millions)
2012
2011
2010
Sales
$1,950
$1,895
$1,881
base year
Net profit
$135
$130
$131
base year
65) Use the Information below for Wool Mart to complete the horizontal analysis for sales and
net profit for 2011 and 2012. Use 2010 as the base year.
(In millions)
2012
2011
2010
Sales
$243,300
$217,400
$191,329
base year
Net profit
$7,625
$6,730
$6,295
base year
(In millions)
2012
2011
2010
Sales
$243,300
$217,400
$191,329
base year
Net profit
$7,625
$6,730
$6,295
base year
66) Use the partial income statements below to complete a vertical analysis for Pep Boys for
(In millions)
2012
Sales
$1,950
$1,895
$1,881
Net profit
$135
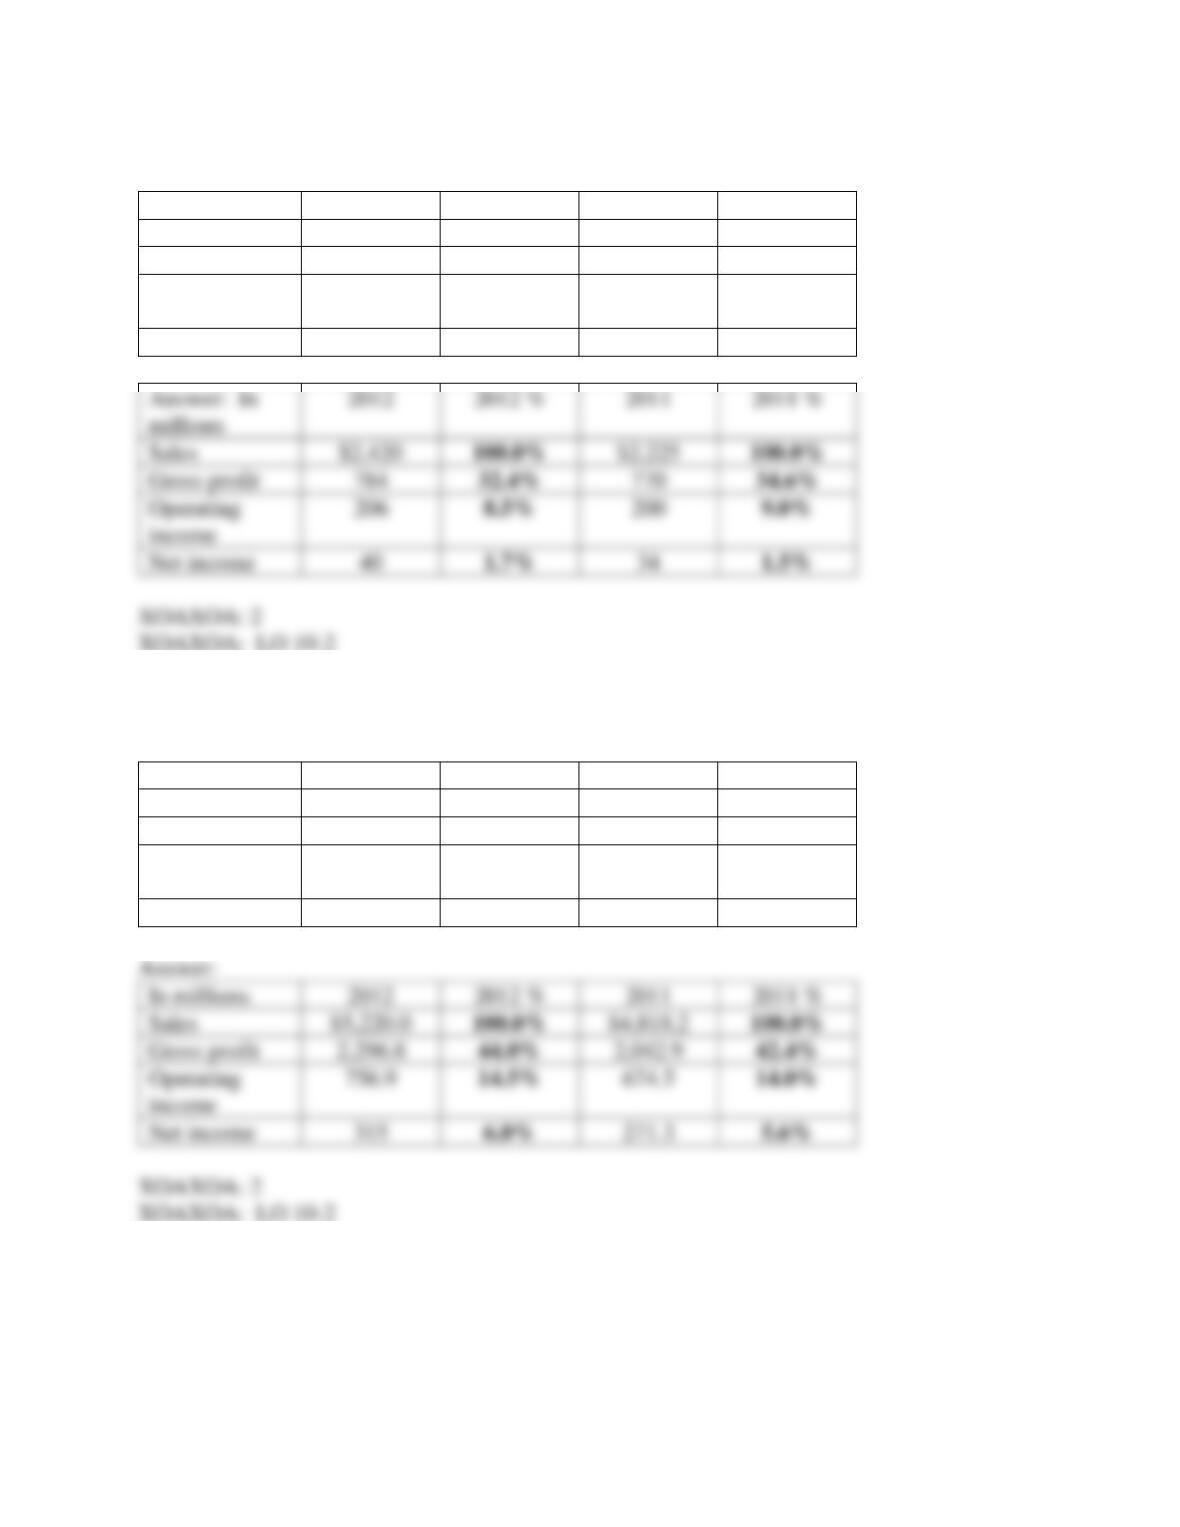
2011 and 2012.
In millions
2012
2012 %
2011
2011 %
Sales
$2,420
$2,225
Gross profit
784
770
Operating
income
206
200
Net income
40
34
67) Use the partial income statements below to complete a vertical analysis for Auto Zone for
2011 and 2012.
In millions
2012
2012 %
2011
2011 %
Sales
$5,220.0
$4,818.2
Gross profit
2,296.8
2,042.9
Operating
income
756.9
674.5
Net income
315
271.3
In millions
2012
2012 %
2011
2011 %
Sales
$5,220.0
$4,818.2
Gross profit
2,296.8
2,042.9
Operating
income
756.9
674.5
Net income
315
271.3
Answer: In
Sales
$2,420
$2,225
Gross profit
784
770
Operating
income
206
200
Net income
40
34
Learning Objective 10-3
1) A technique for using information from financial statements to formulate specific values to
determine some measure of a company’s financial position is called ________ analysis.
A) horizontal
B) vertical
C) time-series
D) ratio
2) Jack is comparing Team Shirts to Xtreme T’s. He found that the gross profit ratio was 47% for
Team Shirts and 50% for Xtreme T’s. This is an example of ________ analysis.
A) horizontal
B) vertical
C) time-series
D) ratio
3) Ratios used to determine whether or not a company can pay its bills on time are ________.
A) liquidity ratios
B) solvency ratios
C) profitability ratios
D) market indicators
4) Ratios used to determine whether or not a company can survive over a long period of time are
________.
A) liquidity ratios
B) solvency ratios
C) profitability ratios
D) market indicators
5) Ratios used to determine whether or not a company can earn a satisfactory rate of return are
________.
A) liquidity ratios
B) solvency ratios
C) profitability ratios
D) market indicators
6) Ratios used to determine whether or not a company’s stock is a good investment are
________.
A) liquidity ratios
B) solvency ratios
C) profitability ratios
D) market indicators
7) Liquidity ratios are used to determine whether or not a ________.
A) company’s stock is a good investment
B) company can earn a satisfactory rate of return
C) company can pay its bills on time
D) company can survive over a long period of time
8) The debt-to-equity ratio is used to determine whether or not a ________.
A) company’s stock is a good investment
B) company can earn a satisfactory rate of return
C) company can pay its bills on time
D) company can survive over a long period of time
9) Solvency ratios are used to determine whether or not a ________.
A) company’s stock is a good investment
B) company can earn a satisfactory rate of return
C) company can pay its bills on time
D) company can survive over a long period of time
10) Profitability ratios are used to determine whether or not a ________.
A) company’s stock is a good investment
B) company can earn a satisfactory rate of return
C) company can pay its bills on time
D) company can survive over a long period of time
11) The debt-to-equity ratio is a ________ ratio.
A) liquidity
B) solvency
C) profitability
D) market indicator
12) The current ratio is a ________ ratio.
A) liquidity
B) solvency
C) profitability
D) market indicator
13) The cash from operations to current liabilities ratio is a ________ ratio.
A) liquidity
B) solvency
C) profitability
D) market indicator
14) The return on assets ratio is a ________ ratio.
A) liquidity
B) solvency
C) profitability
D) market indicator
15) The price-earnings ratio is a ________ ratio.
A) liquidity
B) solvency
C) profitability
D) market indicator
16) Earnings per share is a ________ ratio.
A) liquidity
B) solvency
C) profitability
D) market indicator
17) The inventory turnover ratio is a ________ ratio.
A) liquidity
B) solvency
C) profitability
D) market indicator
18) The return on equity ratio is a ________ ratio.
A) liquidity
B) solvency
C) profitability
D) market indicator
19) The accounts receivable turnover ratio is a ________ ratio.
A) liquidity
B) solvency
C) profitability
D) market indicator

20) The asset turnover ratio is a ________ ratio.
A) liquidity
B) solvency
C) profitability
D) market indicator
21) The gross profit ratio is a ________ ratio.
A) liquidity
B) solvency
C) profitability
D) market indicator
22) The profit margin ratio is a ________ ratio.
A) liquidity
B) solvency
C) profitability
D) market indicator
23) The dividend yield ratio is a ________ ratio.
A) liquidity
B) solvency
C) profitability
D) market indicator
24) The dividend per share divided by the market price per share is called ________.
A) dividends per share
B) earnings per share
C) dividend yield
D) dividend payout ratio
25) Jack took the annual dividend of Team Shirts, which was $0.50 per share, and divided it by
the market price of $17 per share. This came to 2.9%, which is the ________.
A) dividend per share
B) earnings per share
C) dividend yield
D) dividend payout ratio
26) Which financial statement(s) do you need to calculate the current ratio?
A) only the income statement
B) only the balance sheet
C) both the income statement and the balance sheet
D) both the statement of cash flows and the income statement
27) Which financial statement(s) do you need to calculate the cash from operations to current
liabilities ratio?
A) only the income statement
B) both the statement of cash flows and the balance sheet
C) both the income statement and the balance sheet
D) both the statement of cash flows and the income statement
28) Which financial statement(s) do you need to calculate the inventory turnover ratio?
A) only the income statement
B) only the balance sheet
C) both the income statement and the balance sheet
D) both the statement of cash flows and the income statement
29) Which financial statement(s) do you need to calculate the accounts receivable turnover ratio?
A) only the income statement
B) only the balance sheet
C) both the income statement and the balance sheet
D) both the statement of cash flows and the income statement
30) Which financial statement(s) do you need to calculate the debt-to-equity ratio?
A) only the income statement
B) only the balance sheet
C) both the income statement and the balance sheet
D) both the statement of cash flows and the income statement
31) Which financial statement(s) do you need to calculate the profit margin ratio?
A) only the income statement
B) only the balance sheet
C) both the income statement and the balance sheet
D) both the statement of cash flows and the income statement
32) Which financial statement(s) do you need to calculate the return on assets?
A) only the income statement
B) only the balance sheet
C) both the income statement and the balance sheet
D) both the statement of cash flows and the income statement
33) Which financial statement(s) do you need to calculate the asset turnover ratio?
A) only the income statement
B) only the balance sheet
C) both the income statement and the balance sheet
D) both the statement of cash flows and the income statement
34) Which financial statement(s) do you need to calculate return on equity?
A) only the income statement
B) only the balance sheet
C) both the income statement and the balance sheet
D) the income statement, the balance sheet, and the statement of cash flows
35) Which financial statement(s) do you need to calculate the gross profit ratio?
A) only the income statement
B) only the balance sheet
C) both the income statement and the balance sheet
D) both the statement of cash flows and the income statement
The following information is from Megabux, Inc.’s annual report for the years ended December
31:
2012 2011 2010
Sales $120,000 $110,000 $100,000
Cost of goods sold 58,000 52,000 46,000
Operating expenses 48,000 44,000 42,000
Interest expense 12,000 9,000 6,000
Net income $ 2,000 $ 5,000 $ 6,000
36) Refer to the Megabux annual report above. This information is from Megabux Inc.’s
________.
A) income statement
B) balance sheet
C) statement of cash flows
D) statement of changes in shareholders’ equity
37) Refer to the Megabux annual report above. Calculate the gross profit ratio for 2010.
A) 46%
B) 42%
C) 54%
D) 6%
38) Refer to the Megabux annual report above. Calculate the gross profit ratio for 2011.
A) 58.0%
B) 52.7%
C) 47.3%
D) 4.5%
39) Refer to the Megabux annual report above. Calculate the gross profit ratio for 2012.
A) 1.7%
B) 48.3%
C) 62.0%
D) 51.7%
40) Refer to the Megabux annual report above. Which of the following explains the change in
the gross profit ratio over the three-year period?
A) Foreign competition has made it difficult to sell as many products as Megabux sold in the
past.
B) Megabux has raised its selling price per unit.
C) Suppliers may have raised the prices that Megabux must pay for the goods that it sells, but
Megabux has not passed the higher costs on to its customers with higher selling prices.
D) This is a trick question. The gross profit ratio has not changed over the three-year period.
41) Refer to the Megabux annual report above. Calculate the profit margin ratio for 2010.
A) 6%
B) 54%
C) 16.7%
D) 1.8%
42) Refer to the Megabux annual report above. Calculate the profit margin ratio for 2011.
A) 5.0%
B) 4.5%
C) 22%
D) 11%
43) Refer to the Megabux annual report above. Calculate the profit margin ratio for 2012.
A) 2.0%
B) 1.7%
C) 60.0%
D) 51.7%
44) Refer to the Megabux annual report above. Which of the following describes the trend in the
profit margin ratio for the three-year period?
A) The ratio is getting worse because expenses are growing faster than sales.
B) The ratio is getting worse because Megabux has increased its selling prices.
C) The increase in sales each year is more than enough to cover the increase in expenses.
D) There is no significant change in the ratio over the three years.
The following information is from Acme’s annual report for the years ended Dec. 31:
2012 2011 2010
Cash 2,500 2,000 1,000
Accounts receivable 5,000 3,000 2,000
Inventory 9,000 5,000 3,000
Property, plant & equipment 30,000 16,000 10,000
Accounts payable 6,000 4,500 3,500
Long-term liabilities 10,000 3,000 2,000
Common stock 2,000 2,000 2,000
Retained earnings 28,500 16,500 8,500
45) Refer to the Acme annual report above. This information is from Acme’s ________.
A) income statement
B) balance sheet
C) statement of cash flows
D) statement of changes in shareholders’ equity

46) Refer to the Acme annual report above. Calculate the current ratio for 2010.
A) 0.3
B) 0.9
C) 1.7
D) 2.9
47) Refer to the Acme annual report above. Calculate the current ratio for 2011.
A) 0.4
B) 1.1
C) 2.2
D) 3.5
48) Refer to the Acme annual report above. Calculate the current ratio for 2012.
A) 2.8
B) 1.0
C) 2.9
D) 1.3
49) Refer to the Acme annual report above. Calculate the debt-to-equity ratio for 2010.
A) 0.52
B) 2.75
C) 1.52
D) 8.00
50) Refer to the Acme annual report above. Calculate the debt-to-equity ratio for 2011.
A) 0.24
B) 0.41
C) 3.75
D) 2.25
51) Refer to the Acme annual report above. Calculate the debt-to-equity ratio for 2012.
A) 8.00
B) 3.00
C) 0.52
D) 0.20
52) Refer to the Acme annual report above. Calculate the return on equity for 2010.
A) 57.1%
B) 41.4%
C) 300%
D) The answer cannot be determined from the information given.
53) Refer to the Acme annual report above. Calculate return on equity for 2011.
A) 43.2%
B) 55.2%
C) 32.7%
D) The answer cannot be determined from the information given.