Risk, Return, and Portfolio Theory 8 – 52
109. Discuss the validity of the following statement: “diversification benefits decreased
because correlation between stocks increased.”
110. Suppose you are given the following information on The Doc & Company:
Year Opening Price Dividend Closing Price
2009 $53.48 $5.00 $54.90
2010 $54.90 $5.50 $63.12
2011 $63.12 $6.00 $41.34
2012 $41.34 $6.50 $47.24
2013 $47.24 $7.00 $49.69
a) Calculate the total annual returns for each one of the five years
b) Calculate the arithmetic average annual return
c) Calculate the geometric average annual return
d) Calculate the variance of annual returns
e) Calculate the standard deviation of annual returns
111. Suppose you are given the following forecasts for the economy and Sneezy
Company at the beginning of the year:
State of the Economy Probability of Occurrence Expected Return
Expansion 20% 20%
Normal 60% 12%
Recession 20% –10%
During the year, you observed the following:
Quarter Opening Price Dividend Closing Price
January – March $14.72 $0.50 $15.32
April – June $15.32 $0.50 $16.50
July – September $16.50 $0.50 $16.18
October – December $16.18 $0.50 $16.76
a) Calculate the ex-ante expected return
b) Calculate the ex-ante standard deviation of returns
c) Calculate the ex-post average return
d) Calculate the ex-post standard deviation of returns
112. Suppose you have $20,000 to invest in two securities: Spot and Dot. After you
have done an extensive analysis of the economy and the two securities, you have the
following forecasts:
State of the
Economy Probability of
Occurrence Spot
Expected Return Dot
Expected Return
Boom 15% –6% 35%
Normal 60% 12% 20%
Bust 25% 18% –10%
a) What are the expected returns on Spot and Dot?
b) What are the standard deviations of the returns on Spot and Dot?
c) What is the covariance of the returns on Spot and Dot?
d) What is the correlation between Spot and Dot?
e) What is the composition of the portfolio if you wish to have an expected return of 12
percent on the portfolio?
f) What is the standard deviation of the portfolio?
8 – 55 Test Bank for Introduction to Corporate Finance, Fourth Canadian Edition
113. Christopher Robin purchased 500 shares of Pooh Inc. at $48 per share and 1,000
shares of Piglet Inc. at $35 per share one year ago. Pooh and Piglet paid quarterly
dividends of $0.80 and $0.50 per share, respectively, during the year. One year later, he
sold both securities at $45 per share. The two securities have a correlation of 0.6, and
the standard deviations of Pooh and Piglet are 15 percent and 12 percent, respectively.
Risk, Return, and Portfolio Theory 8 – 56
a) What fraction of Christopher Robin’s portfolio is invested in Pooh? What fraction is
invested in Piglet?
b) What are the income yields of Pooh, Piglet, and the portfolio?
c) What are the capital gain yields of Pooh, Piglet, and the portfolio?
d) What are the total returns of Pooh, Piglet, and the portfolio?
e) What is the standard deviation of the portfolio?
Answer:
114. Suppose you plan to create a portfolio with two securities: Tobin and Bino, with
weights to be greater than or equal to zero. The expected return of Tobin is 10 percent
8 – 57 Test Bank for Introduction to Corporate Finance, Fourth Canadian Edition
with a standard deviation of 12 percent. The expected return of Bino is 16 percent with
a standard deviation of 20 percent. The correlation between the two securities is 0.30.
a) What percentage of your investment should be invested in Tobin to obtain a portfolio
standard deviation of 12.2638 percent?
b) What is the expected return of the portfolio?
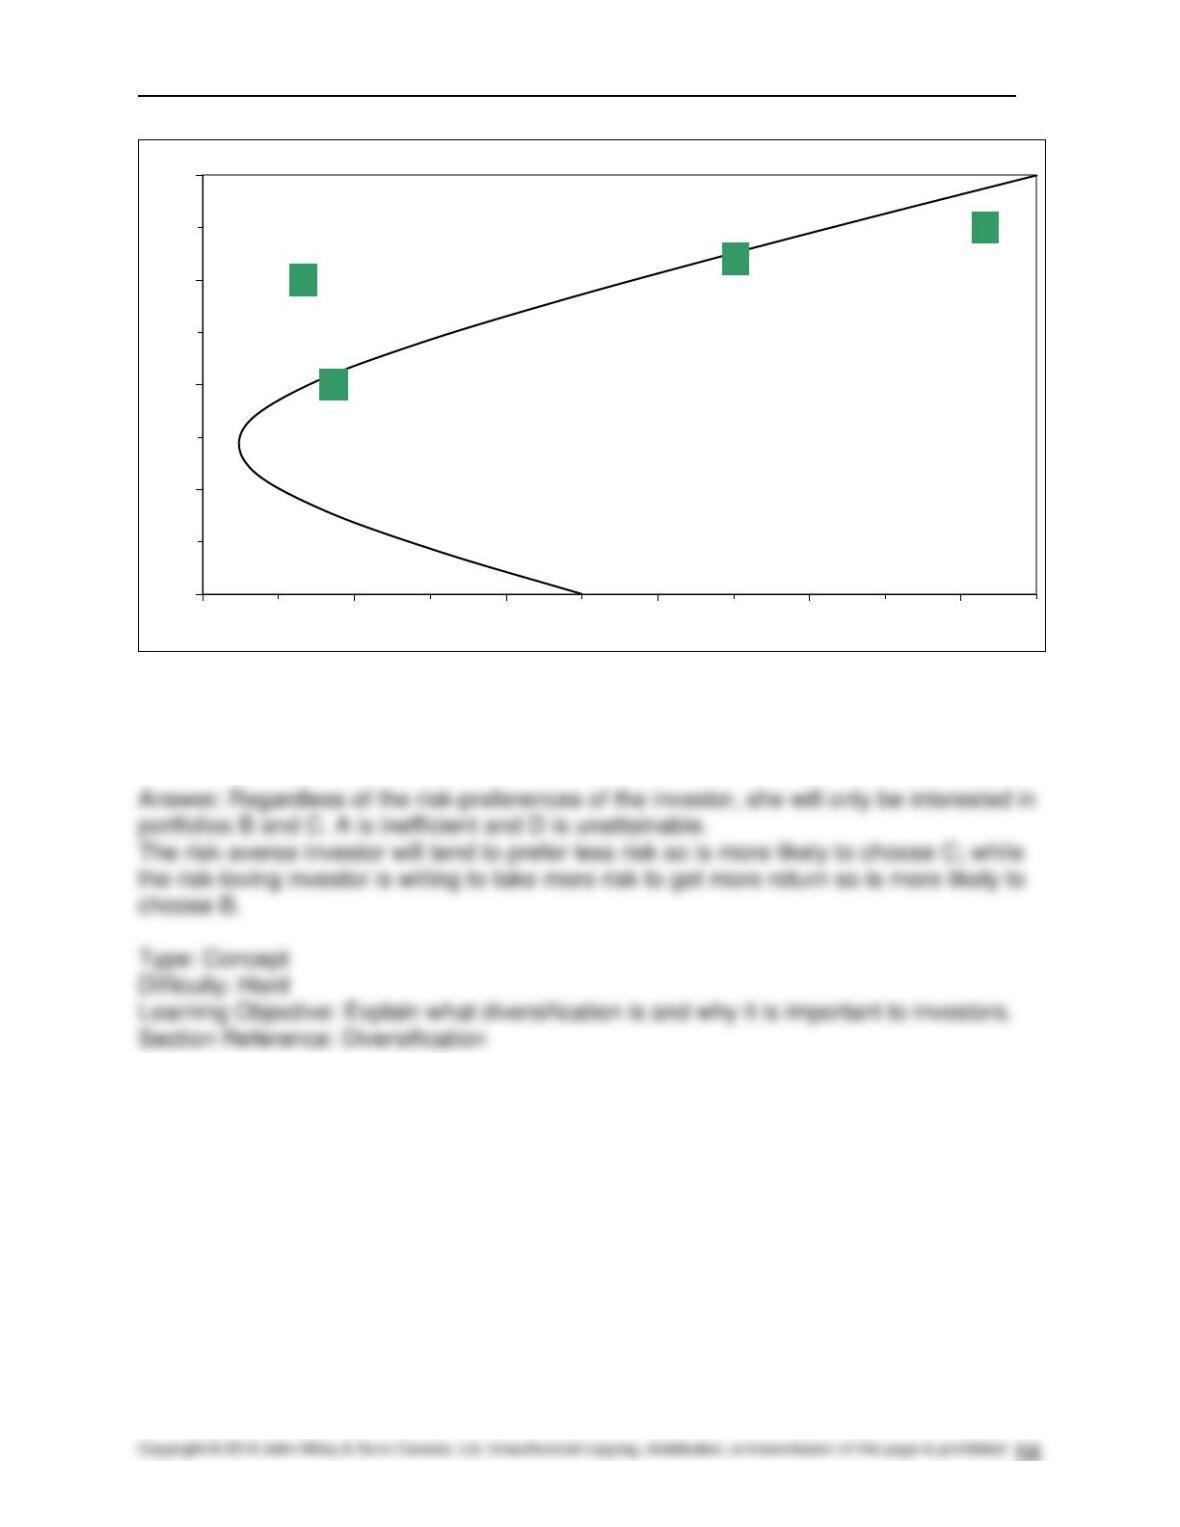
115. The standard deviation and expected returns for 4 portfolios (A, B, C, and D) are
graphed on the following efficient frontier:
Risk, Return, and Portfolio Theory 8 – 58
Which of the following portfolios (or combinations) are likely to be preferred by a risk–
averse investor? Which of the following portfolios (or combinations) are likely to be
preferred by a risk-loving investor? Explain your reasoning.
A
B
C
D
Expected return
Standard deviation
116. Risk-Return in a Portfolio Question:
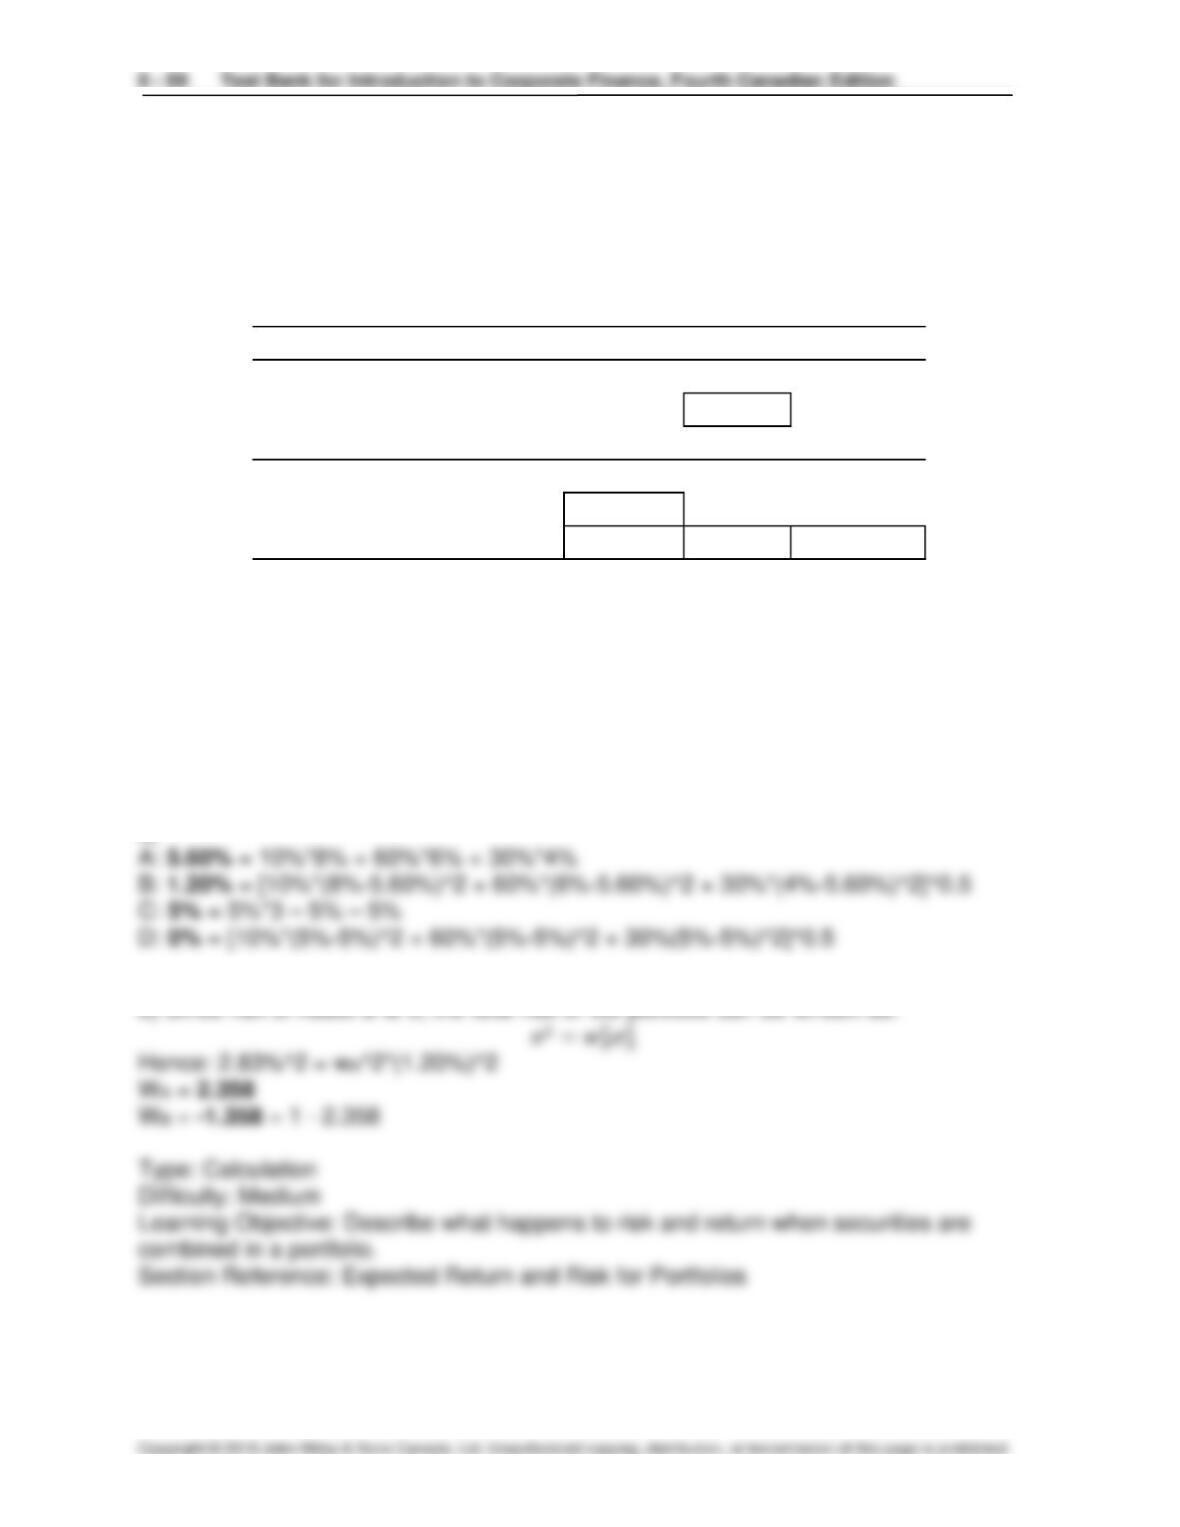
The following table presents some statistics about the returns of three assets, Assets A,
B, and C, respectively, under three possible scenarios (Boom, Normal, and Recession).
The expected probabilities of each state are also specified in the table.
a) Complete the blanks in the above table. Show your calculations.
b) Suppose you wish to combine Assets A and B in order to create a portfolio that has
the same total risk as Asset C. What weight should you invest in Asset A? In Asset B?
What would be the expected return of the portfolio made of A and B?
Answer:
a)
Scenario Probability Asset A Asset B Asset C
Boom 10% 8% 5% 6%
Normal 60% 6% C) 5%
Recession 30% 4% 5% -1%
A) 5.00% 3.30%
B) D) 2.83%
Expected return
Standard deviation
117. Richards & Co. Analysts has recently published a study claiming that the benefits
to diversification are constant. In other words, adding one more stock to a three stock
portfolio will have the same impact as adding one more stock to a 500‐stock portfolio.
You are not convinced and you decide to evaluate the claim.
a . Assume that all the stocks have the same standard deviation, 10 percent, and all are
independent (correlation equals 0.0). Create equally weighted portfolios of 1 to 10
stocks and calculate the standard deviation for each portfolio. Graph the portfolio
standard deviation as a function of the number of stocks. Based on the results of your
analysis, evaluate the Richard & Co. Analysts ’ claim.
b . As the number of firms increases, what do you expect will happen to the risk of the
portfolio? Can the risk of the portfolio come close to zero?
Answer:
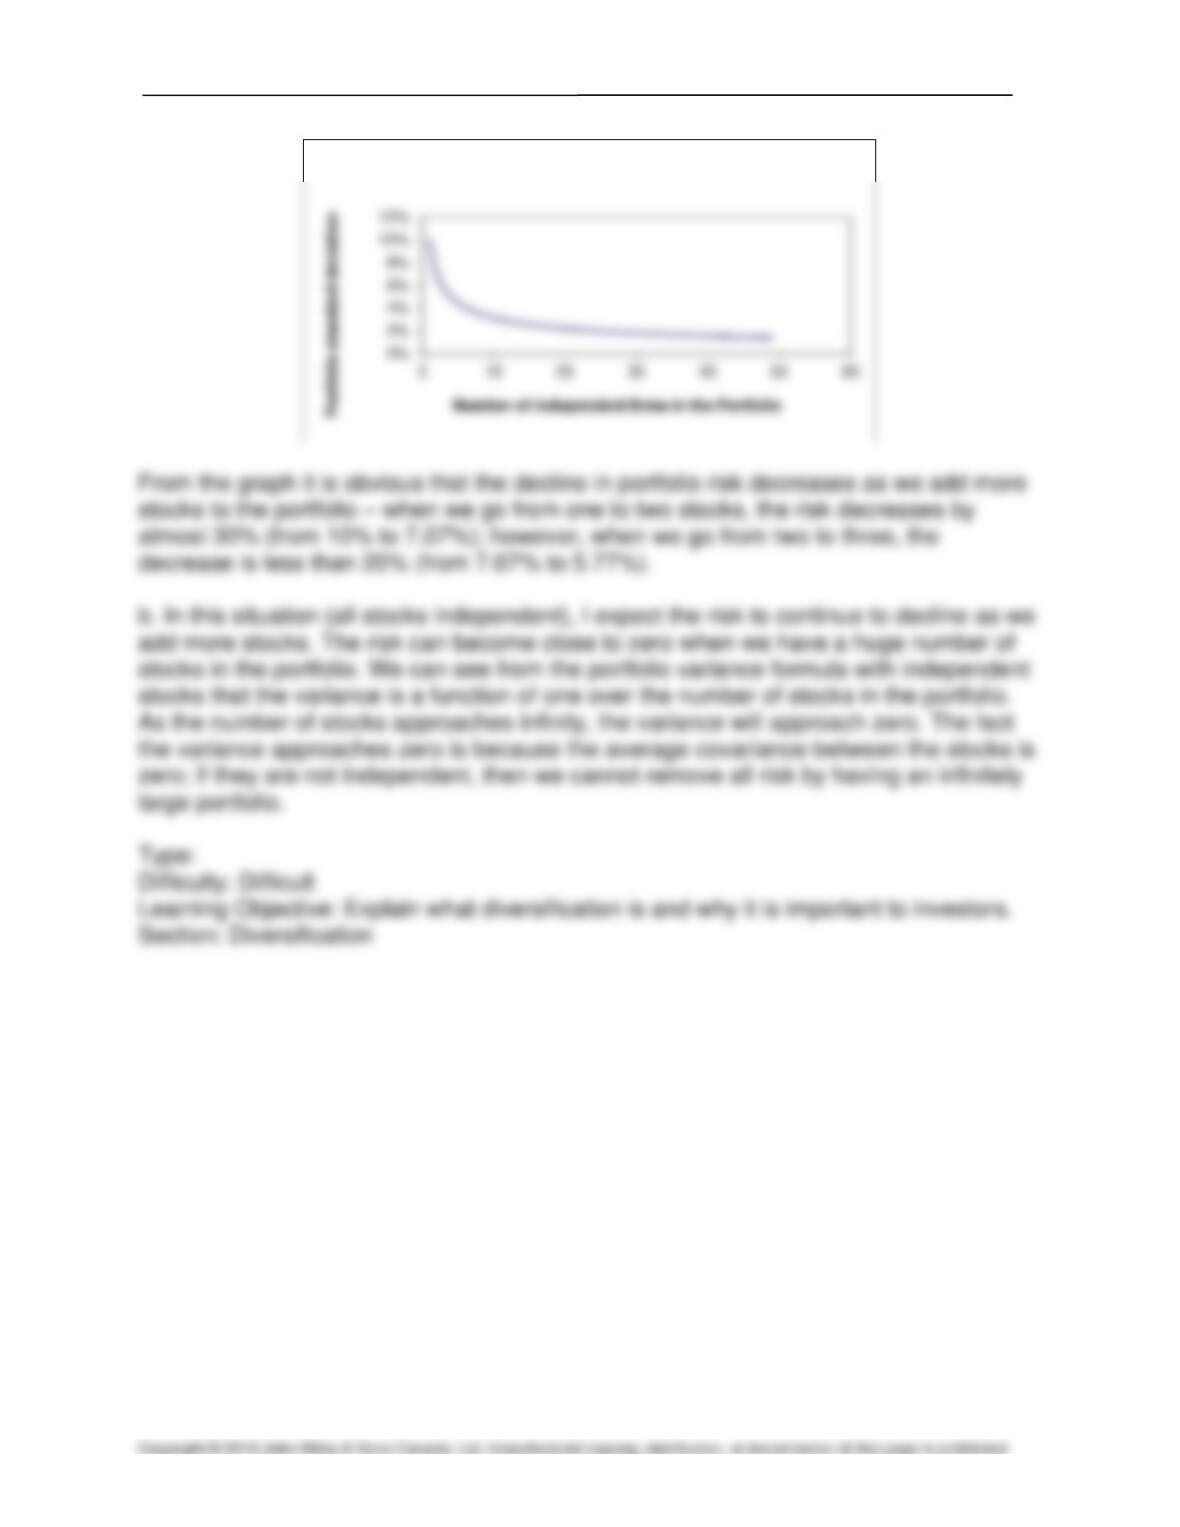
a. Sample data from Excel:
The formulas used:
Row
8 – 61 Test Bank for Introduction to Corporate Finance, Fourth Canadian Edition
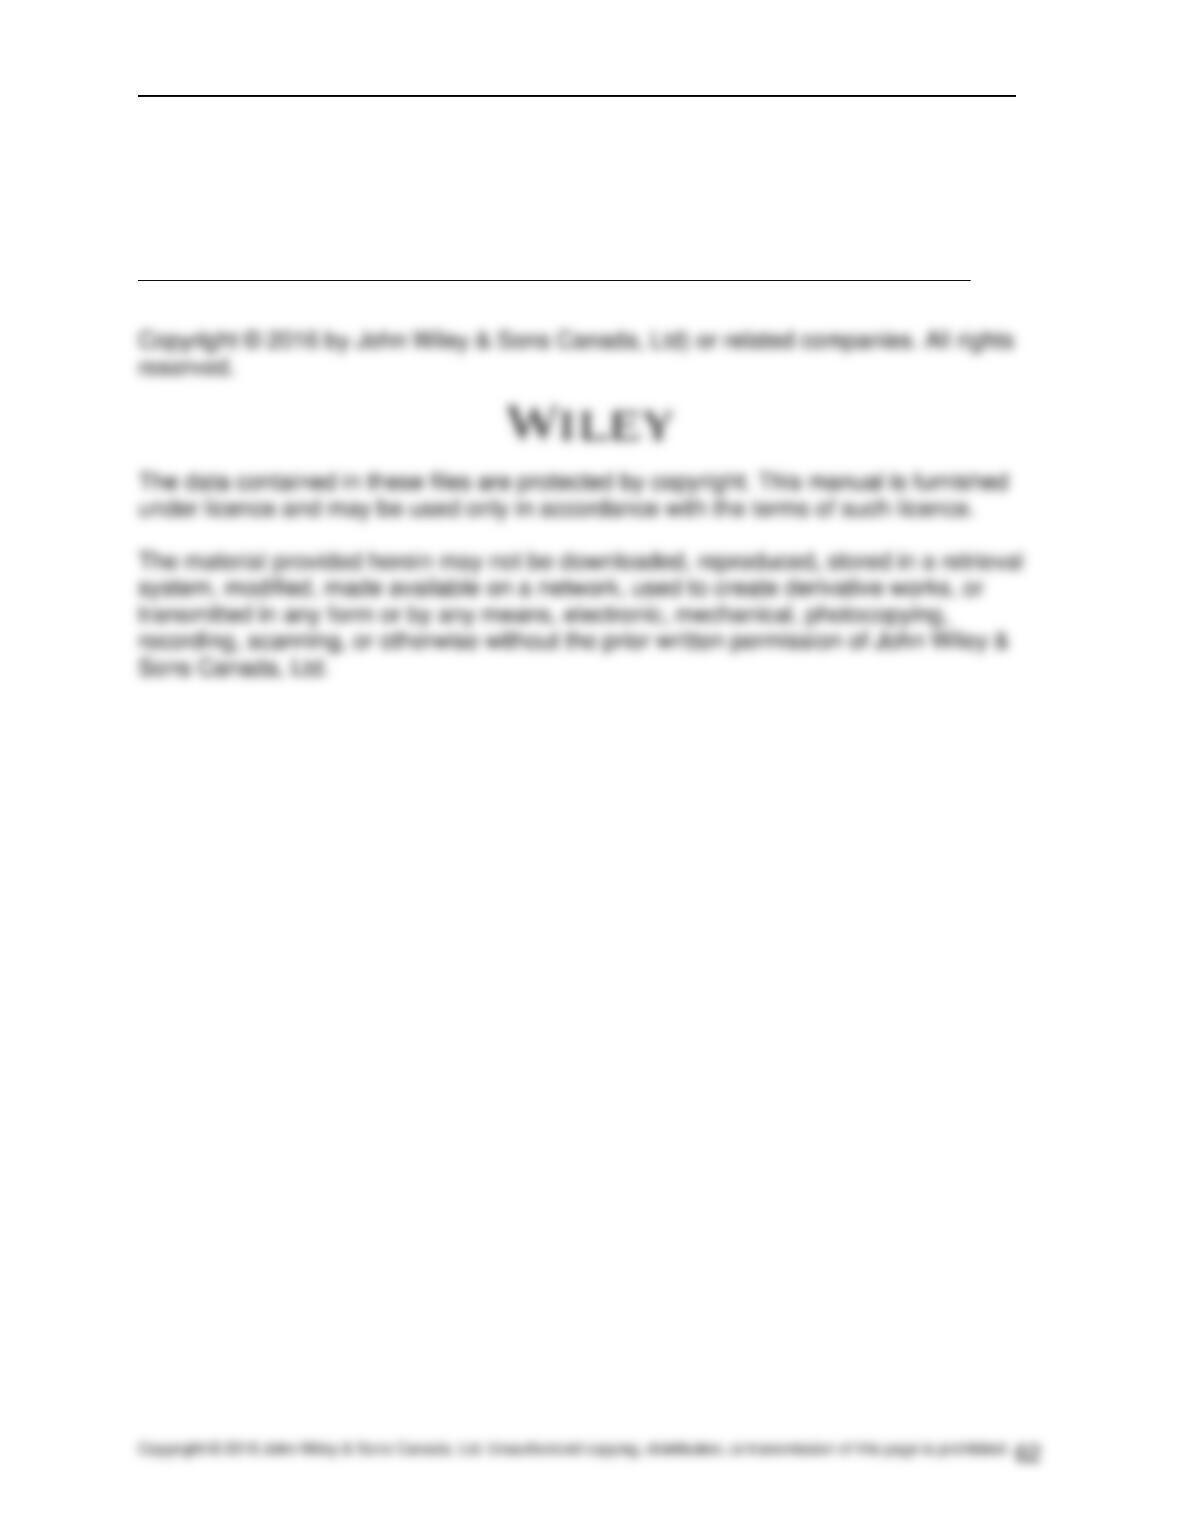
Impact on diversification of adding firms to portfolio
Risk, Return, and Portfolio Theory 8 – 62
LEGAL NOTICE