Over the past four years, Hi-Tech Development stock returned 35.2, 38.8, 18.4, and
-32.2 percent annually. What is the arithmetic average return?
A. 15.05 percent
B. 17.67 percent
C. 20.53 percent
D. 24.20 percent
E. 32.25 percent
Which one of the following terms is defined as the payoff that would be received if an
option were expiring immediately?
A. parity price
B. market price
C. time value
D. underlying value
E. intrinsic value

The relationship between inflation and real GDP is _____.
A. direct
B. positive
C. negative
D. non-existent
E. inverse
You have a 25-year, $225,000 mortgage at 5.5 percent interest. What is the amount of
your mortgage prepayment if you pay $1,650 as your second mortgage payment?
Assume your first payment was the agreed upon amount.
A. $241.93
B. $248.25
C. $268.30
D. $276.37
E. $289.65
A firm has net income of $198,500 and total equity of 1.15 million. There are 220,000
shares of stock outstanding at a price per share of $14.80. What is the firm’s
price-earnings ratio?
A. 16.21
B. 16.40
C. 17.09
D. 17.28
E. 17.94
The orders displayed on NASDAQ are placed by:
A. individuals on ECNs only.
B. market makers only.
C. both market makers and individuals on ECNs.
D. brokerage firms.
E. floor brokers.
You invest $150,000 in Japan at a starting exchange rate of 100.20/$. Your Japanese
investment gains 6 percent, and the ending exchange rate is 101.35/$. What is your total
return on this investment?
A. 3.90%
B. 4.10%
C. 4.60%
D. 4.80%
E. 5.00%
Which one of the following is NOT a financing cash flow according to standard
accounting practice?
A. new issue of stock
B. repurchase of stock
C. new issue of debt
D. interest payments
E. dividend payments
Which one of the following is defined as the price at which an option will be exercised?
A. straddle
B. spread
C. strike
D. market
E. underlying
A $1,000 par value bond is currently valued at $1,037.84. The bond pays interest
semi-annually, has 7 years to maturity, and has a yield to maturity of 7.3 percent. The
coupon rate is _____ percent and the current yield is _____ percent.
A. 6.80; 7.21
B. 8.00; 7.71
C. 8.00; 7.81
D. 8.50; 8.22
E. 8.50; 8.30
Which one of the following is the price of a commodity designated for delivery today?
A. daily price
B. marked price
C. margin price
D. arbitrage price
E. cash price
A stock has an annual standard deviation of 14.1 percent and an expected annual return
of 11.5 percent. What is the smallest expected loss for the next 6 months given a
probability of 2.5 percent?
A. -8.90 percent
B. -13.79 percent
C. -14.57 percent
D. -15.38 percent
E. -16.67 percent
Which one of the following indicates the long-run direction of the market according to
Dow Theory?
A. daily fluctuations
B. secondary reaction
C. monthly changes
D. primary trend
E. tertiary trend
Use these option quotes to answer this question:
What was the prior day’s closing price on the 50 call option on JL stock?
A. $4.45
B. $4.75
C. $5.05
D. $5.10
E. $5.30
A $1,000 face value bond has a 9.0 percent coupon and pays interest semiannually. The
bond matures in 2 years and has a yield to maturity of 6.5 percent. What is the
Macaulay duration?
A. 1.18 years
B. 1.65 years
C. 1.88 years
D. 2.03 years
E. 2.19 years
Which one of the following is NOT a reason why mortgage prepayments occur?
A. house securing the mortgage is sold
B. increase in interest rates
C. homeowner’s spouse dies
D. homeowner faces job transfer
E. home is refinanced
Which of the following features apply to T-bills?
I. original maturities of 4, 13, or 26 weeks
II. minimum face value of $10,000
III. sold at a discount
IV. semiannual interest payments
A. IV only
B. I and III only
C. I and IV only
D. II and III only
E. II and IV only
An asset has an average annual historical return of 11.6 percent and a standard
deviation of 17.8 percent. What range of returns would you expect to see 95 percent of
the time?
A. -41.8 to +65.0 percent
B. -34.4 to +53.6 percent
C. -24.0 to +47.2 percent
D. -6.2 to +29.4 percent
E. -5.4 to +41.0 percent
A NYSE member who trades only for his or her own account is called a(n):

A. floor trader.
B. specialist.
C. individual broker.
D. floor broker.
E. house broker.
Lucas owns a large farming operation which encompasses over 5,000 acres of corn. The
crop this year is abundant and will be ready for harvesting next month. Lucas likes the
market prices today but expects the prices to decline over the next month as the supply
of corn increases. Which one of the following positions should Lucas take to hedge his
corn crop?
A. sell in the spot market today
B. buy in the spot market today
C. take a long futures position
D. take a short futures position
E. sell in the spot today and take a long position in the futures market
The geometric return on a stock over the past 10 years was 7.9 percent. The arithmetic
return over the same period was 8.8 percent. What is the best estimate of the average
return on this stock over the next 5 years?
A. 8.40 percent
B. 9.05 percent
C. 9.08 percent
D. 9.13 percent
E. 9.47 percent
Representativeness heuristic is best explained as:
A. the process of assuming events are random even when they are not.
B. the creation of patterns in planned events.
C. concluding that casual factors cause random events when in fact they do not.
D. believing that random events that occur in clusters are truly random.
E. overconfidence in one’s own skills as an investor.
A Treasury bill matures in 68 days and has a bond equivalent yield of 4.05 percent.
What is the effective annual rate?
A. 4.12 percent
B. 4.14 percent
C. 4.15 percent
D. 4.17 percent
E. 4.18 percent
Louise just purchased 3 call option contracts on GE stock. How many shares of stock
can she buy at the strike price based on these contracts?
A. 3
B. 30
C. 300
D. 30,000
E. 300,000
Which one of the following is seen as a bearish indicator?
A. decreased short selling
B. increased buying by odd-lot traders
C. shorter skirt lengths
D. a Super Bowl win by a National Football League team
E. tight Bollinger bands
Which one of the following prices will an investor pay to purchase shares of stock that
are currently outstanding?
A. issue
B. option
C. bid
D. ask
E. primary
Which one of the following is correct concerning the two-stage dividend growth
model?
A. The discount rate is based on the coupon rate a firm pays on its outstanding bonds.
B. The first growth rate must be higher than the second growth rate.
C. The time value of money is ignored.
D. The discount rate ignores the risks associated with an individual firm.
E. The discount rate considers the risk-free rate of return.
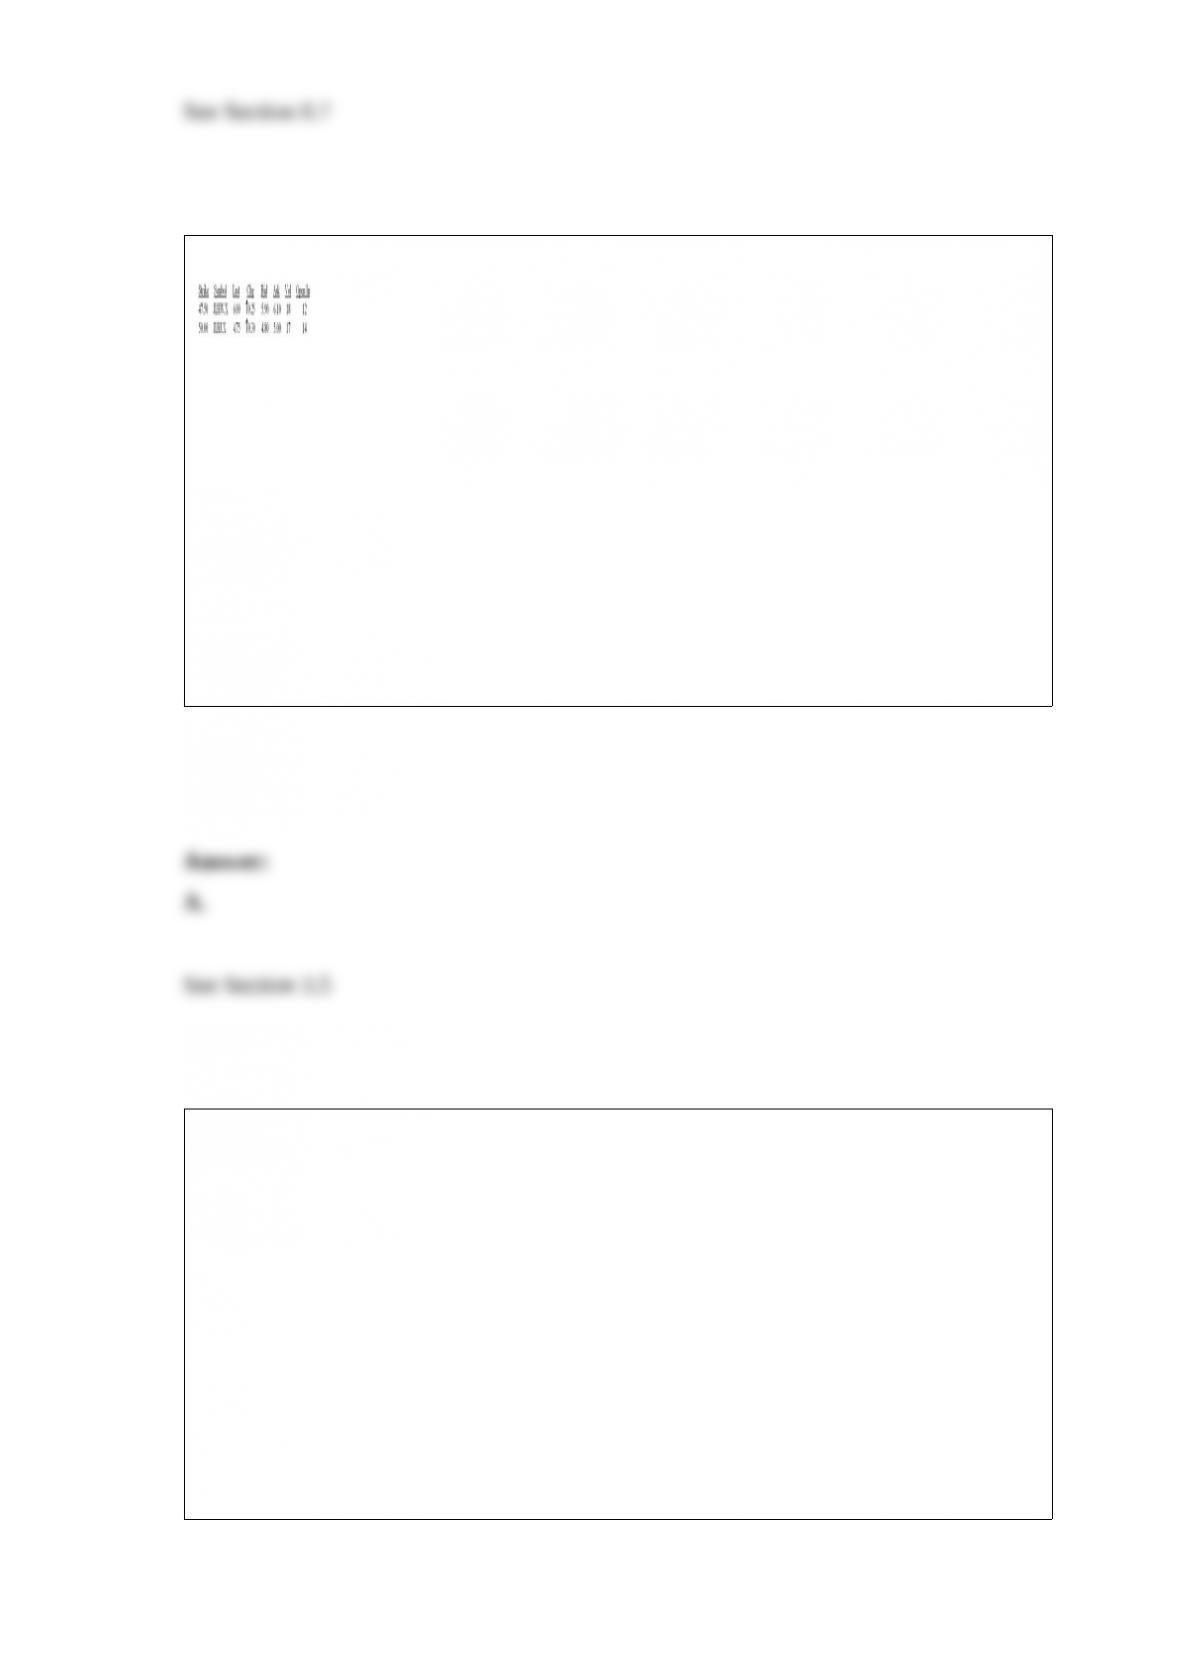
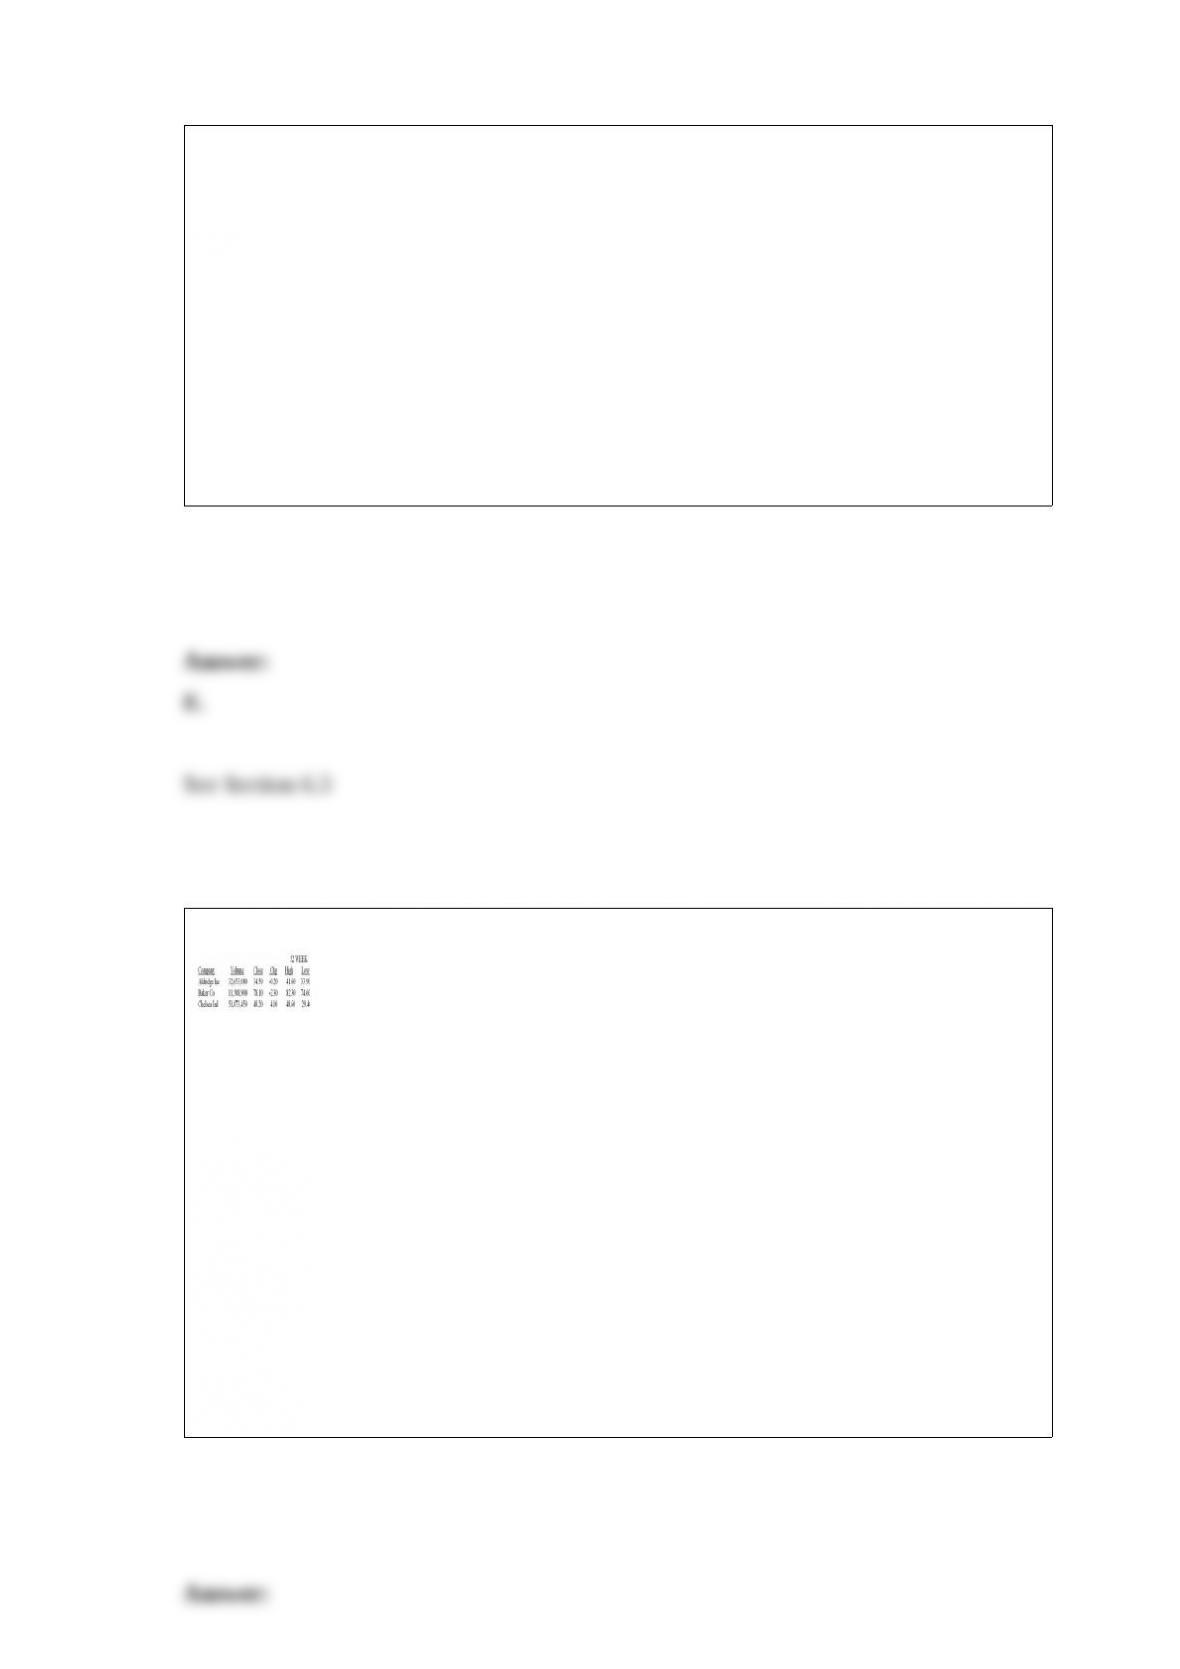
Use the following stock quotes to answer this question:
Vivian purchased 700 shares of Aldridge, Inc. stock at what turns out to be the lowest
price during the past year. How much has the value of her shares changed since she
made this investment?
A. -$4,970
B. $60
C. $1,950
D. $420
E. $5,390
Eight months ago, you purchased 300 shares of a non-dividend paying stock for $27 a
share. Today, you sold those shares for $31.59 a share. What was your annualized rate
of return on this investment?
A. 17.00 percent
B. 21.45 percent
C. 25.50 percent
D. 26.55 percent
E. 28.00 percent
The difference between the price an underwriter pays an issuer and the underwriter’s
offering price is called the:
A. spread.
B. margin.
C. offer differential.
D. firm commitment.
E. underwriting capital.
Bollinger bands:
A. graphically reflect the differences between two moving averages.
B. graphically depict the relative strength of a security as compared to the market.
C. are a graphical representation of an exponential moving average.
D. depict a 2-standard deviation bound around a moving average.
E. are equal to the 20-day moving average plus or minus one standard deviation.
Inside quotes are the:
A. highest asked and lowest bid quotes offered by securities dealers.
B. highest bid and lowest asked quotes offered by securities dealers.
C. latest prices at which corporate insiders have purchased or sold securities.
D. bid and asked prices which are offered only to institutional traders or large private
investors.
E. latest price at which a security traded.
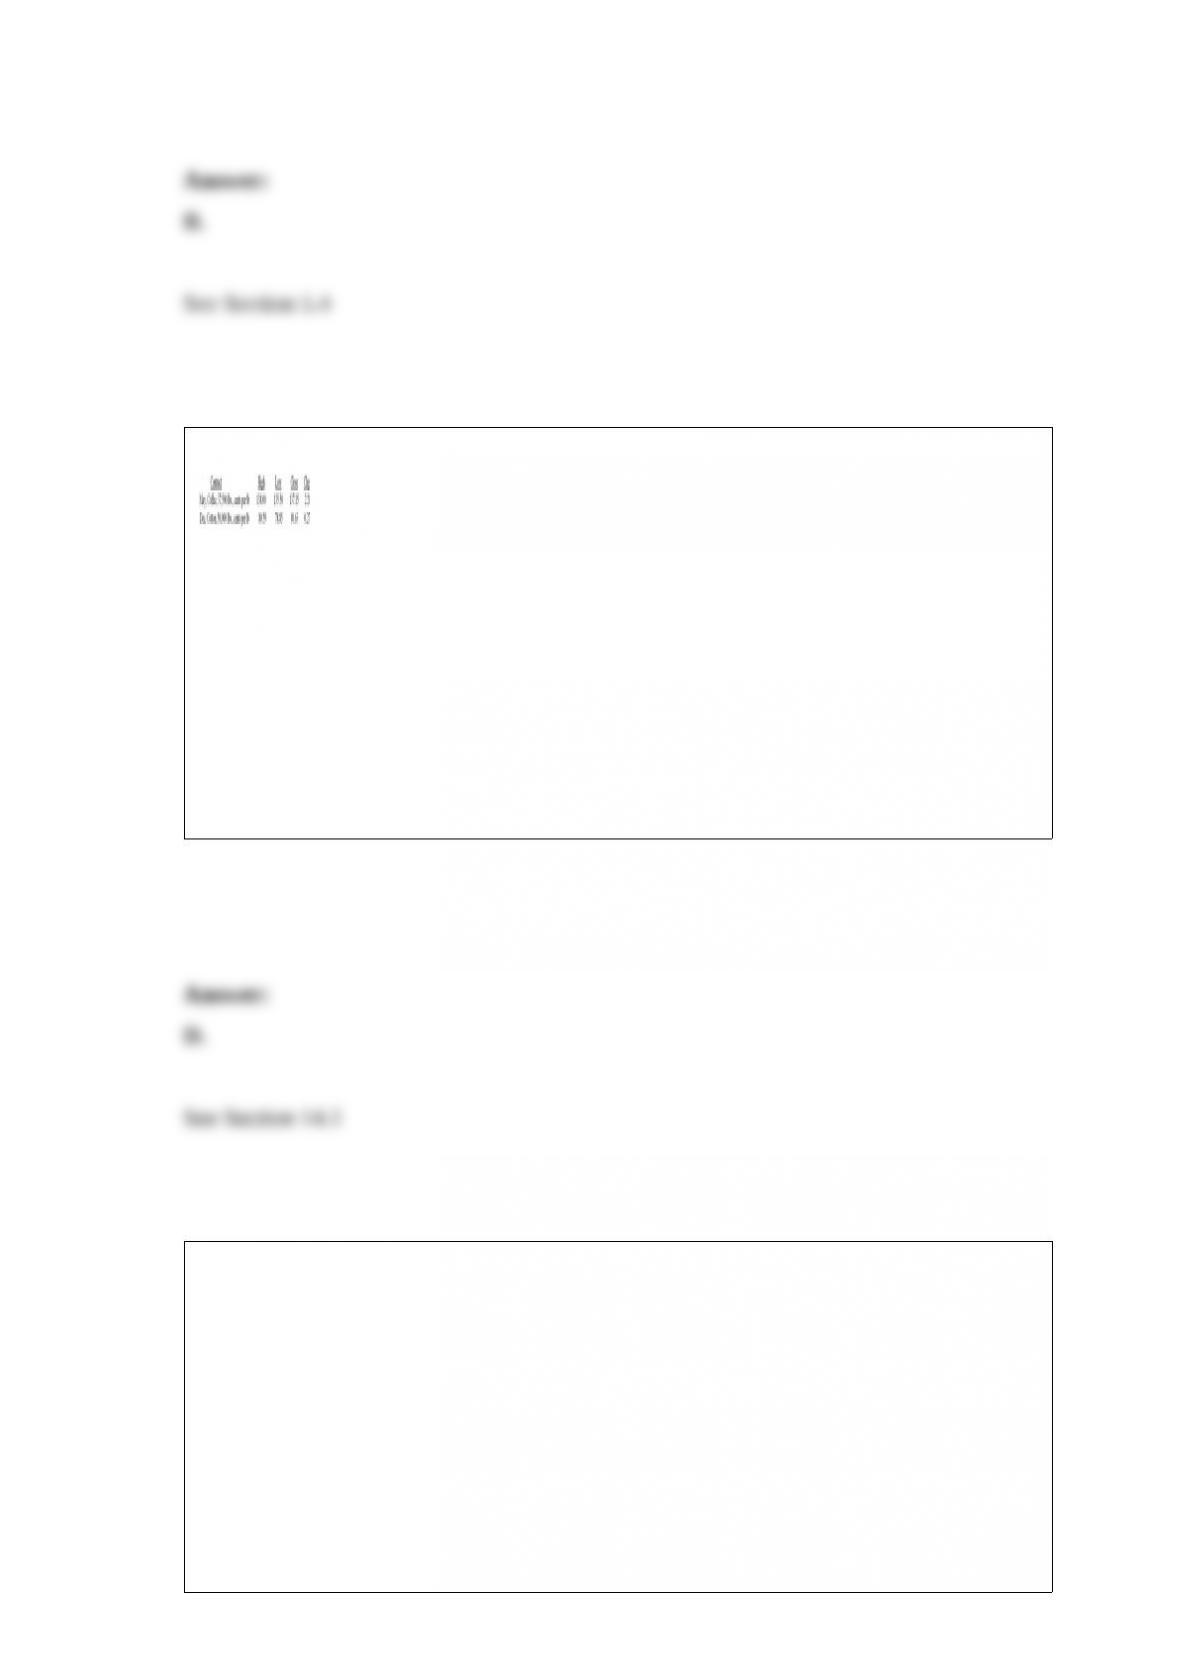
What was the price per pound of December cotton at the end of this trading day?
A. $0.7885
B. $0.8036
C. $0.8059
D. $0.8063
E. $0.8090
You purchased 1,000 shares of stock at $42 a share. The stock is currently selling for
$45 a share. The initial margin was 70 percent and the maintenance margin is 30
percent. What is your current margin position?
A. 28.36 percent
B. 25.00 percent
C. 75.00 percent
D. 63.59 percent
E. 72.00 percent