
1) in the following edgeworth box diagram for a countrys production,
a. a movement from point s to point t involves an increase in the capital/labor ratio used
in the production of good a
b. if the ppf is plotted from the contract curve (or production efficiency locus), the
production combination of goods a and b associated with point r is on the ppf
c. if the ppf is plotted from the contract curve (or production efficiency locus), with
good a on the vertical axis and good b on the horizontal axis, the production
combination of goods a and b associated with the 0b origin is at the origin of the ppf
graph
d. if the ppf is plotted from the contract curve (or production efficiency locus), with
good a on the vertical axis and good b on the horizontal axis, the production
combination of goods a and b associated with point t is further up the vertical axis than
the production combination associated with point s
2) consider a keynesian income model without a government sector. in a graph with
national income (y) on the horizontal axis and both (s – i) and (x – m) on the vertical
axis, the graphical relationship between (s – i) and y would be portrayed as
__________, and the graphical relationship between (x – m) and y would __________.
a. a downward-sloping line; also be portrayed as a downward-sloping line
b. a downward-sloping line; be portrayed as an upward-sloping line
c. an upward-sloping line; be portrayed as a downward-sloping line
d. an upward-sloping line; also be portrayed as an upward-sloping line
3) if good a costs $10 per unit in country a and $12 per unit in country b, and if
transport costs between a and b for the good are $3 per unit, an economist would say
that
a. the good will be exported from a to b.

b. the good will be exported from b to a.
c. intra-industry trade will occur in the good.
d. the good will be a nontraded good.
4) other things equal, a countrys consumers demand for imports schedule for a good
tends to be __________ than the countrys consumers overall demand schedule for the
good. in addition, other things equal, a countrys producers supply of exports schedule
of a good tends to be __________ than the countrys producers overall supply schedule
of the good.
a. more elastic; more elastic
b. more elastic; less elastic
c. less elastic; more elastic
d. less elastic; less elastic
5) given the following table showing various $/£ exchange rates and the respective
quantities of pounds demanded by u.s. buyers:
$/£ pounds demanded
$2.50/£1 £1,000
$2.00/£1 £1,500
$1.50/£1 £1,800
the demand for pounds between $2.00/£1 and $1.50/£1 is
a. elastic
b. unit-elastic
c. inelastic
d. elastic, unit-elastic, or inelastic cannot be determined without more information

6)
in the diagram above, suppose that a subsidy to import-competing producers is given
instead of a tariff being imposed. the subsidy is set to generate the same amount of
domestic production of the good as occurred under the tariff. what would be the net
welfare loss to the country in this situation?
a. $2
b. $6
c. $12
d. $34
7) proponents of fixed exchange rates would find the most support for their position in
which one of the following empirical results regarding the relationship between
exchange rate variations and the volume of international trade? (assume that the
empirical tests adequately account for other factors that influence the volume of trade.)
a. no discernible relationship between exchange rate variations and the volume of trade
b. a negative relationship between exchange rate variations and the volume of trade
c. a mildly positive relationship between exchange rate variations and the volume of
trade
d. a strongly positive relationship between exchange rate variations and the volume of
trade
8) which one of the following statements pertaining to vernons product cycle theory for
explaining u.s. trade is incorrect?
a. there is no international trade in the new product stage
b. throughout the maturing product stage, because the good is exclusively being
produced abroad, the united states imports the good
c. in the maturing product stage, u.s. firms may start producing the good from an
overseas location, and thus exports of the good from the united states may decrease
d. in the standardized product stage, the good is exported by developing countries

9) if the demand for traded goods is price-inelastic, the price-specie-flow mechanism
will result in
a. gold movements between countries that remove trade deficits and surpluses
b. gold movements between countries that worsen trade deficits and surpluses
c. negligible movements of gold between countries and hence little or no adjustment of
trade deficits and surpluses
d. a removal of the basis for trade between countries
10) in the classification terminology of the world bank, a strongly-inward-oriented
economy is one that has __________ trade controls and consequently __________.
a. extensive; discriminates against production for the home market rather than for
export
b. extensive; discriminates in favor of production for the home market rather than for
export
c. extensive; does not discriminate between production for the home market and
production for export
d. few or no; discriminates in favor of production for the home market rather than for
export
11) if the labor required per unit of output falls as output increases (such as is specified
in the krugman model), this can be thought of as a situation
a. of constant returns to scale
b. of decreasing returns to scale
c. of increasing returns to scale
d. that is exactly the same situation as was the case in ricardos analysis
12) suppose that a u.s. importer buys goods from a foreign firm and makes payment by
drawing down its new york bank account and transferring the funds to the foreign
exporters bank account in the foreign country. in this situation, the credit entry in the
u.s. balance of payments account is __________.
a. decrease in u.s. short-term private assets abroad
b. increase in u.s. short-term private assets abroad
c. decrease in foreign short-term private assets in the united states
d. imports of goods
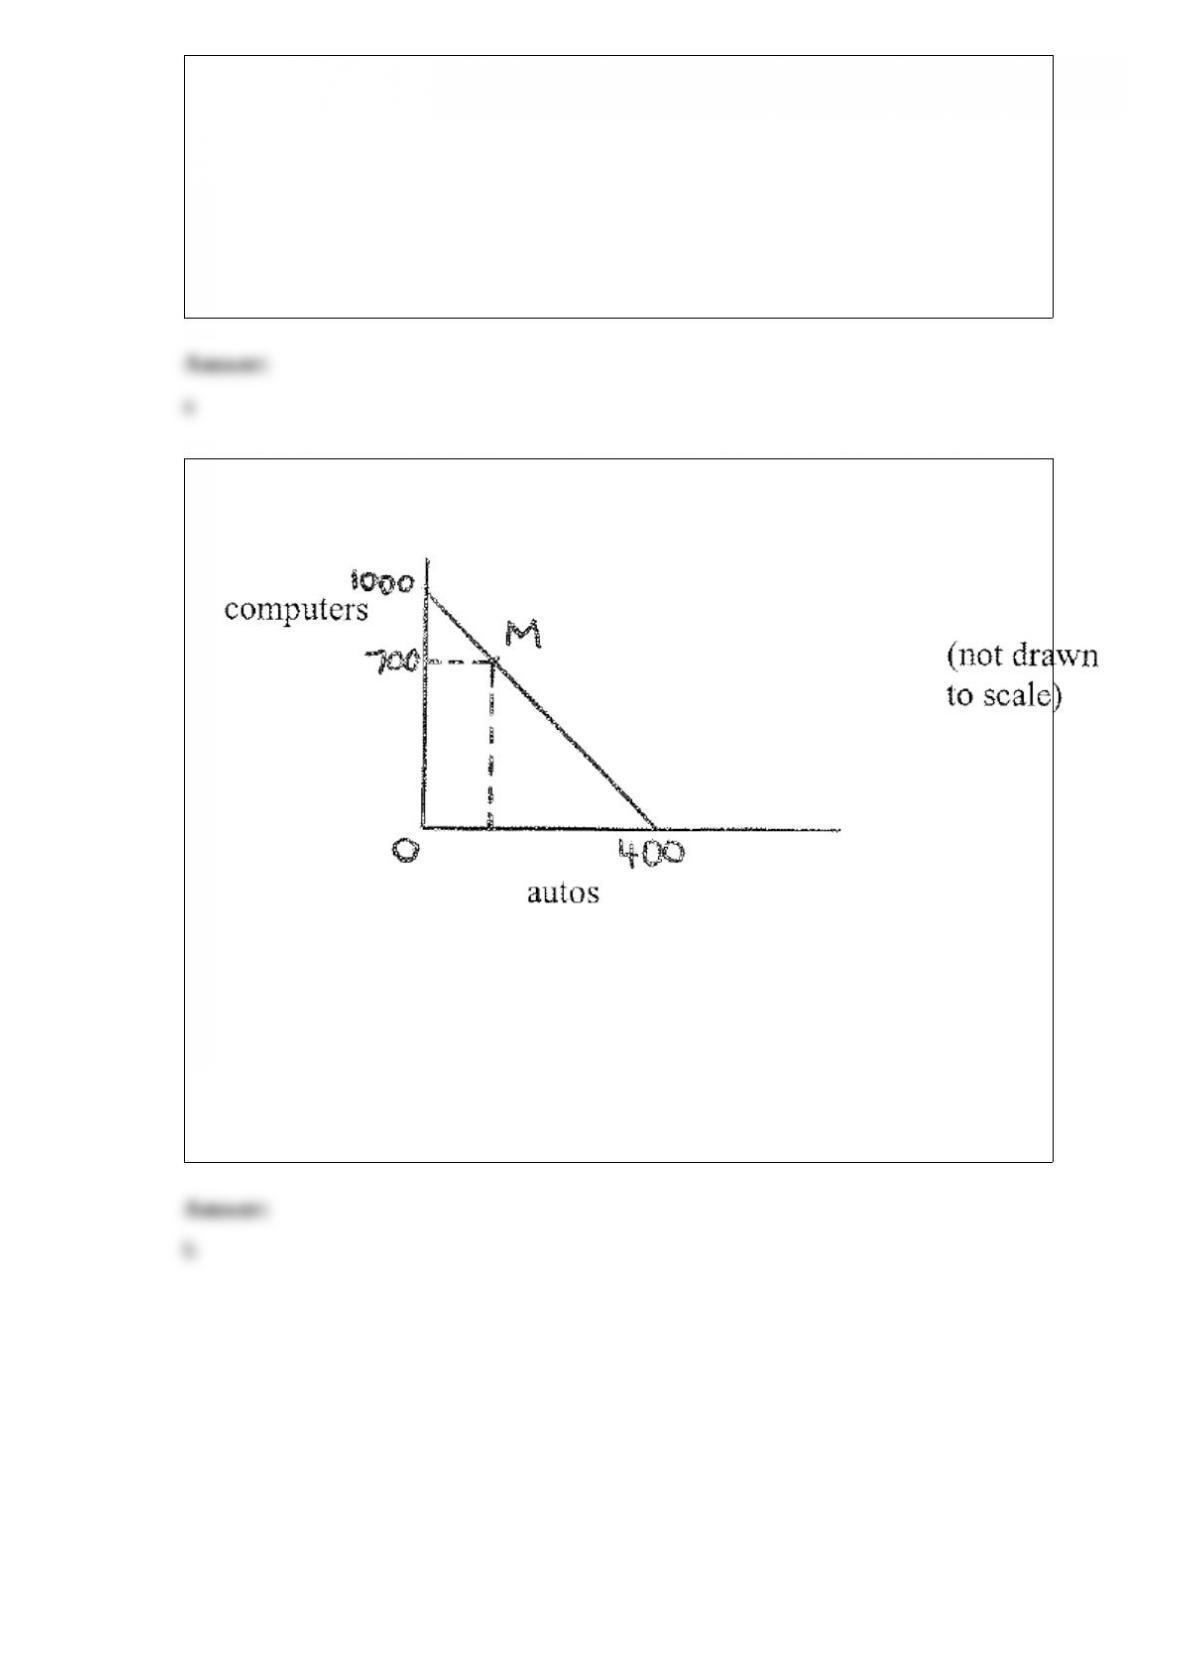
13) suppose that a country in the classical model has the following
production-possibilities frontier (ppf):
if, in autarky, the country is producing 700 computers and is located at point m on the
ppf, the country would be producing __________ autos. if the country is now opened to
trade at a terms of trade of 1 auto: 2 computers (or 1 computer: 0.5 auto), it would
export __________.
a. 120; autos
b. 120; computers
c. 280; autos
d. 280; computers