
Coase pointed out that when victims are few, government need not ___, but should
simply ___.
A. regulate behavior; charge a price
B. charge a price; regulate behavior
C. assign property rights; charge a price
D. charge a price; assign property rights
Answer:
A 10% VAT is paid by the ____.
A. farmer only
B. miller only
C. baker only
D. farmer, miller, and baker
Answer:

The steeper (the more ____) are the D and S curves for labor, the ____ is the efficiency
loss from a tax.
A. elastic; greater
B. elastic; smaller
C. inelastic; greater
D. inelastic; smaller
Answer:
Reducing the EITC phase-out rate would _____ the marginal tax rate and _____
additional work.
A. increase; discourage
B. increase; encourage
C. decrease; discourage
D. decrease; encourage
Answer:

The official poverty line is adjusted for what?
A. Family size and inflation
B. Family size but not inflation
C. Inflation but not family size
D. Neither inflation nor family size
Answer:
An annual tax on wealth would _____ and _____.
A. discourage wealth accumulation; discourage consumption
B. encourage wealth accumulation; discourage consumption
C. discourage wealth accumulation; encourage consumption
D. encourage wealth accumulation; encourage consumption
Answer:

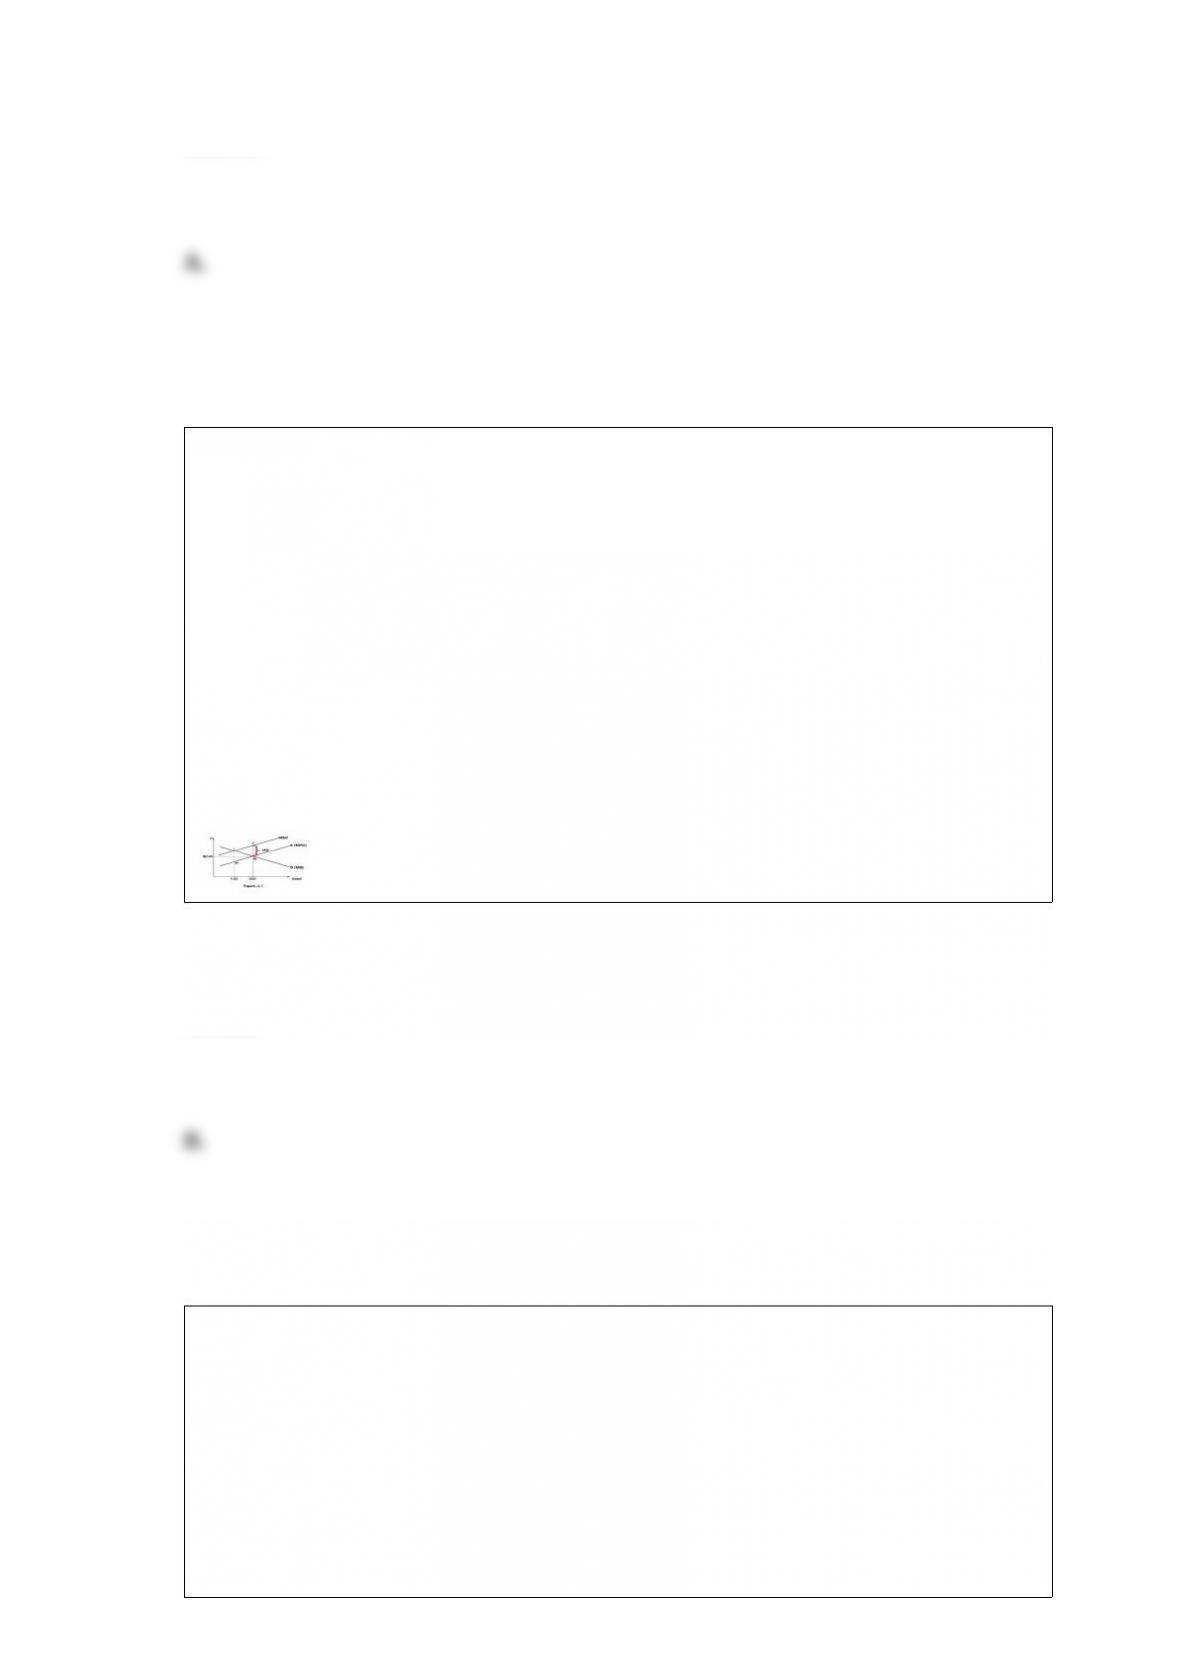
With no policy, each firm emits 120 tons of carbon. As H reduces its emissions from
120 to 0, its marginal abatement cost (MAC) rises from $0 to $480; as L reduces its
emissions from 120 to 0, its MAC rises from $0 to $120. The MD of a ton of carbon is
$96. The tax per ton is T.
Refer to Figure 2.2. H is a carbon polluter in a high-income country, L in a low-income
country, and the goal is to cut total carbon emissions by 120. This can be done at
minimum total cost if H cuts back ___ and L cuts back ___; then the total cost would be
$______.
A. 24; 96; $5,760
B. 96; 24; $5,760
C. 24; 96; $11,520
D. 96; 24; $11,520
Answer:
When wage income is zero, welfare is _____ and the EITC is _____.
A. minimum; maximum
B. maximum; zero
C. maximum; maximum
D. minimum; minimum

Answer:
A ____ plan gives every district the same grant per pupil to provide a basic minimum
on which the district ____ add its own spending.
A. district power equalizing; can
B. district power equalizing; cannot
C. foundation; can
D. foundation; cannot
Answer:
In 2007, net debt as a percentage of GDP was ____.
A. 37%
B. 47%
C. 57%
D. 67%

Answer:
To evaluate the accuracy of Laffer’s hypothesis, we must compare actual revenue this
year when t increases on January 1 to ___.
A. actual revenue last year
B. an estimate of what revenue would have been this year if t had not increased
C. actual revenue next year
D. an estimate of what revenue would have been last year if t had not increased
Answer:
Raising the state share of local public school revenue ___.
A. enables a reduction in inequality and may bring more state regulation
B. enables a reduction in inequality and won’t bring more state regulation
C. doesn’t enable a reduction in inequality and may bring more state regulation
D. doesn’t enable a reduction in inequality and won’t bring more state regulation
Answer:
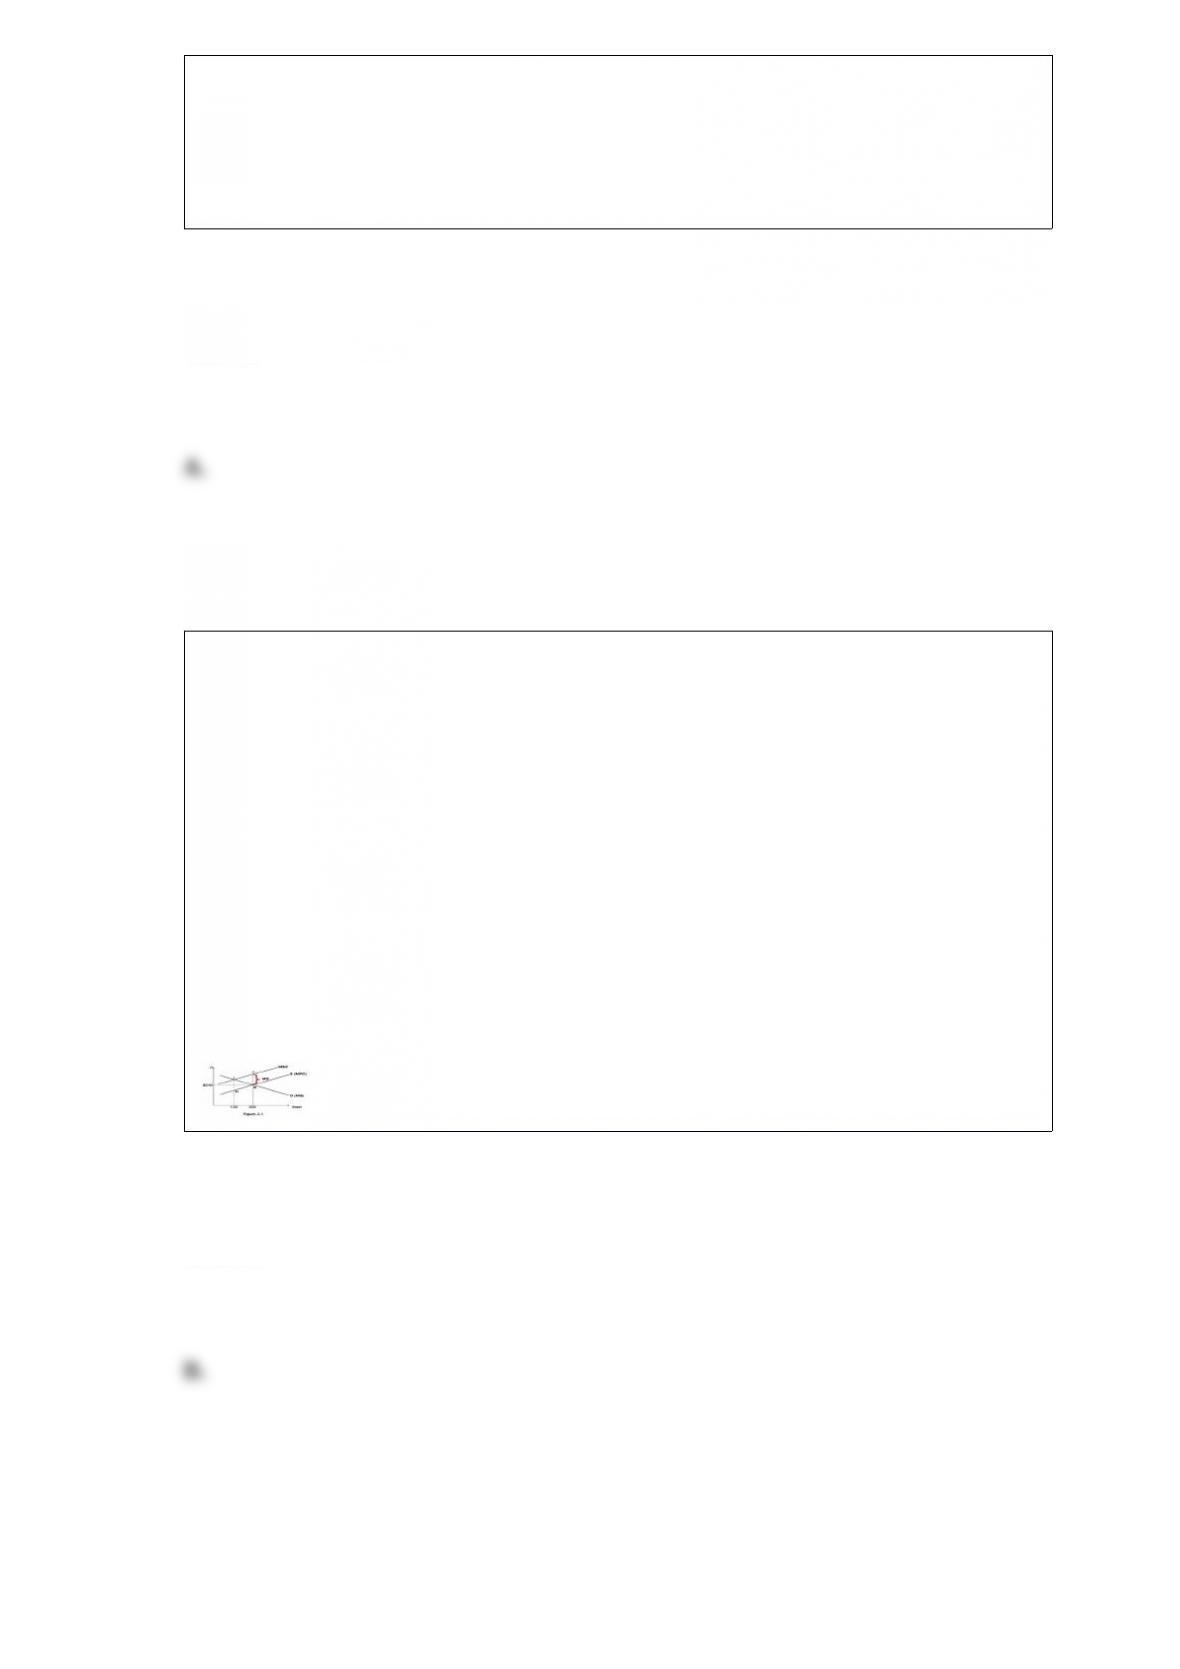
Figure 2.1 shows the supply and demand diagram for steel. Environmental damage per
unit produced is $60.
Refer to Figure 2.1. The MB to consumers from the 200th unit is ____.
A. $200
B. $240
C. $300
D. $360
Answer:
The fiscal imbalance of a program like Social Security or Medicare equals what?
A. The PV of future scheduled benefits plus the PV of future assigned taxes
B. The PV of future assigned taxes plus the PV of future scheduled benefits
C. The PV of future scheduled benefits minus the PV of future assigned taxes

D. The PV of future assigned taxes minus the PV of future scheduled benefits
Answer:
A consumption tax is a tax that imposes a burden on a household
A. because the household must write the check to the government.
B. according to the household’s potential consumption spending.
C. because business firms pay the government.
D. according to the household’s actual consumption spending.
Answer:
The U.S. estate tax is paid by about __% of all who die in a given year.
A. 50
B. 25
C. 10

D. 1
Answer:
It is hard to ___ someone from benefiting from a public good like national defense; to
prevent ____, government should ___.
A. include; free-riding; produce the good
B. exclude; free-riding; produce the good
C. exclude; free-riding; levy a tax
D. exclude; corruption; levy a tax
Answer:
A city government can tax high-income suburbanites ______.
A. only by taxing them when they work in the city
B. only by taxing them when they shop in the city

C. by taxing them when they work, or when they shop, in the city
D. by taxing them when they enter the city regardless of how they enter
Answer:
Replacing the current U.S. income tax with either a RST or a VAT that raises the same
revenue would cause a redistribution of the tax burden away from ____ households.
A. most
B. low-income
C. middle-income
D. high-income
Answer:
If b* is debt as a percentage of GDP in the long run, f is the deficit as a percentage of
GDP, and g is the growth rate of nominal GDP, then b* = ___.
A. f/g
B. g/f
C. fg
D. f-g
Answer:
Figure 2.1 shows the supply and demand diagram for steel. Environmental damage per
unit produced is $60.
Refer to Figure 2.1. This net loss from units 121 to 200 is $______.
A. $3,600
B. $2,400
C. $1,800
D. $1,200
Answer:

A typical household wants to live in a town where other residents have high incomes
because schools will be good, neighborhoods safe, and the _____.
A. other residents will look down on the household unless it also earns high income
B. household’s children will score in the top half at school
C. household’s children will get self-esteem because other children will look up to them
D. other residents will contribute substantial tax revenue
Answer:
According to the cited study, the fiscal imbalance of Social Security is _____ and of
Medicare is _____.
A. $10 billion; $62 billion
B. $10 trillion; $62 trillion
C. $62 billion; $10 trillion
D. $62 trillion; $10 trillion
Answer:

Assume there is no externality. The inefficiency from the subsidy equals the area of a
___ to the ___ of the intersection of the original D and S curves.
A. triangle; left
B. triangle; right
C. rectangle; left
D. rectangle; right
Answer:
Refer to Figure 3.1. At a wall thickness smaller than the social optimum, the ___ is ___
than the ____
A. ΣMC; greater; MB
B. ΣMC; less; MB
C. ΣMB; greater; MC
D. ΣMB; less; MC
Answer:
In a competitive insurance market, each person will be charged a premium equal to her
_____.
Answer:
If a public project that costs $100,000 in year 0 generates a benefit of $55,000 in year 1
and a benefit of $60,500 in year 2, should it be built? Explain why the answer depends
on a particular number, and why economists might disagree about the project depending
on the number they choose.
Answer:
In a society where household incomes differ significantly, two processes both operate:
the ____ process and the ____ process.
Answer:
The standard approach to the free-rider problem is .
Answer:
For each $1 a local government spends on activity X, the state government will give it
$2 to spend on X. What is this is an example of?
Answer:
Draw a D/S diagram that shows how X% insurance affects the demand/supply diagram
for medical care. With no insurance, S and D intersect at P=$100 and Q=100. If P were
$0, D would be 120. X%=67%: the insurer pays 67% and patients, 33%, of any medical
bill. With 67% insurance, the demand curve is D’, P=$150 and Q=110.
Answer:
The distribution of the burden between suppliers and demanders does not depend on
_______.
Answer:
A subsidy to the consumers of a good shifts ___ the ___ curve.
Answer:
The optimal scale of a project occurs where the ___ equals the __.
Answer:

In 2007 debt held by the public as a percentage of GDP was what?
Answer: