c.
0.79 when the price increased from $1.00 to $1.50 and 1.19 when the price increased from $1.50 to $2.00.
d.
1.27 when the price increased from $1.00 to $1.50 and 0.84 when the price increased from $1.50 to $2.00.
57. At price of $1.20, a local pencil manufacturer is willing to supply 150 boxes per day. At a price of $1.40, the
manufacturer is willing to supply 170 boxes per day. Using the midpoint method, the price elasticity of supply is about
a.
2.0.
b.
1.23.
c.
1.00.
d.
0.81.
58. At price of $1.30 per pound, a local apple orchard is willing to supply 150 pounds of apples per day. At a price of
$1.50 per pound, the orchard is willing to supply 170 pounds of apples per day. Using the midpoint method, the price
elasticity of supply is about
a.
1.14.
b.
1.00.
c.
0.875.
d.
0.50.
59. At price of $1.25, a paper manufacturer is willing to supply 150 spiral notebooks per day. At a price of $1.50, the
paper manufacturer is willing to supply 175 spiral notebooks per day. Using the midpoint method, the price elasticity of
supply is about
a.
1.18.
b.
1.00.
c.
0.85.
d.
0.25.
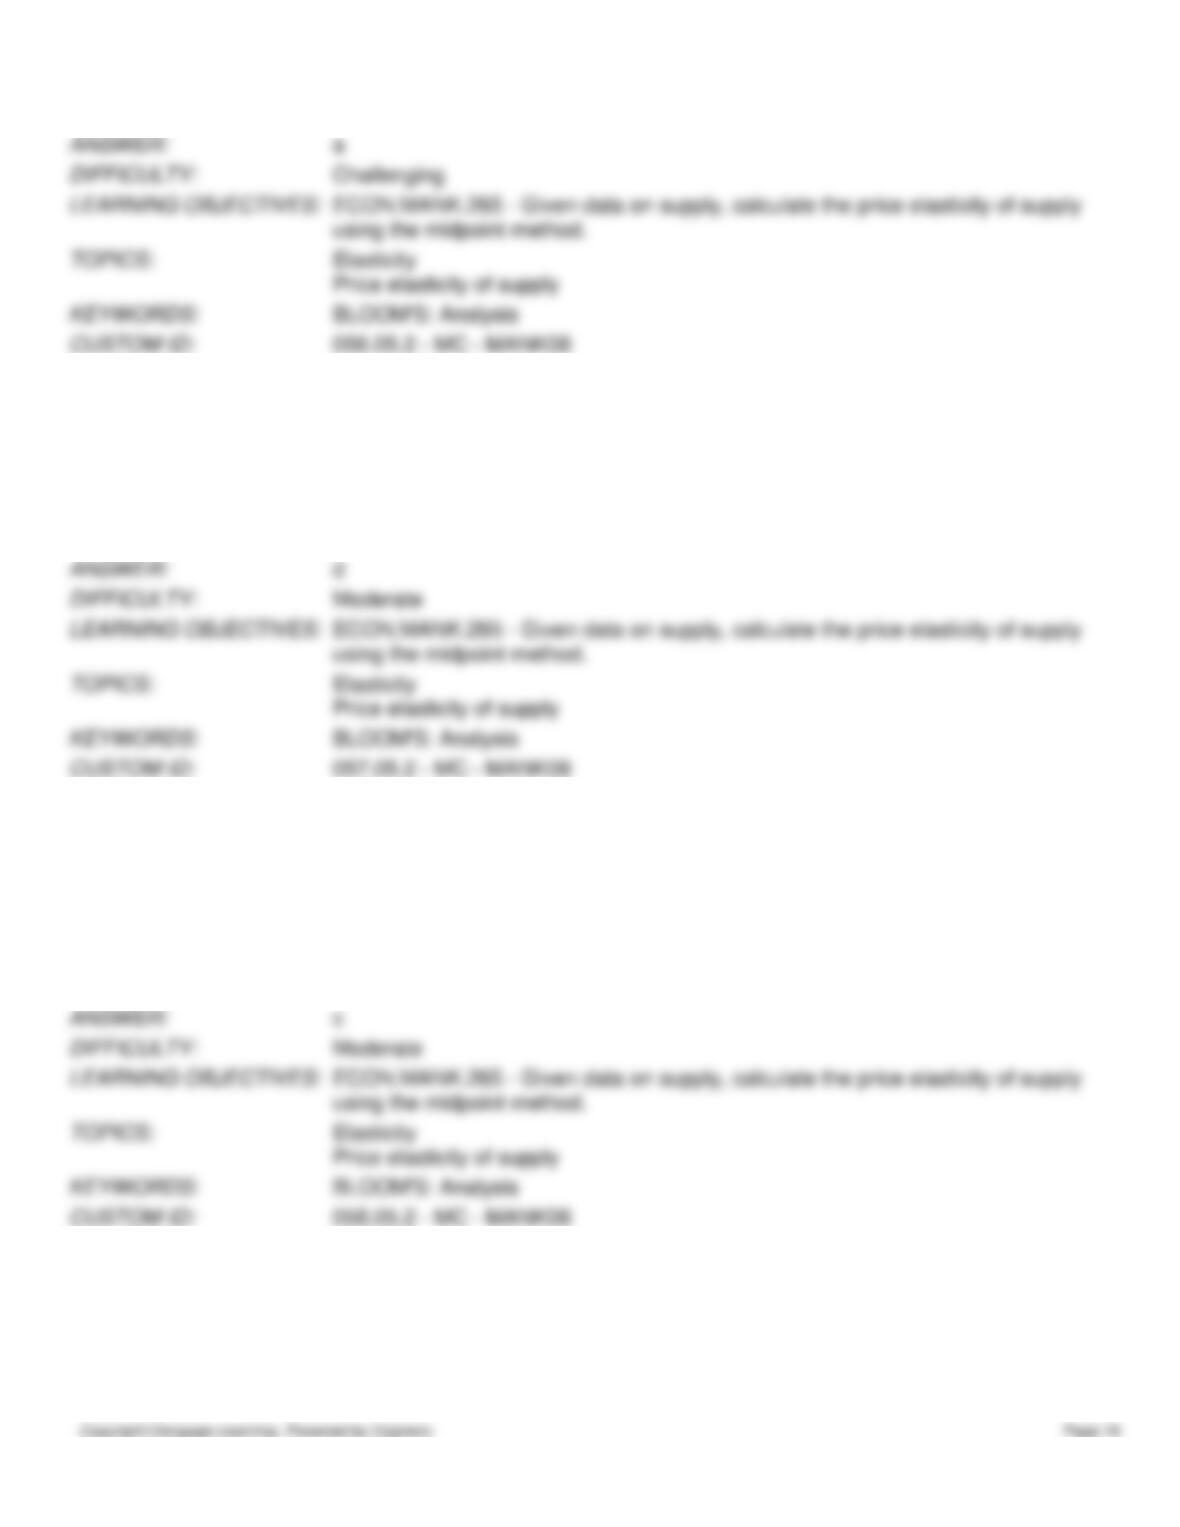
Figure 5-14
60. Refer to Figure 5-14. Over which range is the supply curve in this figure the most elastic?
a.
$16 to $40
b.
$40 to $100
c.
$100 to $220
d.
$220 to $430
61. Refer to Figure 5-14. Over which range is the supply curve in this figure the least elastic?
a.
$16 to $40
b.
$40 to $100
c.
$100 to $220
d.
$220 to $430
62. Refer to Figure 5-14. Using the midpoint method, what is the price elasticity of supply between $16 and $40?
a.
0.125
b.
0.86
c.
1.0
d.
2.5
63. Refer to Figure 5-14. Using the midpoint method, what is the price elasticity of supply between $100 and $220?
a.
0.58
b.
0.67
c.
1.00
d.
1.73
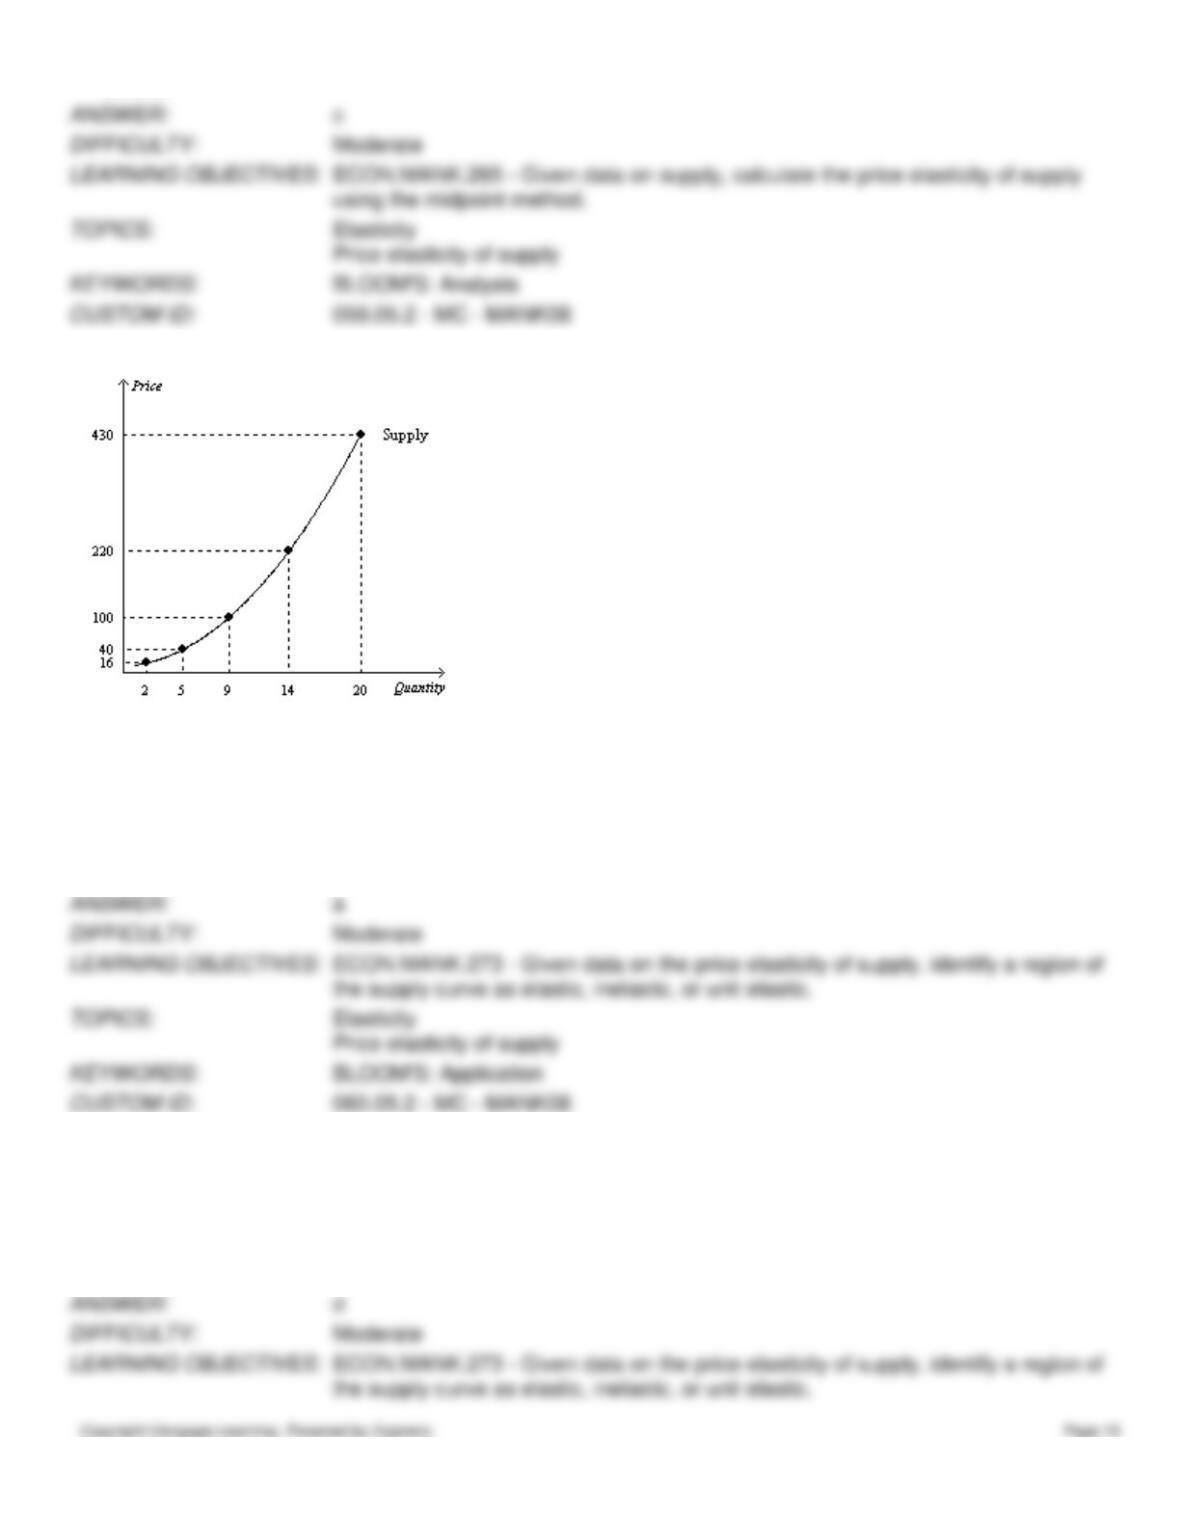
Figure 5-15
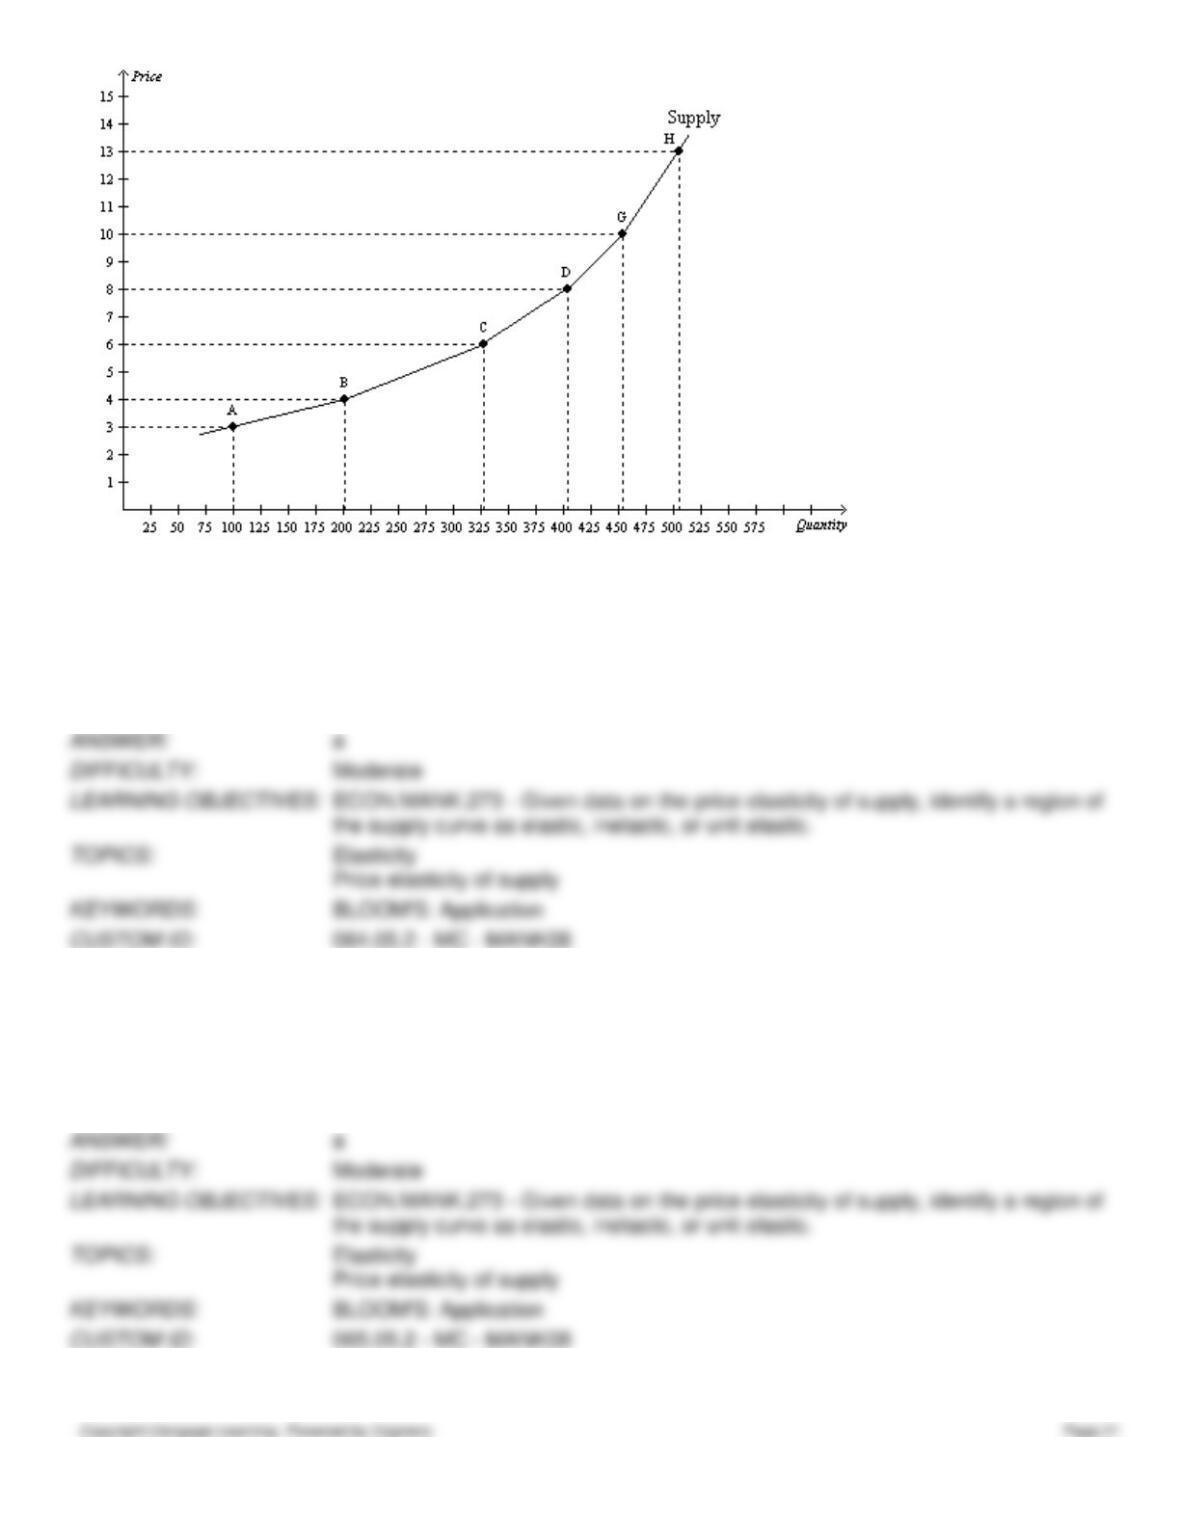
64. Refer to Figure 5-15. Along which of these segments of the supply curve is supply least elastic?
a.
GH
b.
CD
c.
AC
d.
AB
65. Refer to Figure 5-15. Along which of these segments of the supply curve is supply most elastic?
a.
AB
b.
CD
c.
DH
d.
GH
66. Refer to Figure 5-15. Using the midpoint method, what is the price elasticity of supply between points A and B?
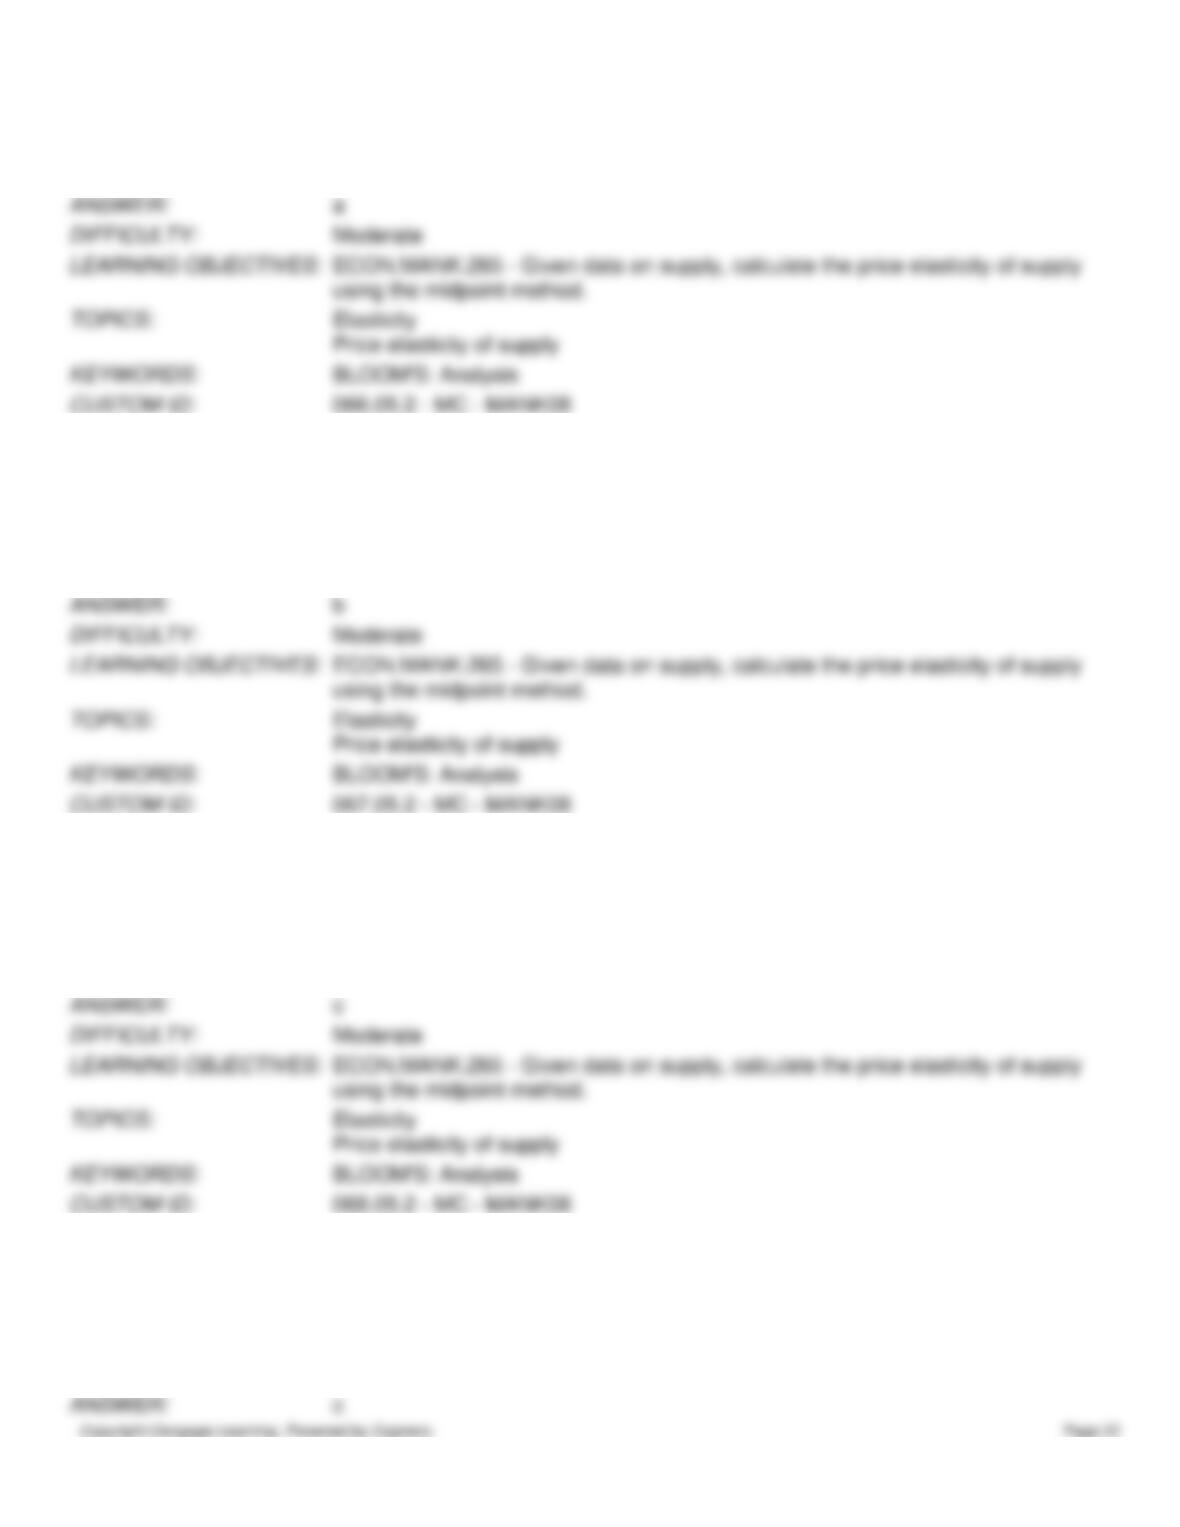
a.
2.33
b.
1.0
c.
0.43
d.
0.1
67. Refer to Figure 5-15. Using the midpoint method, what is the price elasticity of supply between points B and C?
a.
1.67
b.
1.19
c.
0.84
d.
0.61
68. Refer to Figure 5-15. Using the midpoint method, what is the price elasticity of supply between points C and D?
a.
0.21
b.
0.29
c.
0.73
d.
1.36
69. Refer to Figure 5-15. Using the midpoint method, what is the price elasticity of supply between points D and G?
a.
1.89
b.
1.26
c.
0.53
d.
0.34
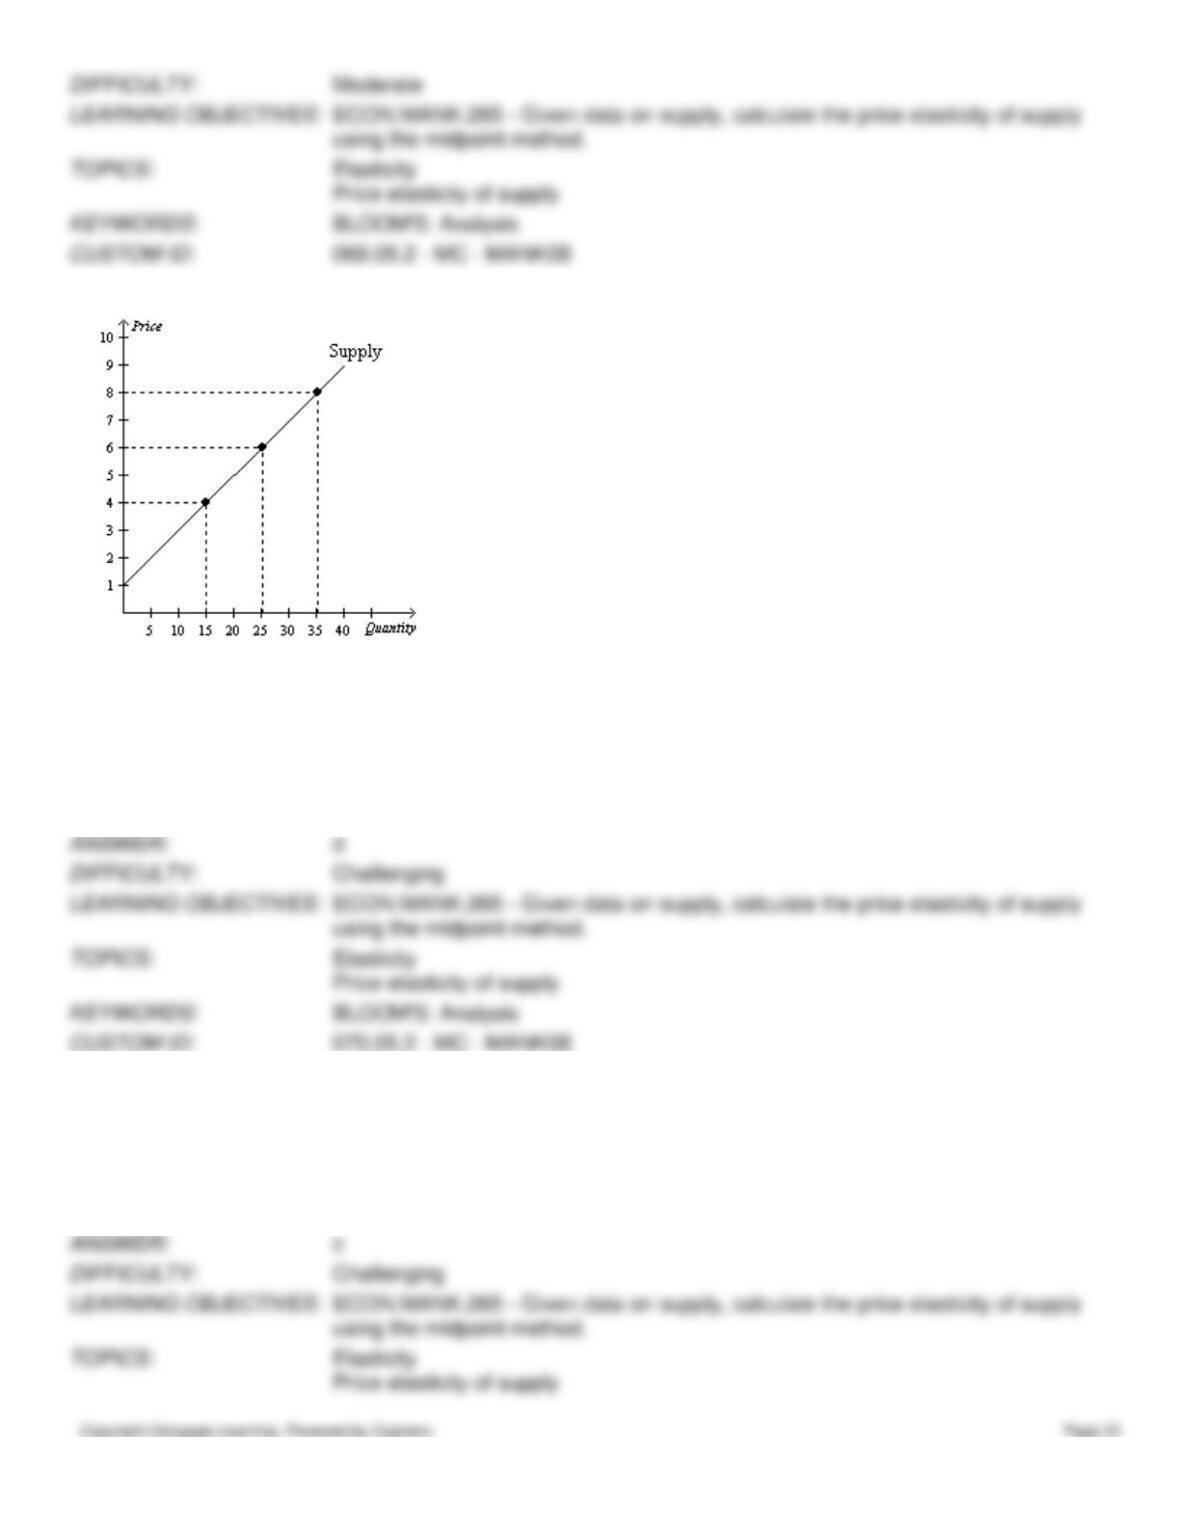
Figure 5-16
70. Refer to Figure 5-16. Using the midpoint method, what is the price elasticity of supply between $4 and $6?
a.
0.75
b.
1.00
c.
1.20
d.
1.25
71. Refer to Figure 5-16. Using the midpoint method, what is the price elasticity of supply between $6 and $8?
a.
0.86
b.
1.00
c.
1.17
d.
1.25
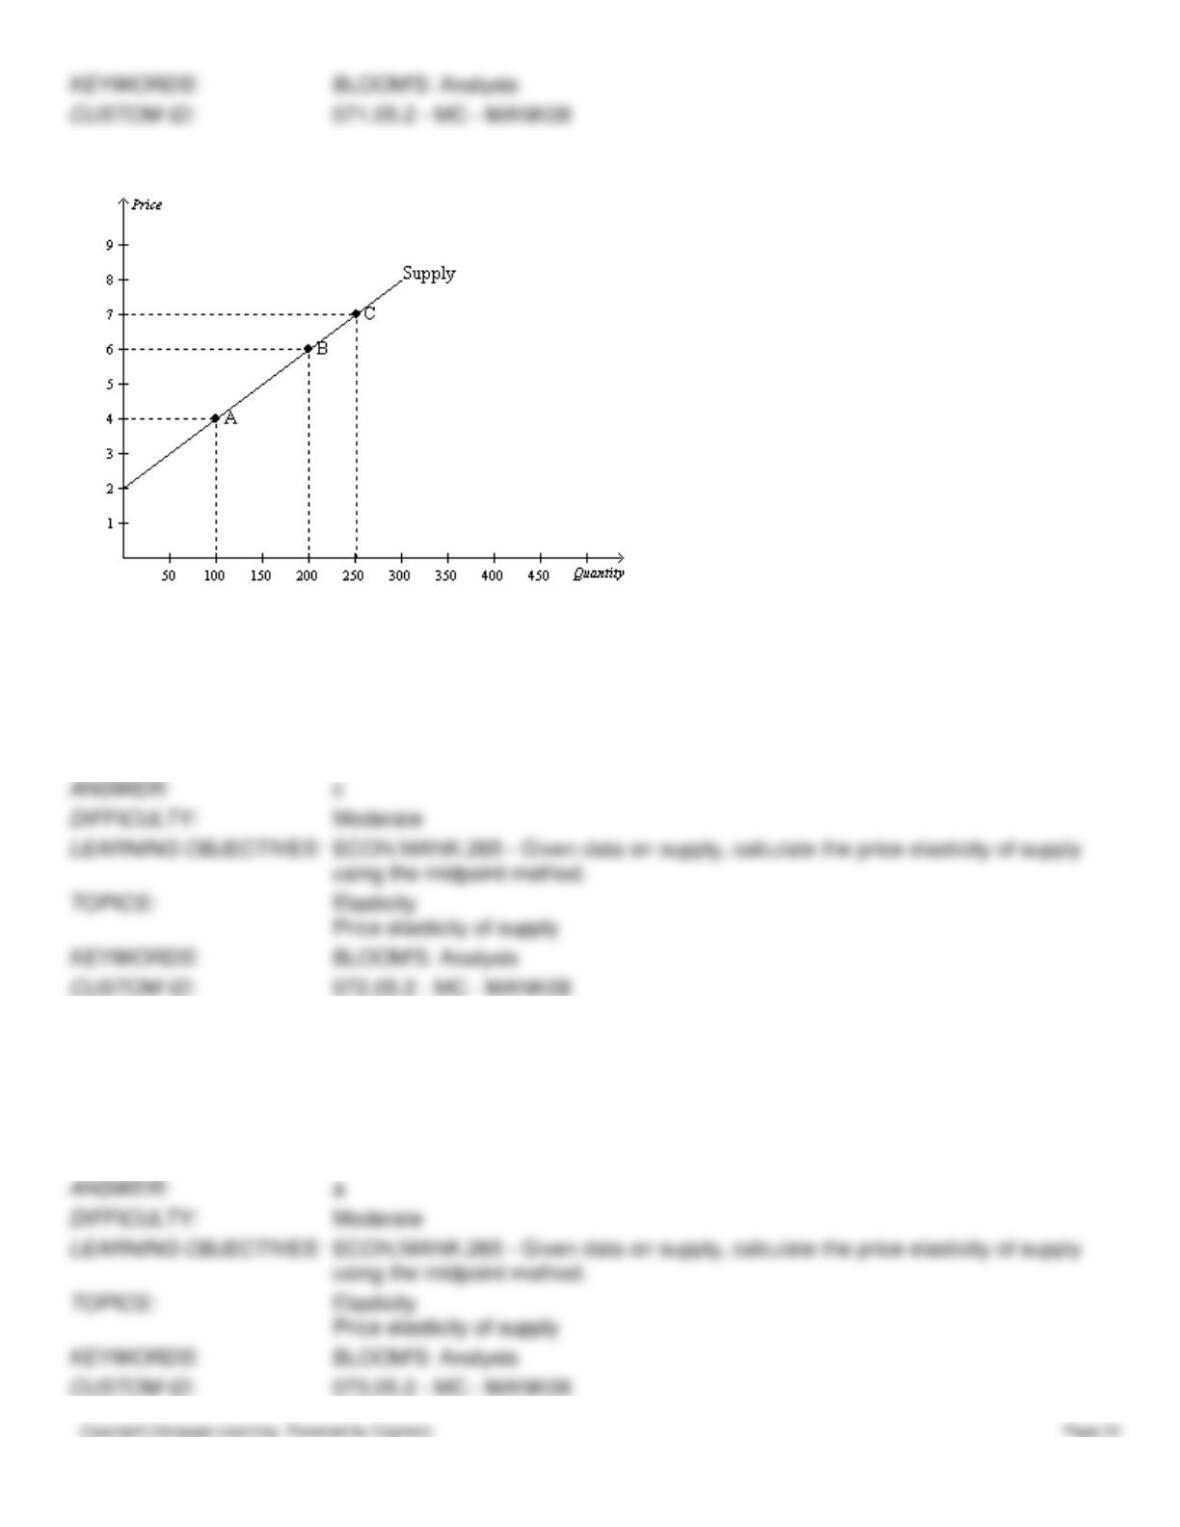
Figure 5-17
72. Refer to Figure 5-17. Using the midpoint method, what is the price elasticity of supply between point A and point B?
a.
0.4
b.
0.6
c.
1.67
d.
2.16
73. Refer to Figure 5-17. Using the midpoint method, what is the price elasticity of supply between point B and point C?
a.
1.44
b.
1.29
c.
0.96
d.
0.69
74. Refer to Figure 5-17. If, holding the supply curve fixed, there were an increase in demand that caused the equilibrium
price to increase from $6 to $7, then sellers’ total revenue would
a.
increase.
b.
decrease.
c.
remain unchanged.
d.
The effect on total revenue cannot be determined from the given information.
Figure 5-18
75. Refer to Figure 5-18. Using the midpoint method, what is the price elasticity of supply between $4 and $5?
a.
0.50
b.
0.56
c.
1.80
d.
2.00
76. Refer to Figure 5-18. Using the midpoint method, what is the price elasticity of supply between $5 and $6?
a.
0.60
b.
0.64
c.
1.57
d.
1.67
77. If sellers respond to very small changes in price by adjusting their quantity supplied by extremely large amounts, the
price elasticity of supply approaches
a.
zero, and the supply curve is horizontal.
b.
zero, and the supply curve is vertical.
c.
infinity, and the supply curve is horizontal.
d.
infinity, and the supply curve is vertical.
78. Which of the following statements is valid when supply is perfectly elastic at a price of $4?
a.
The elasticity of supply approaches infinity.
b.
The supply curve is vertical.
c.
At a price below $4, quantity supplied is infinite.
d.
At a price above $4, quantity supplied is zero.
79. Which of the following statements is not valid when supply is perfectly elastic?
a.
The elasticity of supply approaches infinity.
b.
The supply curve is horizontal.
c.
Very small changes in price lead to very large changes in quantity supplied.
d.
The time period under consideration is more likely a short period rather than a long period.
80. When supply is perfectly elastic, the value of the price elasticity of supply is
a.
0.
b.
1.
c.
greater than 0 and less than 1.
d.
infinity.
81. As the price elasticity of supply approaches infinity, very small changes in price lead to
a.
very large changes in quantity supplied.
b.
very small changes in quantity supplied.
c.
no change in quantity supplied.
d.
None of the above is correct.
82. If the price elasticity of supply for a good is equal to infinity, then the
a.
supply curve is vertical.
b.
supply curve is horizontal.
c.
supply curve also has a slope equal to infinity.
d.
quantity supplied is constant regardless of the price.
83. A manufacturer produces 1,000 units, regardless of the market price. For this firm, the price elasticity of supply is
a.
infinity.
b.
zero.
c.
one.
d.
negative one.
84. If sellers do not adjust their quantity supplied at all in response to a change in price, the price elasticity of supply is
a.
zero, and the supply curve is horizontal.
b.
zero, and the supply curve is vertical.
c.
infinity, and the supply curve is horizontal.
d.
infinity, and the supply curve is vertical.
85. Which of the following statements is valid when the market supply curve is vertical?
a.
Market quantity supplied does not change when the price changes.
b.
Supply is perfectly elastic.
c.
An increase in market demand will increase the equilibrium quantity.
d.
An increase in market demand will not increase the equilibrium price.
86. Which of the following statements is not valid when the market supply curve is vertical?
a.
Market quantity supplied does not change when the price changes.
b.
Supply is perfectly inelastic.
c.
An increase in market demand will increase the equilibrium quantity.
d.
An increase in market demand will increase the equilibrium price.
87. If the quantity supplied is the same regardless of price, then supply is
a.
elastic.
b.
perfectly elastic.
c.
perfectly inelastic.
d.
inelastic.
88. If sellers do not adjust their quantities supplied at all in response to a change in price,
a.
advances in technology must be prevalent.
b.
the time period under consideration must be very long.
c.
supply is perfectly elastic.
d.
supply is perfectly inelastic.
89. If the price elasticity of supply is zero, then
a.
supply is more elastic than it is in any other case.
b.
the supply curve is horizontal.
c.
the quantity supplied is the same, regardless of price.
d.
a change in demand will cause a relatively small change in the equilibrium price.
90. Which of the following is an illustration of the market for original paintings by deceased artist Vincent Van Gogh?
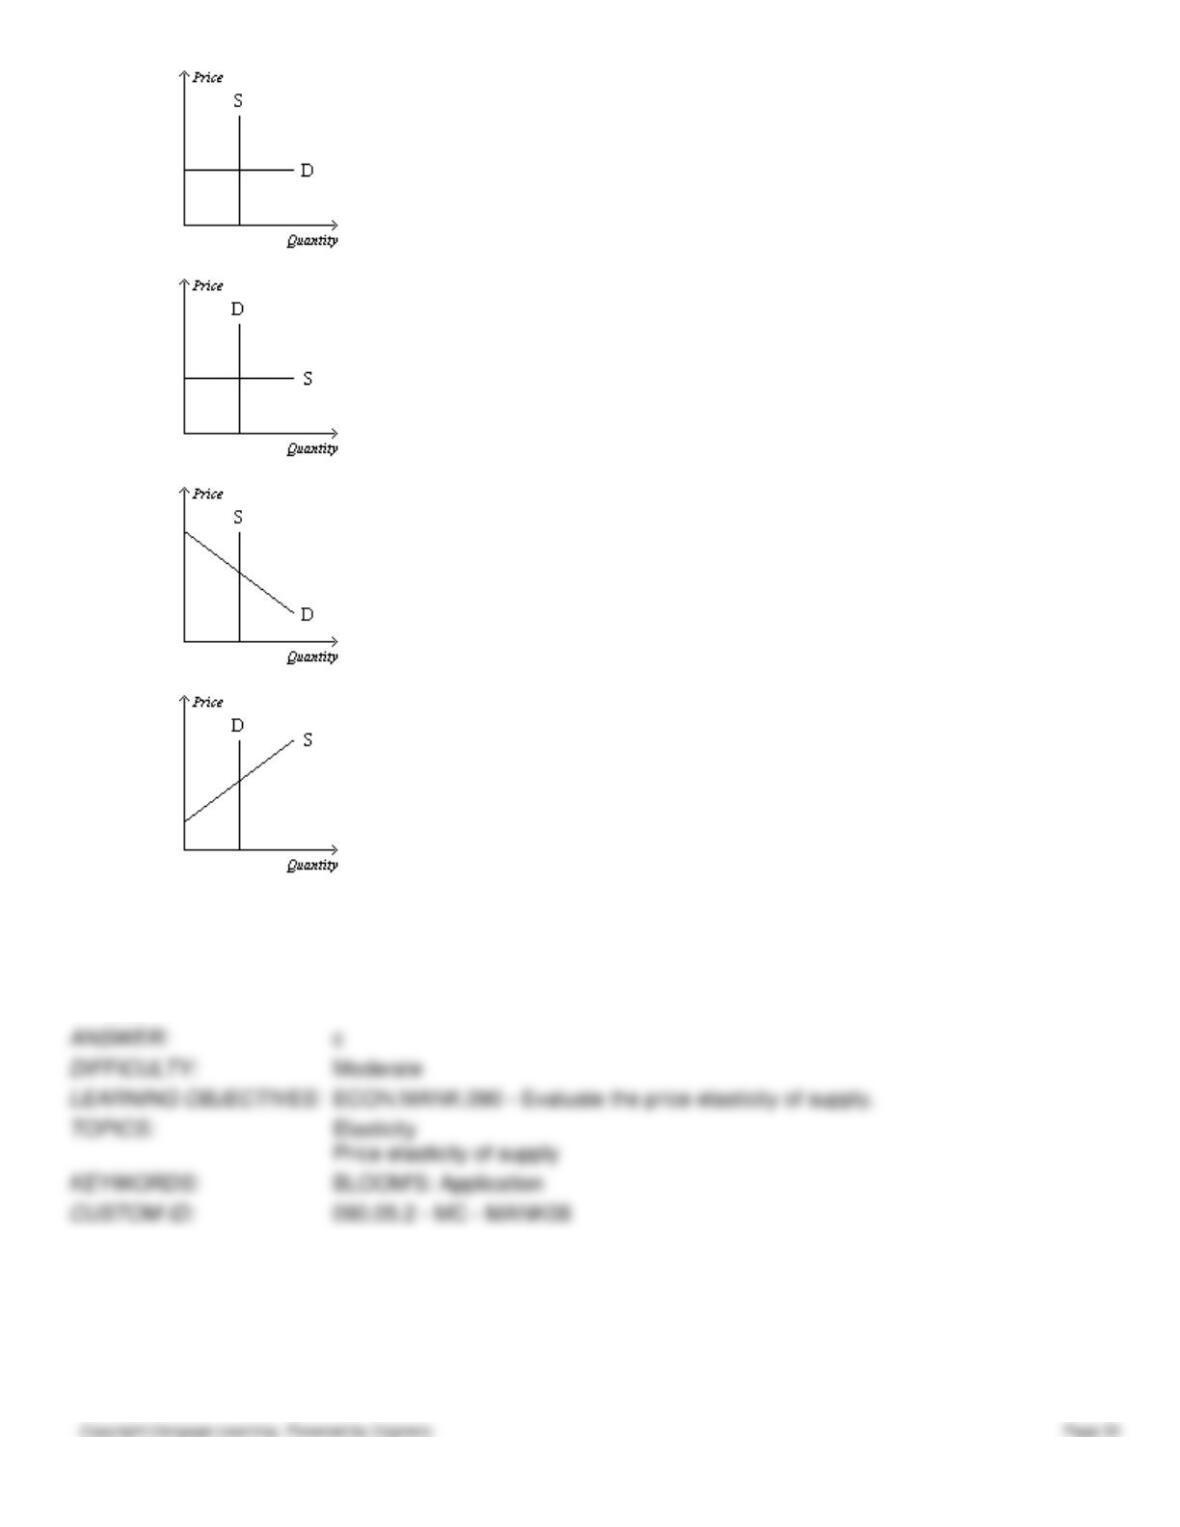
a.
b.
c.
d.
a.
A
b.
B
c.
C
d.
D
Figure 5-19
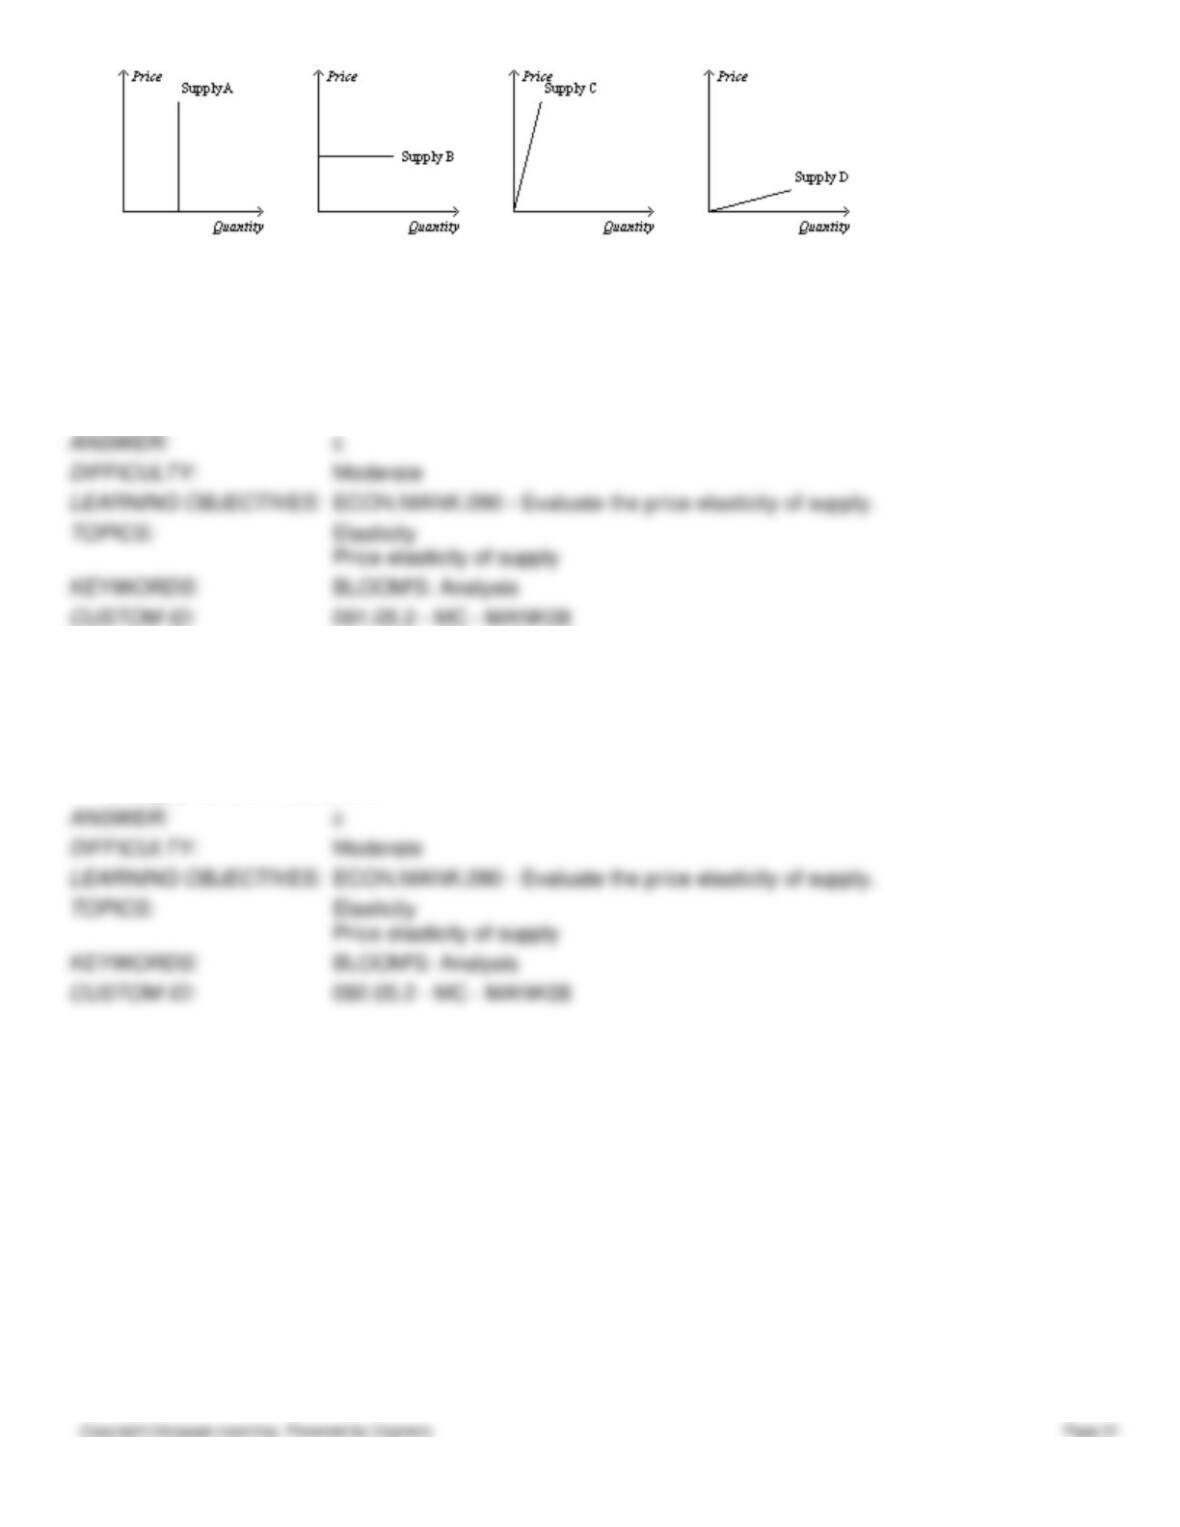
91. Refer to Figure 5-19. Which of the following statements is not correct?
a.
Supply curve A is perfectly inelastic.
b.
Supply curve B is perfectly elastic.
c.
Supply curve C is unit elastic.
d.
Supply curve D is more elastic than supply curve C.
92. Refer to Figure 5-19. Which of the following statements is correct?
a.
Supply curve A is perfectly elastic.
b.
Supply curve B is perfectly inelastic.
c.
Supply curve C is more inelastic than supply curve D.
d.
Supply curve D is unit elastic.
Figure 5-20
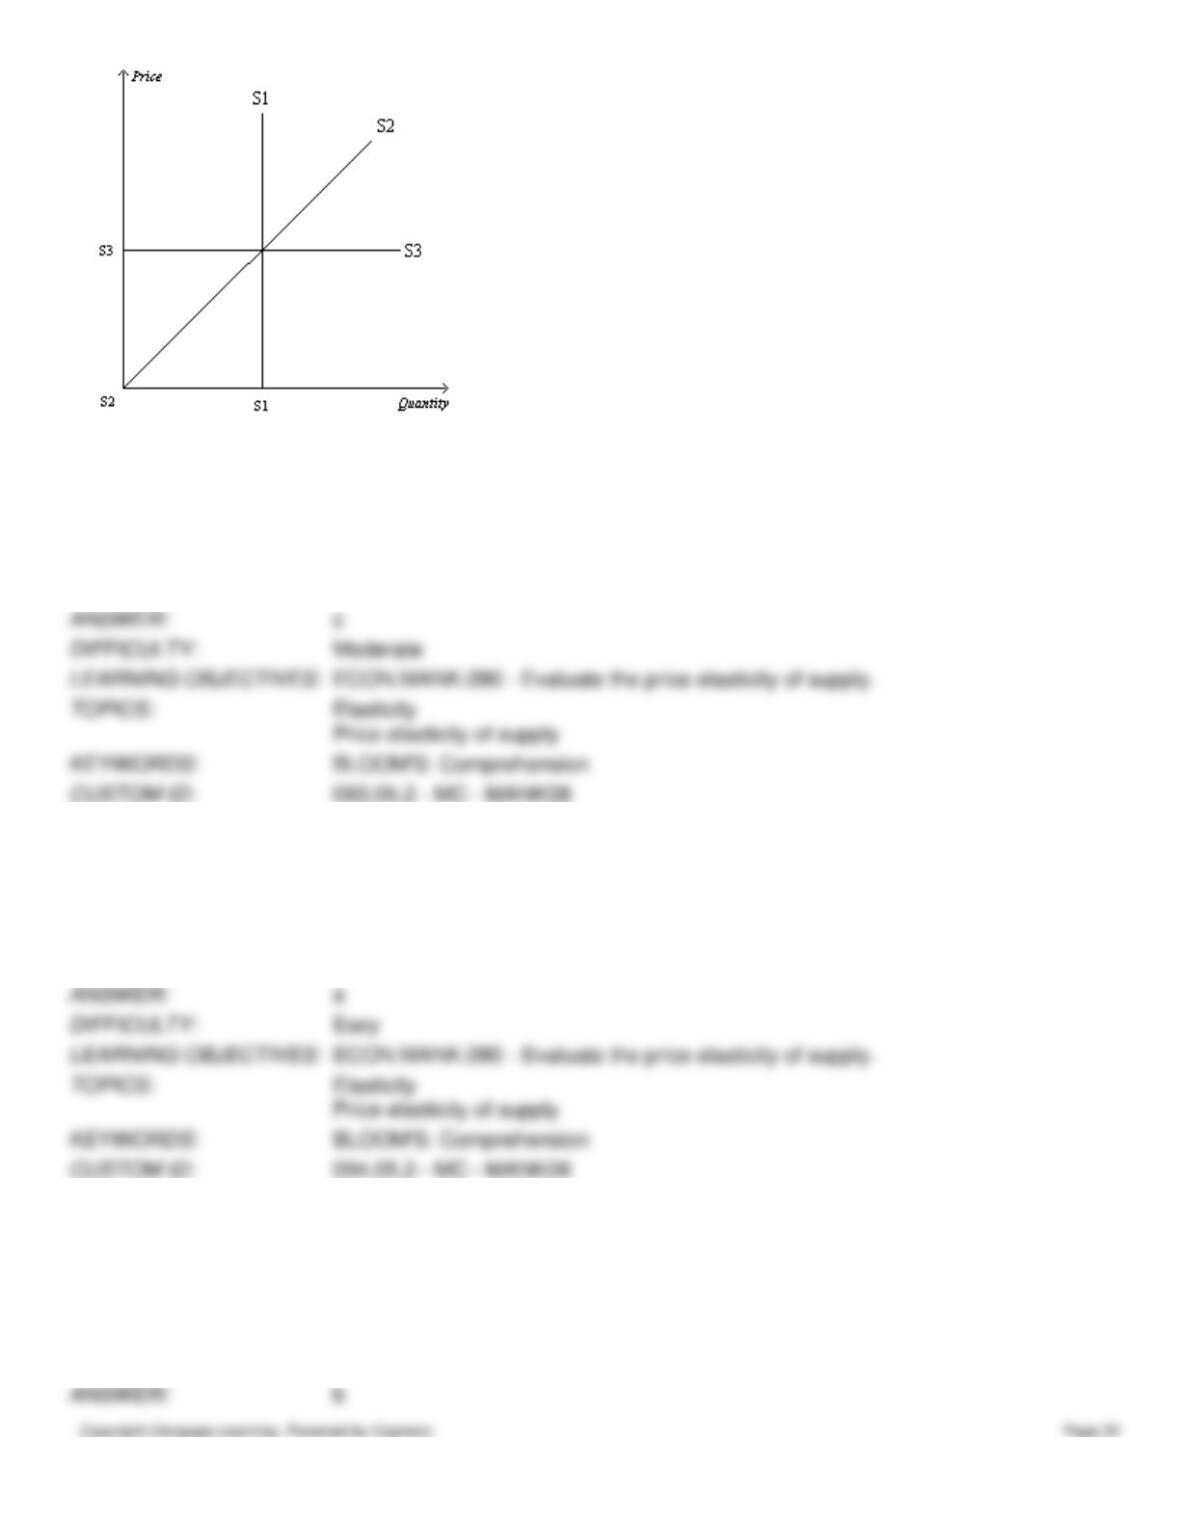
93. Refer to Figure 5-20. Which supply curve is most likely relevant over a very long period of time?
a.
S1
b.
S2
c.
S3
d.
All of the above are equally likely to be relevant over a very long period of time.
94. Refer to Figure 5-20. Which supply curve represents perfectly inelastic supply?
a.
S1
b.
S2
c.
S3
d.
None of the supply curves is perfectly inelastic.
95. A candle manufacturer produces 4,000 units when the market price is $11 per unit and produces 6,000 units when the
market price is $13 per unit. Using the midpoint method, for this range of prices, the price elasticity of supply is about
a.
6.
b.
2.4.
c.
0.4.
d.
0.67.
96. A tax accounting firm produces 500 tax returns units when the market price is $150 per return and produces 700 tax
returns when the market price is $170 per tax return. Using the midpoint method, for this range of prices, the price
elasticity of supply is about
a.
2.67.
b.
0.67.
c.
0.4.
d.
0.125.