$2
3
4
2
1
$4
6
8
4
2
$6
9
12
6
3
$8
12
16
8
4
$10
15
20
10
5
61. Refer to Table 4-7. If these are the only four sellers in the market for ice cream, then the market quantity supplied at a
price of $4 is
a.
4 gallons.
b.
5 gallons.
c.
20 gallons.
d.
80 gallons.
62. Refer to Table 4-7. If these are the only four sellers in the market for ice cream, then the market quantity supplied at a
price of $8 is
a.
10 gallons.
b.
20 gallons.
c.
32 gallons.
d.
40 gallons.
63. Refer to Table 4-7. If these are the only four sellers in the market for ice cream, then when the price decreases from
$10 to $8, the market quantity supplied decreases by
a.
2.5 gallons.
b.
4 gallons.
c.
10 gallons.
d.
50 gallons.
64. Refer to Table 4-7. If these are the only four sellers in the market for ice cream, then when the price increases from
$4 to $6, the market quantity supplied
a.
decreases by 10 gallons.
b.
decreases by 20 gallons.
c.
increases by 10 gallons.
d.
increases by 20 gallons.
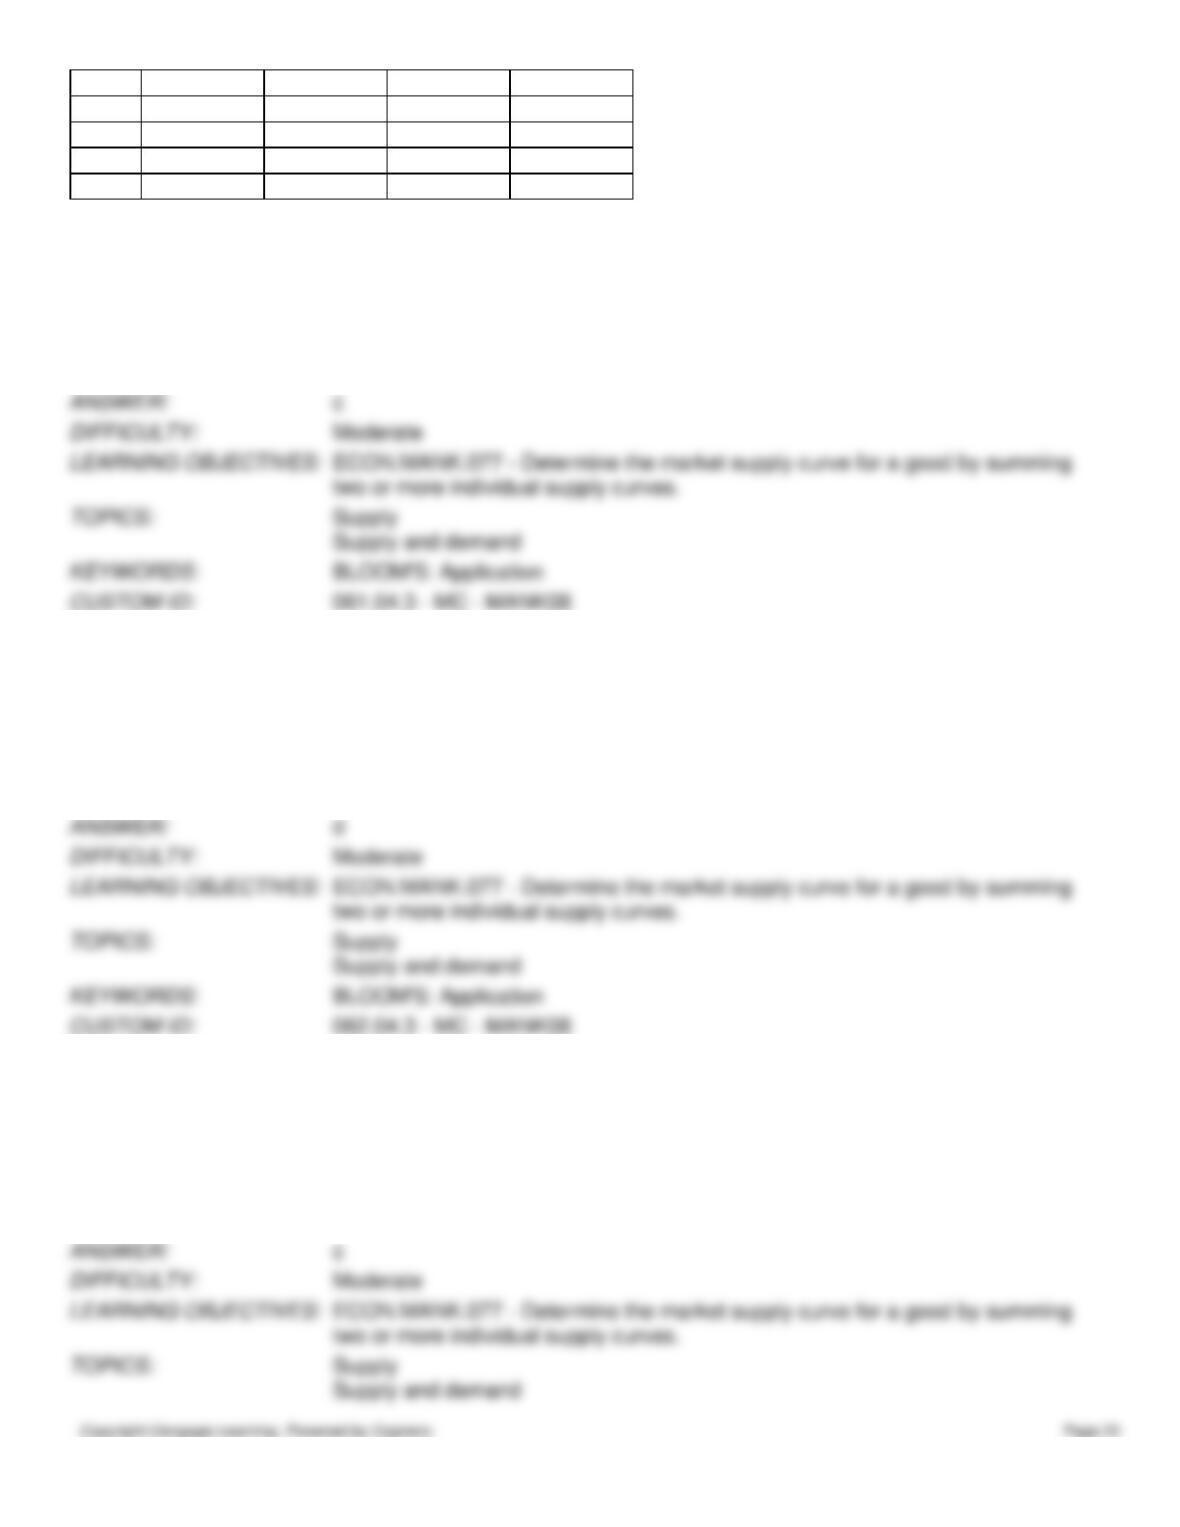
Table 4-8
Price
Firm X’s
Quantity
Supplied
Firm Y’s
Quantity
Supplied
Firm Z’s
Quantity
Supplied
$0
0
0
0
$3
2
4
6
$6
4
8
12
$9
6
12
18
$12
8
16
24
$15
10
20
30
65. Refer to Table 4-8. If these are the only three sellers in the market, then the market quantity supplied at a price of $6
is
a.
6 units.
b.
12 units.
c.
18 units.
d.
24 units.
66. Refer to Table 4-8. If these are the only three sellers in the market, then an increase in the market price from $6 to
$12 will increase quantity supplied by
a.
12 units.
b.
24 units.
c.
36 units.

d.
48 units.
67. Refer to Table 4-8. Suppose Firm X and Firm Y are the only two sellers in the market. If the market price decreases
from $12 to $9, quantity supplied will
a.
decrease by 6 units.
b.
decrease by 12 units.
c.
increase by 6 units.
d.
increase by 12 units.
68. Refer to Table 4-8. Suppose Firm X and Firm Y are the only two sellers in the market. If the market price increases
from $12 to $15, quantity supplied will
a.
decrease by 6 units.
b.
decrease by 12 units.
c.
increase by 6 units.
d.
increase by 12 units.
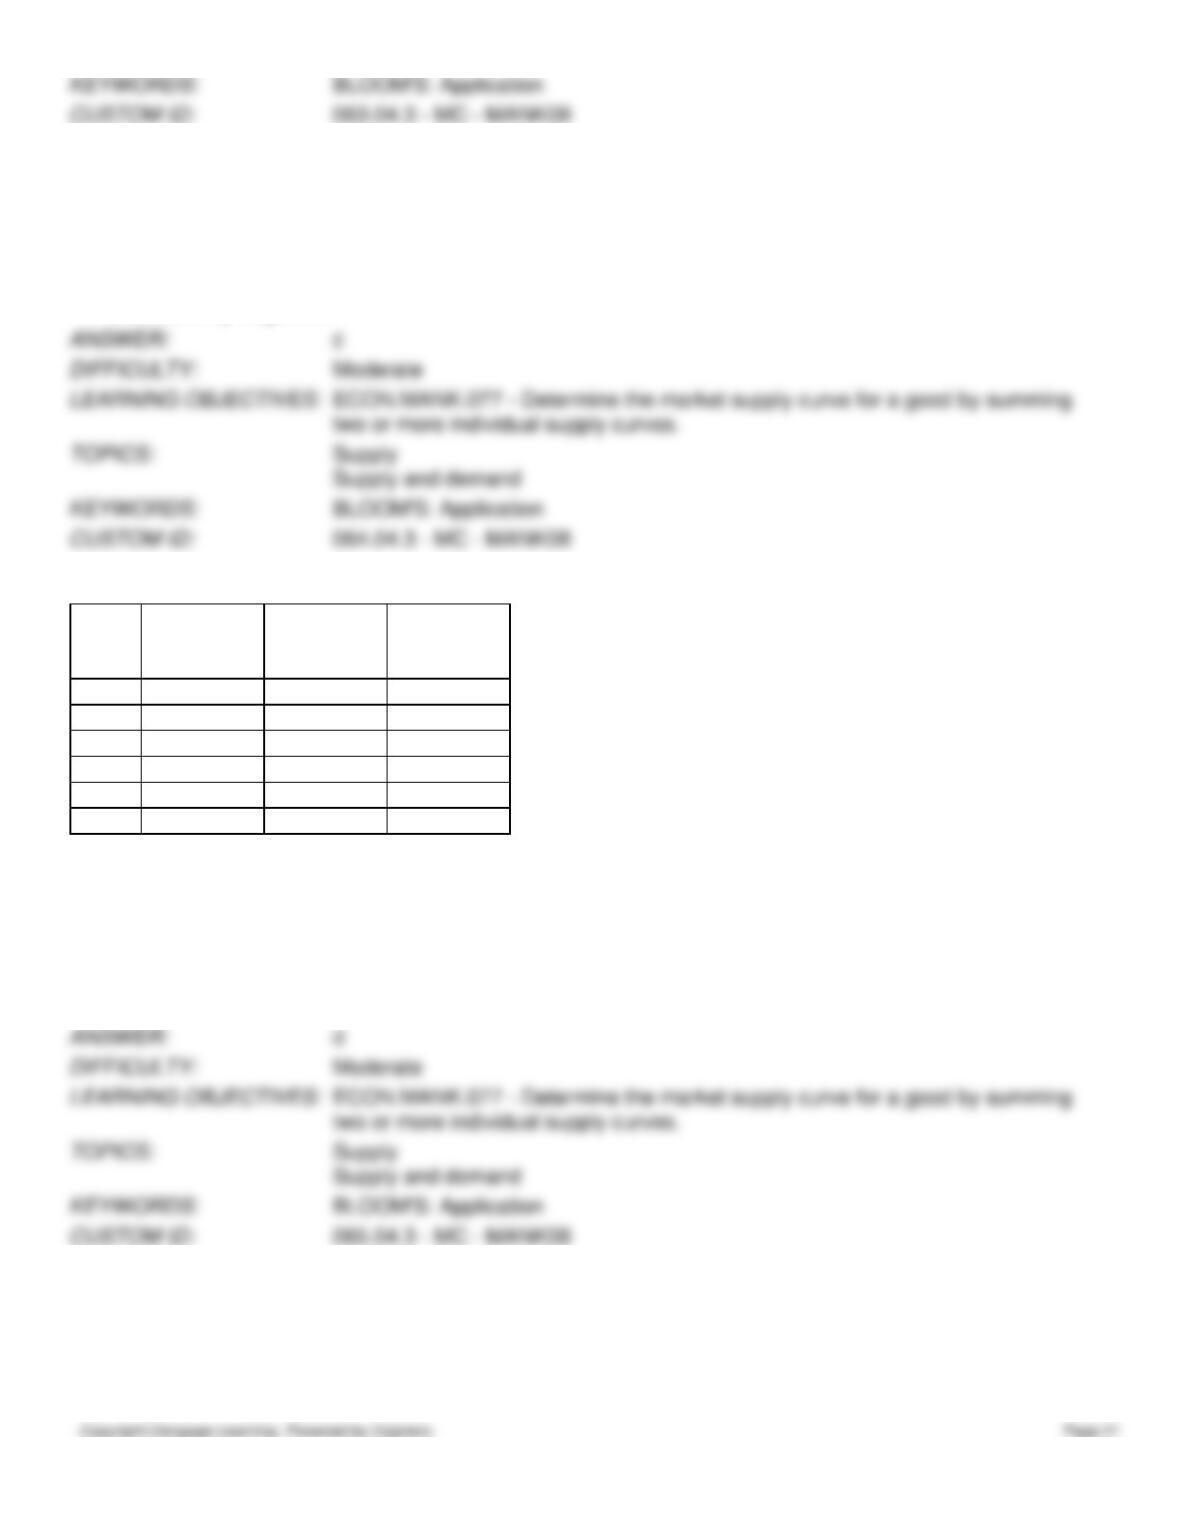
Figure 4-12
Firm A
Firm B
69. Refer to Figure 4-12. If these are the only two sellers in the market, then the market quantity supplied at a price of $4
is
a.
6 units.
b.
7 units.
c.
8 units.
d.
14 units.
70. Refer to Figure 4-12. If these are the only two sellers in the market, then the market quantity supplied at a price of $6
is
a.
2 units.
b.
10 units.
c.
12 units.
d.
22 units.
71. Refer to Figure 4-12. If these are the only two sellers in the market, then the market quantity supplied at a price of $8
is
a.
14 units.
b.
15 units.
c.
16 units.
d.
29 units.
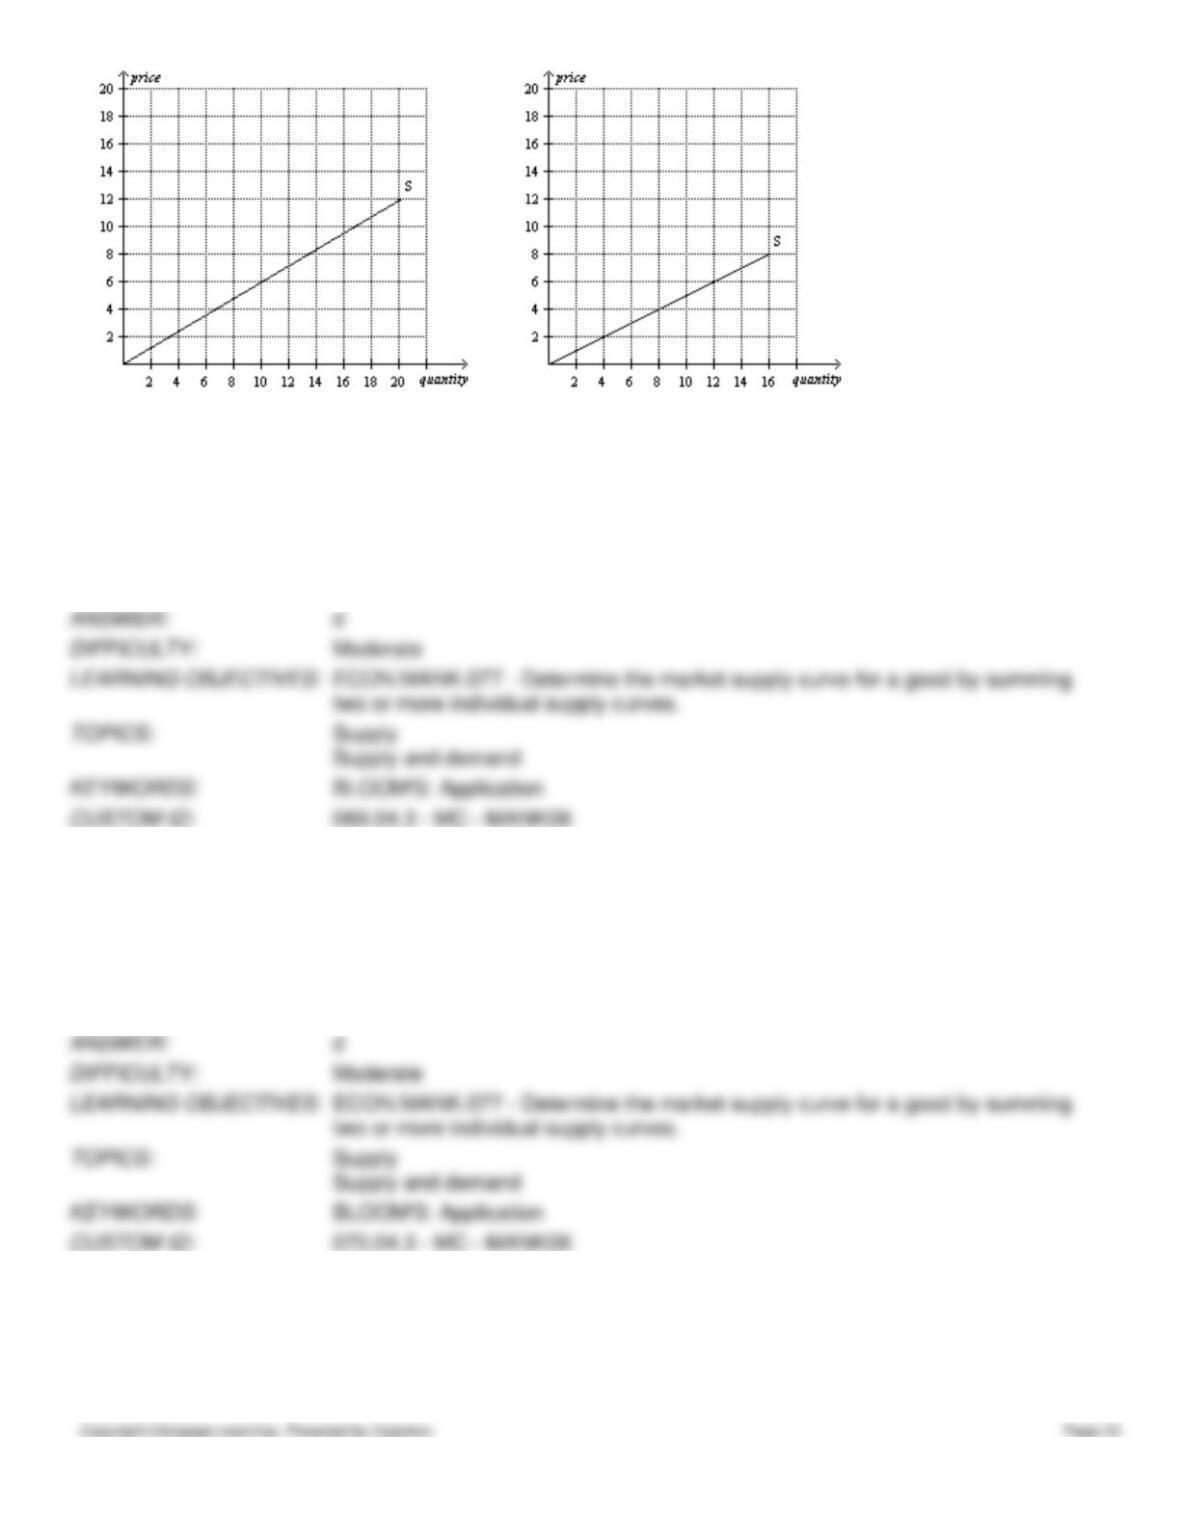
Figure 4-13
72. Refer to Figure 4-13. If Producer A and Producer B are the only producers in the market, then the market quantity
supplied when the price is $2 is
a.
4 units.
b.
6 units.
c.
8 units.
d.
10 units.
73. Refer to Figure 4-13. If Producer A and Producer B are the only producers in the market, then the market quantity
supplied when the price is $4 is
a.
4 units.
b.
8 units.
c.
12 units.
d.
16 units.
74. Refer to Figure 4-13. If Producer A and Producer B are the only producers in the market, then the market quantity
supplied when the price is $6 is
a.
4 units.
b.
6 units.
c.
12 units.
d.
18 units.
75. Refer to Figure 4-13. If Producer A and Producer B are the only producers in the market, then the market quantity
supplied when the price is $8 is
a.
8 units.
b.
16 units.
c.
24 units.
d.
32 units.
76. The supply curve for portable charcoal grills shifts
a.
only when production technology changes.
b.
when a determinant of the supply of portable charcoal grills other than the price of portable charcoal grills
changes.
c.
when any determinant of the supply of portable charcoal grills changes.
d.
only when the number of sellers of portable charcoal grills changes.

77. Lead is an important input in the production of crystal. If the price of lead decreases, then we would expect the supply
of
a.
crystal to be unaffected.
b.
crystal to decrease.
c.
crystal to increase.
d.
lead to increase.
78. Suppose you make jewelry. If the price of gold falls, then we would expect you to
a.
be willing and able to produce less jewelry than before at each possible price.
b.
be willing and able to produce more jewelry than before at each possible price.
c.
face a greater demand for your jewelry.
d.
face a weaker demand for your jewelry.
79. Workers at a bicycle assembly plant currently earn the mandatory minimum wage. If the federal government increases
the minimum wage by $1.00 per hour, then it is likely that the
a.
demand for bicycle assembly workers will increase.
b.
supply of bicycles will shift to the right.
c.
supply of bicycles will shift to the left.
d.
firm must increase output to maintain profit levels.
80. Suppose there is an increase in the price of steel. We would expect the supply curve for steel beams to
a.
shift rightward.
b.
shift leftward.
c.
become flatter.
d.
remain unchanged.
81. Wheat is the main input in the production of flour. If the price of wheat decreases, then we would expect the
a.
demand for flour to increase.
b.
demand for flour to decrease.
c.
supply of flour to increase.
d.
supply of flour to decrease.
82. Matthew bakes apple pies that he sells at the local farmer’s market. If the price of apples increases, the
a.
supply curve for Matthew’s pies will increase.
b.
supply curve for Matthew’s pies will decrease.
c.
demand curve for Matthew’s pies will increase.
d.
demand curve for Matthew’s pies will decrease.
83. Suppose there is a decrease in the price of corn. If corn is an input into the production of ethanol, we would expect the
supply curve for ethanol to
a.
shift rightward.
b.
shift leftward.
c.
become flatter.
d.
remain unchanged.
84. Which of the following would shift the supply of Green Bay Packers football jerseys to the left?
a.
The Green Bay Packers make it to the Super Bowl.
b.
The price of the jerseys increases by $15.
c.
The technology of sewing machines use to make the jerseys improves.
d.
The cost of the fabric used to make the jerseys increases.
85. Suppose an increase in the price of rubber coincides with an advance in the technology of tire production. As a result
of these two events, the demand for tires
a.
decreases, and the supply of tires increases.
b.
is unaffected, and the supply of tires decreases.
c.
is unaffected, and the supply of tires increases.
d.
None of the above is necessarily correct.
86. A improvement in production technology will shift the
a.
supply curve to the right.
b.
supply curve to the left.
c.
demand curve to the right.
d.
demand curve to the left.

87. An improvement in production technology will
a.
increase a firm’s costs and increase its supply.
b.
increase a firm’s costs and decrease its supply.
c.
decrease a firm’s costs and increase its supply.
d.
decrease a firm’s costs and decrease its supply.
88. If car manufacturers begin using new labor-saving technology on their assembly lines, we would not expect
a.
a smaller quantity of labor to be used.
b.
the supply of cars to increase.
c.
the firms’ costs to fall.
d.
individual car manufacturers to move up and to the right along their individual supply curves.
89. Which of the following might cause the supply curve for an inferior good to shift to the right?
a.
an increase in input prices
b.
a decrease in consumer income
c.
an improvement in production technology that makes production of the good more profitable
d.
a decrease in the number of sellers in the market
90. Ashley bakes bread that she sells at the local farmer’s market. If she purchases a new convection oven that reduces the
costs of baking bread, the
a.
supply curve for Ashley’s bread will increase.
b.
supply curve for Ashley’s bread will decrease.
c.
demand curve for Ashley’s bread will increase.
d.
demand curve for Ashley’s bread will decrease.
91. Today, producers changed their expectations about the future. This change
a.
can cause a movement along a supply curve.
b.
can affect future supply, but not today’s supply.
c.
can affect today’s supply.
d.
cannot affect either today’s supply or future supply.
92. If suppliers expect the price of their product to fall in the future, then they will
a.
decrease supply now.
b.
increase supply now.
c.
decrease supply in the future but not now.
d.
increase supply in the future but not now.
93. If sellers expect higher basket prices in the near future, the current
a.
supply of baskets will increase.
b.
supply of baskets will decrease.
c.
supply of baskets will be unaffected.
d.
demand for baskets will decrease.
94. Today’s supply curve for gasoline could shift in response to a change in
a.
today’s price of gasoline.
b.
the expected future price of gasoline.
c.
the number of buyers of gasoline.
d.
All of the above are correct.
95. A CPA recently has come to expect higher prices for expert tax advice in the near future. We would expect
a.
the CPA to supply more expert tax advice now than she was supplying previously.
b.
the CPA to supply less expert tax advice now than she was supplying previously.
c.
the demand for this CPA’s expert tax advice to fall.
d.
no change in the CPA’s current supply; instead, future supply will be affected.
96. Recent forest fires in the western states are expected to cause the price of lumber to rise in the next six months. As a
result, we can expect the supply of lumber to
a.
fall in six months but not now.
b.
increase in six months when the price goes up.
c.
fall now.
d.
increase now to meet as much demand as possible.

97. Funsters, Inc., the largest toy company in the country, sells its most popular doll for $15. It has just learned that its
leading competitor, Toysorama, is mass-producing an excellent copy and plans to flood the market with their $5 doll in
six weeks. Funsters should
a.
“fight fire with fire” by decreasing supply of its doll for six weeks and then increasing the supply.
b.
increase the supply of its doll now before the other doll hits the market.
c.
increase the price of its doll now.
d.
discontinue its doll.
98. Today’s supply curve for iPods could shift in response to a change in
a.
today’s price of iPods.
b.
the expected future price of iPods.
c.
the number of buyers of iPods.
d.
All of the above are correct.
99. Which of the following is a determinant of the market supply curve but not a determinant of an individual seller’s
supply?
a.
production technology
b.
expectations
c.
input prices
d.
the number of sellers

100. If the number of sellers in a market increases, then the
a.
demand in that market will increase.
b.
supply in that market will increase.
c.
supply in that market will decrease.
d.
demand in that market will decrease.
101. A decrease in the number of sellers in the market causes
a.
the supply curve to shift to the left.
b.
the supply curve to shift to the right.
c.
a movement up and to the right along a stationary supply curve.
d.
a movement downward and to the left along a stationary supply curve.
102. An increase in which of the following would shift the supply curve for gasoline to the right?
a.
demand for gasoline
b.
price of gasoline
c.
number of producers of gasoline
d.
price of oil, an input into the production of gasoline
103. Which of the following events could cause an increase in the supply of ceiling fans?
a.
The number of sellers of ceiling fans increases.
b.
There is an increase in the price of air conditioners, and consumers regard air conditioners and ceiling fans as
substitutes.
c.
There is an increase in the price of the motor that powers ceiling fans.
d.
All of the above are correct.
Figure 4-14
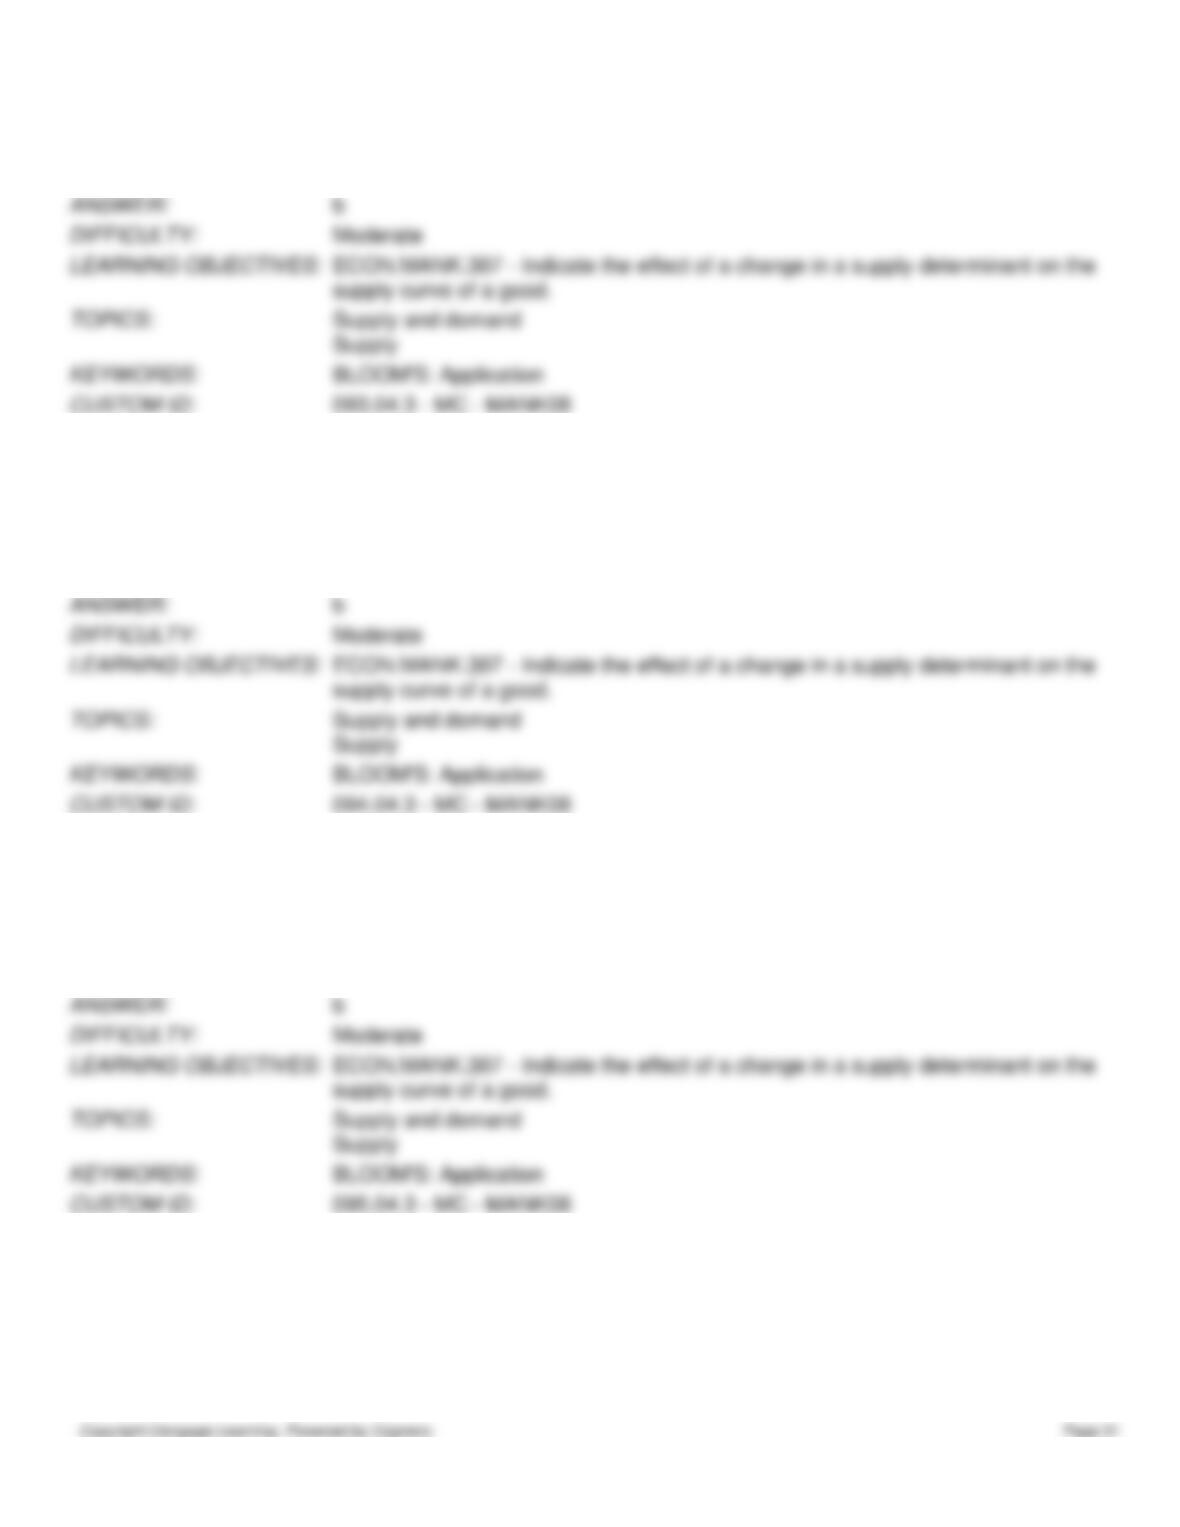
104. Refer to Figure 4-14. Which of the following best describes the movement from E1 to E2?
a.
a decrease in supply
b.
an increase in supply
c.
a movement along the supply curve
d.
a decrease in demand
105. Refer to Figure 4-14. Which of the following would explain a movement from E1 to E2?
a.
There is an improvement in the technology used to produce this good.
b.
The cost of an input to the production of this good increases.
c.
This good becomes very popular.
d.
The price of a substitute good decreases.
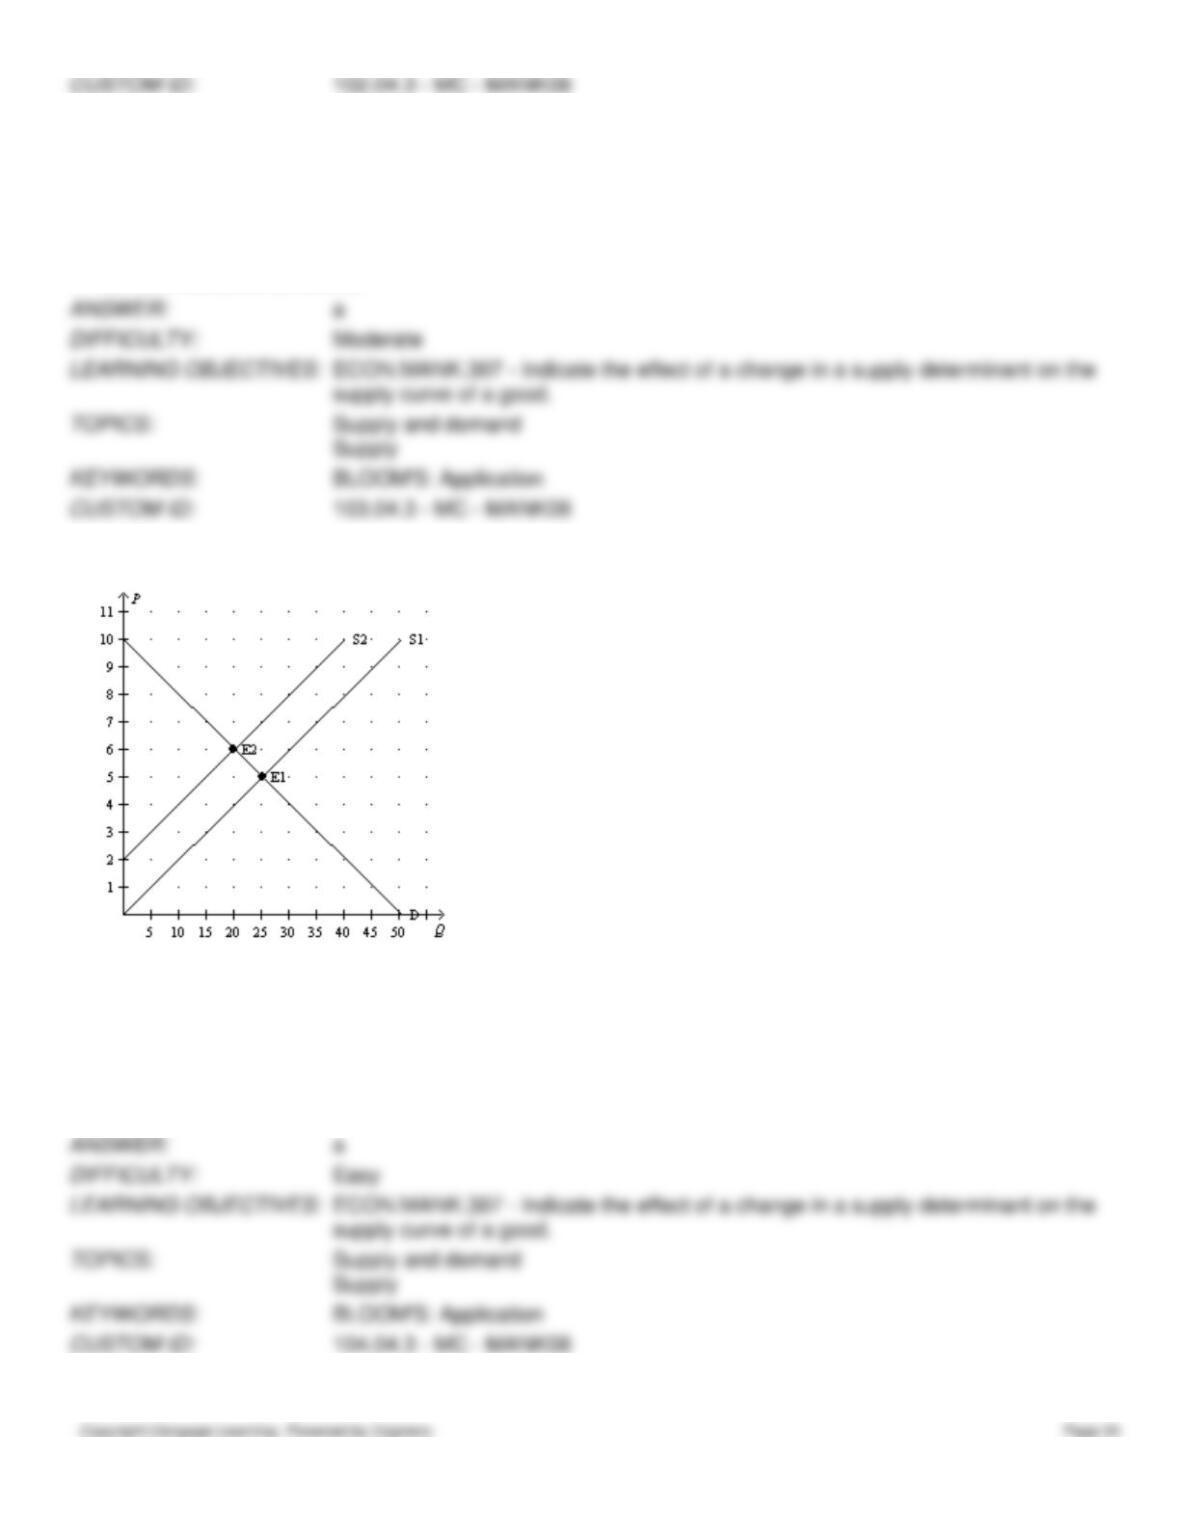
Figure 4-15
106. Refer to Figure 4-15. Which of the following would cause the supply curve to shift from Supply A to Supply C in
the market for beach towels?
a.
an increase in the price of beach towels
b.
an expectation by firms that the price of beach towels will increase in the very near future
c.
a decrease in the price of cotton
d.
a decrease in the number of firms selling beach towels
107. Refer to Figure 4-15. Which of the following would cause the supply curve to shift from Supply A to Supply C in
the market for sail boats?
a.
an increase in the price of sailboats
b.
a decrease in the number of firms selling sailboats
c.
a decrease in the price of fiberglass and sail cloth

d.
a decrease in the price of America’s Cup sailing t-shirts
108. Refer to Figure 4-15. Which of the following would cause the supply curve to shift from Supply B to Supply A in
the market for butter?
a.
a decrease in the price of butter
b.
an increase in the price of margarine
c.
an increase in the price of milk
d.
an improvement in technology that allows firms to use less labor in the production of butter
109. Refer to Figure 4-15. Which of the following would cause the supply curve to shift from Supply B to Supply A in
the market for beer?
a.
a decrease in the price of beer
b.
an expectation by firms that the price of beer will increase in the very near future
c.
a decrease in the price of hops
d.
an improvement in technology that allows firms to use less labor in the production of beer
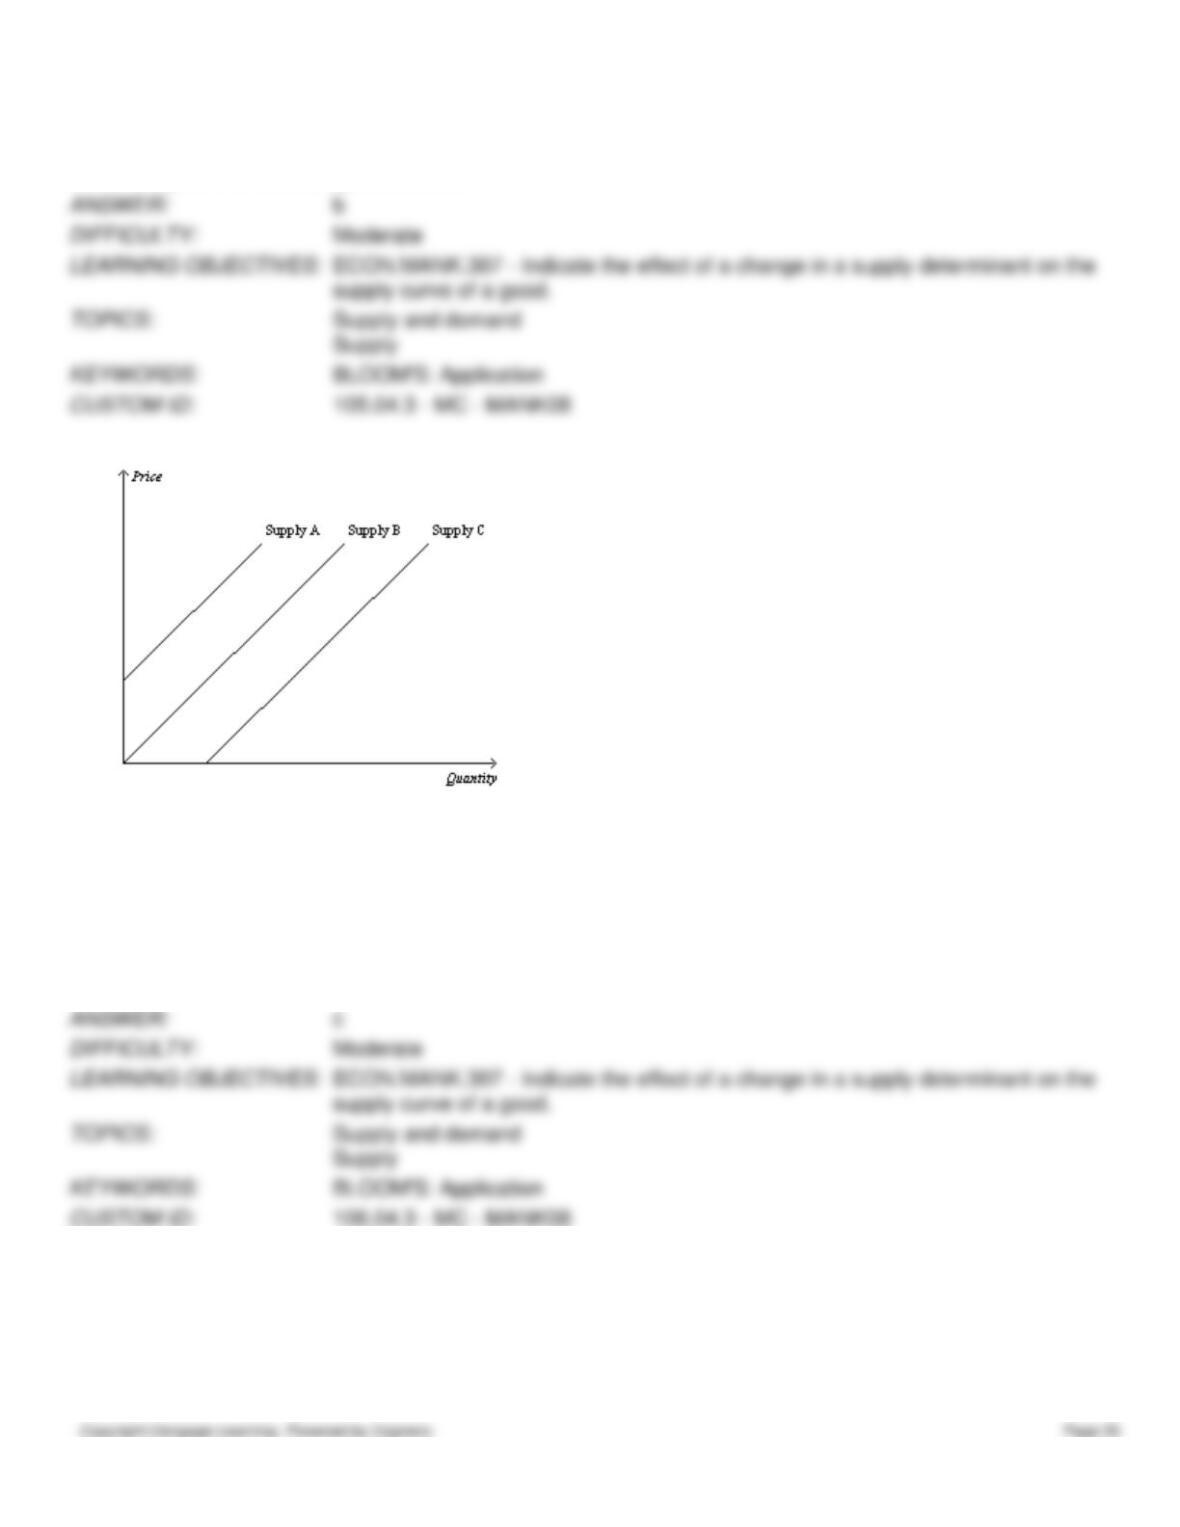
Figure 4-16
110. Refer to Figure 4-16. The shift from S to S’ is called a(n)
a.
decrease in supply.
b.
decrease in quantity supplied.
c.
increase in supply.
d.
increase in quantity supplied.
111. Refer to Figure 4-16. The shift from S to S’ could be caused by an
a.
increase in the price of the good.
b.
improvement in production technology.
c.
increase in income.
d.
increase in input prices.
112. Refer to Figure 4-16. The shift from S to S’ in the market for peaches could be caused by a(n)
a.
increase in the price of peaches.
b.
decrease in the price of pears.
c.
increase in income.
d.
decrease in the labor costs of the workers who pick peaches.

113. Refer to Figure 4-16. The shift from S’ to S in the market for chocolate cake could be caused by a(n)
a.
decrease in the number of commercial bakers.
b.
improvement in oven technology.
c.
decrease in the price of butter.
d.
decrease in the price of chocolate cake.
114. Refer to Figure 4-16. If the supply curves that are drawn represent supply curves for single-family residential
houses, then the movement from S to S’ could be caused by a(n)
a.
increase in the price of apartments which are a substitute for single-family houses for many people looking for
a place to live.
b.
newly-formed expectation by house-builders that prices of houses will increase significantly in the next six
months.
c.
decrease in the price of lumber.
d.
All of the above are correct.