CHAPTER 3—DEMAND AND SUPPLY Key
1. If demand increases while supply decreases for a particular good, the:
2. Surplus is a condition of:
3. The quantity of product X supplied can be expected to rise with a fall in:
4. Derived demand is directly determined by:
5. A demand curve expresses the relation between the quantity demanded and:
6. Change in the quantity supplied reflects a:
7. Holding all else equal, an unnecessary increase in federally-mandated auto safety requirements leads to a
decrease in:
8. Holding all else equal, an increase in mandatory payments by employers for universal health care coverage
for workers would lead to a decrease in the:
9. The effect on sales of an increase in price is a decrease in:
10. Utility is measured by:
11. Demand is the total quantity of goods or services that customers:
12. Demand for consumption goods and services is:
13. The demand function for a product states the relation between the aggregate quantity demanded and:
14. Change in the quantity demanded is caused by a change in:
15. Change in the quantity supplied is caused by a change in:
16. The supply of a product does not depend on:
17. If the production of two goods is complementary a decrease in the price of one will:
18. Oil refiners can vary the mix of gasoline versus diesel fuel derived from a barrel of oil. If the price of diesel
fuel increases relative to the price of gasoline:
19. The supply curve expresses the relation between the aggregate quantity supplied and:
20. The equilibrium market price of a service is the:
21. If the market price is higher than the equilibrium price a:
22. The equilibrium market price and quantity of beef would increase if:
23. The equilibrium market price of lead pencils would decrease and the quantity of pencils produced and sold
would increase if:
24. If demand and supply both increase, the:
25. Holding all else equal, if supply increases, the:
26. Demand and Supply Curves. The following relations describe demand and supply conditions in the
lumber/forest products industry:
QD
= 75,000 – 10,000P
(Demand)
QS
= -15,000 + 50,000P
(Supply)
where Q is quantity measured in thousands of board feet (one square foot of lumber, one inch thick) and P is price in dollars.
A.
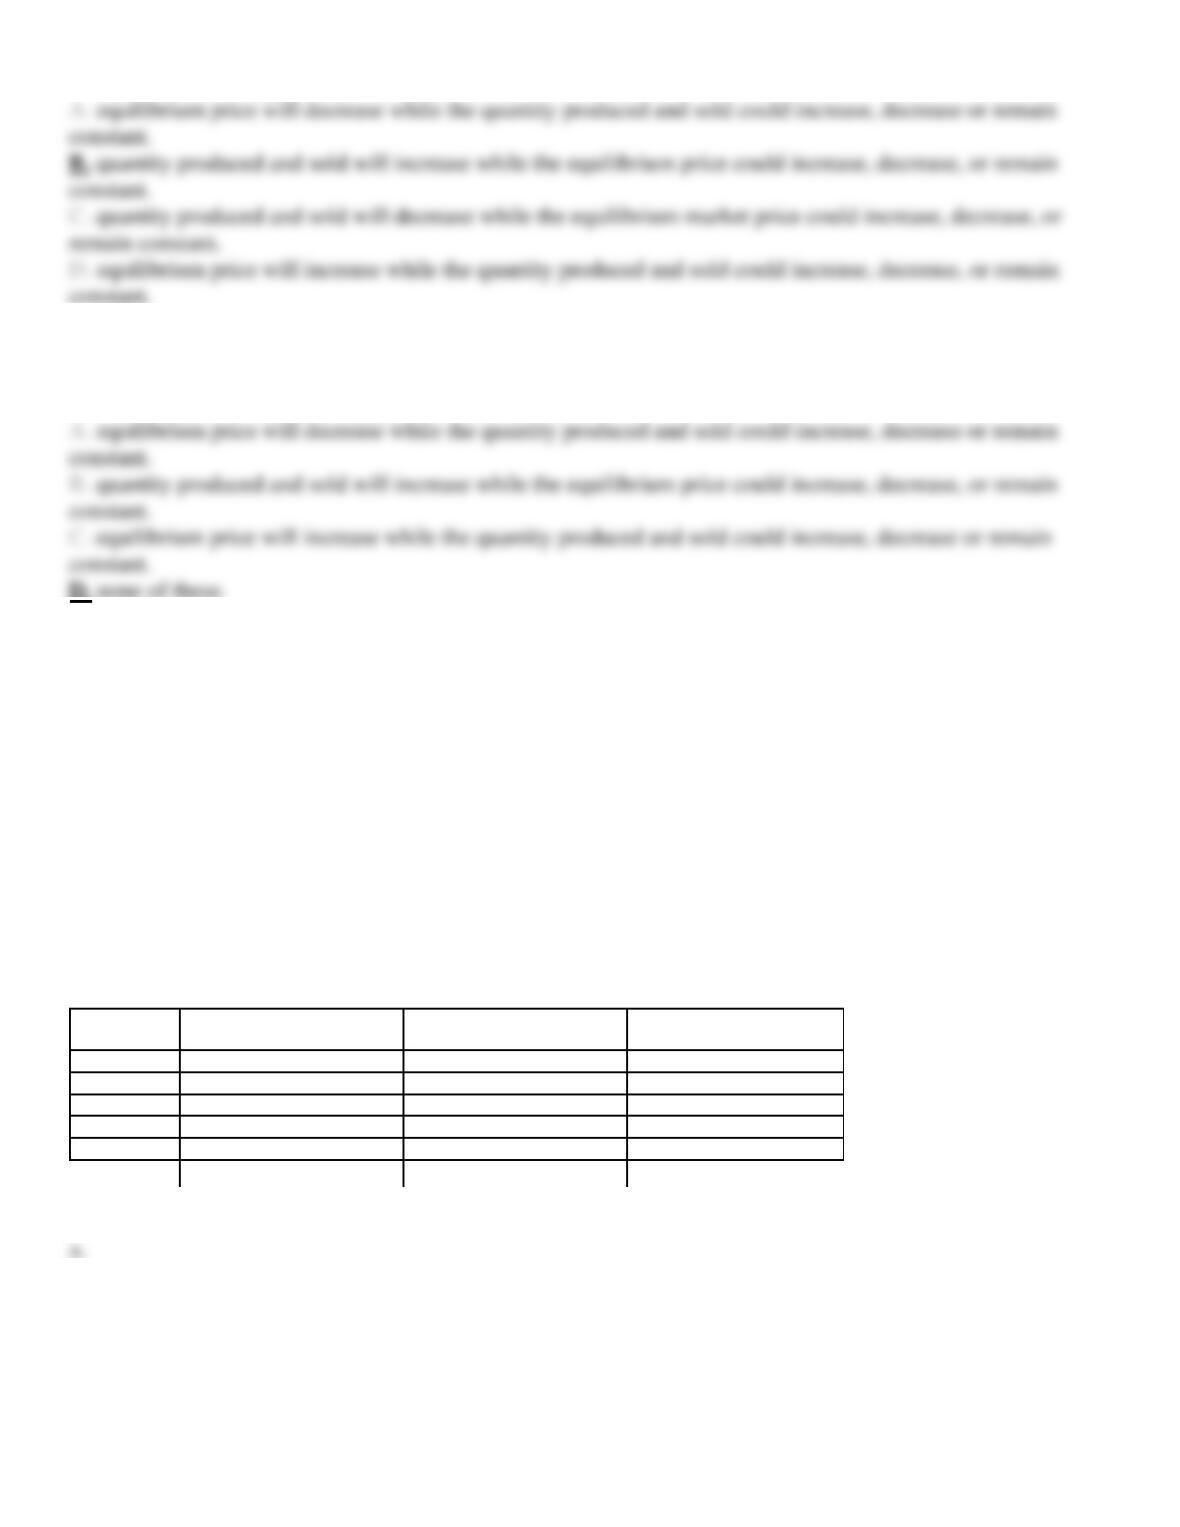
Complete the following table:
Price (1)
Quantity Supplied (2)
Quantity Demanded (3)
Surplus (+) or Shortage (-)
(4) = (2) – (3)
$3.00
2.50
2.00
1.50
1.00
27. Demand and Supply Curves. The following relations describe demand and supply conditions in the wheat
industry:
QD
= 5,500 – 1,000P
(Demand)
QS
= -4,500 + 1,500P
(Supply)
where Q is quantity measured in millions of bushels and P is price in dollars.
A.
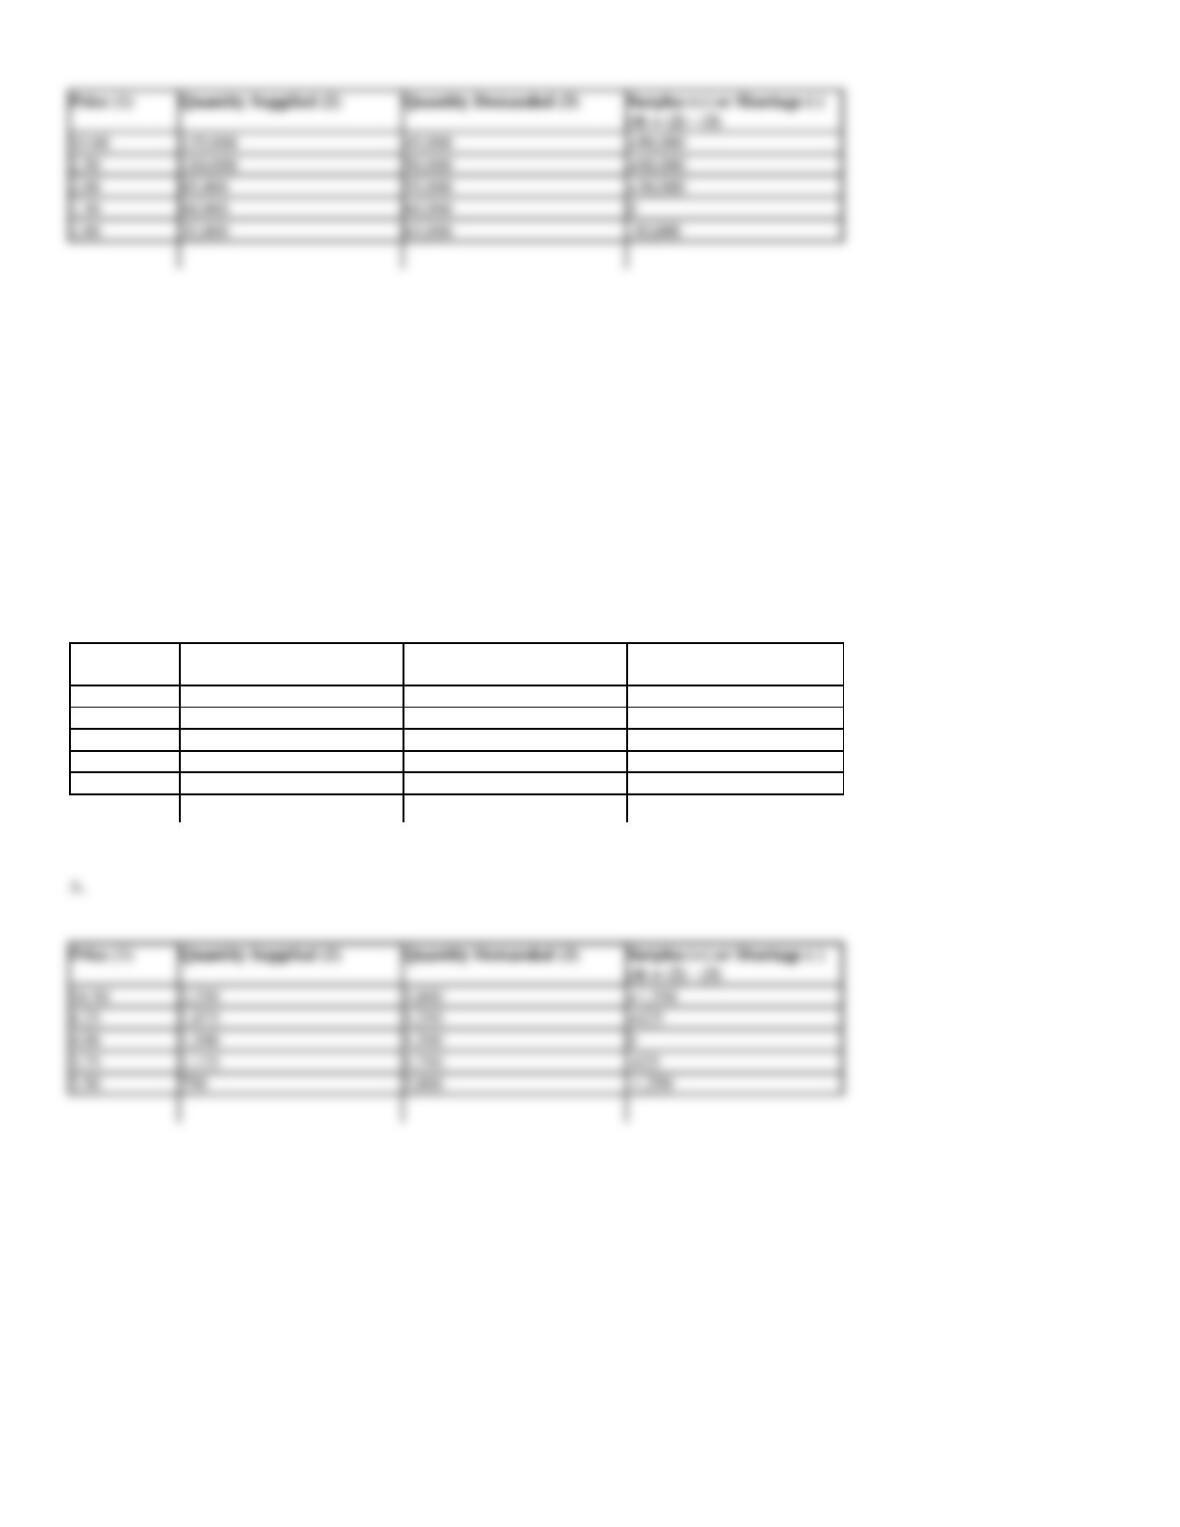
Complete the following table:
Price (1)
Quantity Supplied (2)
Quantity Demanded (3)
Surplus (+) or Shortage (–)
(4) = (2) – (3)
$4.50
4.25
4.00
3.75
3.50
A.
$4.50
2,250
1,000
+1,250
4.25
1,875
1,250
+625
4.00
1,500
1,500
0
3.75
1,125
1,750
-625
3.50
2,000
-1,250
28. Demand and Supply Curves. The following relations describe demand and supply conditions in the milk
industry:
QD
= 315,000 – 250,000P
(Demand)
QS
= -165,000 + 550,000P
(Supply)
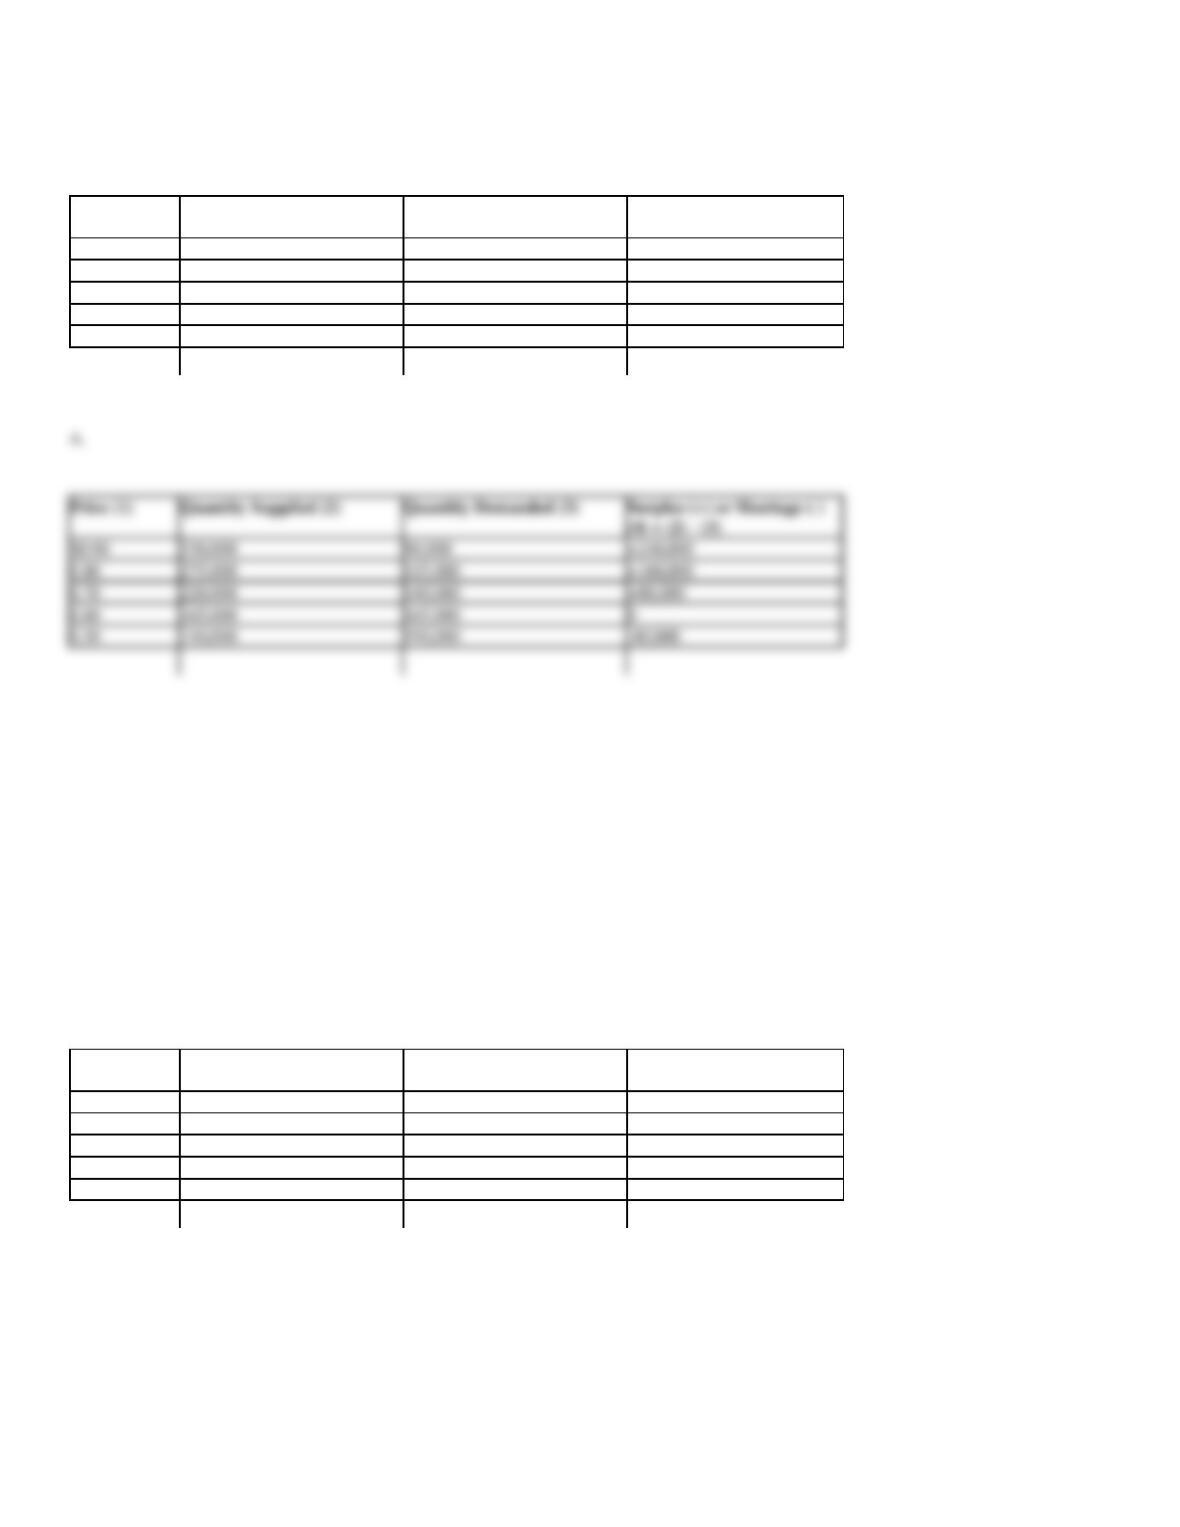
Price (1)
Quantity Supplied (2)
Quantity Demanded (3)
Surplus (+) or Shortage (-)
$3.00
135,000
45,000
+90,000
2.50
110,000
50,000
+60,000
2.00
85,000
55,000
+30,000
1.50
60,000
60,000
0
1.00
35,000
65,000
-30,000
where Q is quantity measured in millions of gallons and P is price in dollars.
A.
Complete the following table:
Price (1)
Quantity Supplied (2)
Quantity Demanded (3)
Surplus (+) or Shortage (–)
(4) = (2) – (3)
$0.90
0.80
0.70
0.60
0.50
29. Demand and Supply Curves. The following relations describe demand and supply conditions in the oil
industry:
QD
= 525,000 – 7,500P
(Demand)
QS
= -150,000 + 15,000P
(Supply)
where Q is quantity measured in millions of barrels and P is price in dollars.
A.
Complete the following table:
Price (1)
Quantity Supplied (2)
Quantity Demanded (3)
Surplus (+) or Shortage (–)
(4) = (2) – (3)
$35
30
25
20
15
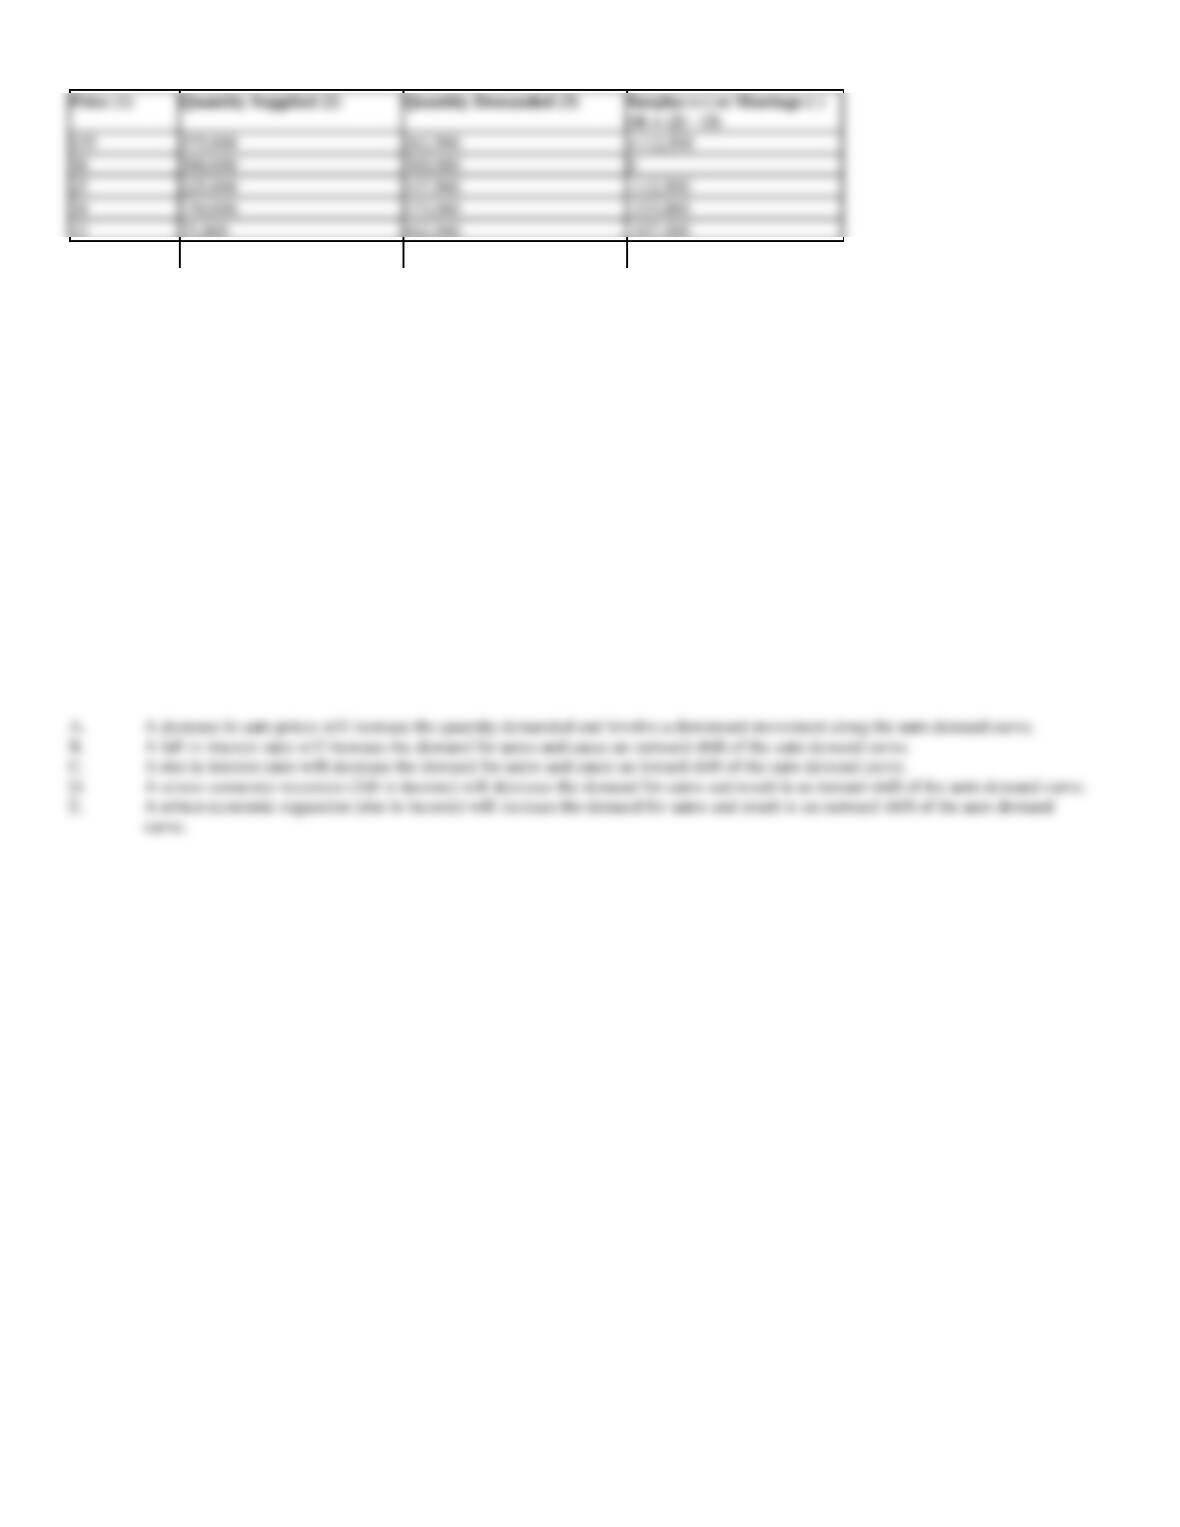
A.
A.
$0.90
330,000
90,000
+240,000
0.80
275,000
115,000
+160,000
0.70
220,000
140,000
+80,000
0.60
165,000
165,000
0
0.50
110,000
190,000
-80,000
30. Demand Analysis. The demand for automobiles is often described as highly cyclical, and very sensitive to
automobile prices and interest rates. Given these characteristics, describe the effect of each of the following in
terms of whether it would increase or decrease the quantity demanded or the demand for automobiles.
Moreover, when price is expressed as a function of quantity, indicate whether the effect of each of the following
is an upward or downward movement along a given demand curve or instead involves an outward or inward
shift in the relevant demand curve for autos. Explain your answers.
A.
A decrease in auto prices
B.
A fall in interest rates
C.
A rise in interest rates
D.
A severe economic recession
E.
A robust economic expansion
A.
A decrease in auto prices will increase the quantity demanded and involve a downward movement along the auto demand curve.
B.
A fall in interest rates will increase the demand for autos and cause an outward shift of the auto demand curve.
C.
A rise in interest rates will decrease the demand for autos and cause an inward shift of the auto demand curve.
D.
A severe economic recession (fall in income) will decrease the demand for autos and result in an inward shift of the auto demand curve.
31. Demand Analysis. The demand for refrigerators is often described as cyclical, and very sensitive to
refrigerator prices and interest rates. Given these characteristics, describe the effect of each of the following in
terms of whether it would increase or decrease the quantity demanded or the demand for refrigerators.
Moreover, when price is expressed as a function of quantity, indicate whether the effect of each of the following
is an upward or downward movement along a given demand curve or instead involves an outward or inward
shift in the relevant demand curve for refrigerators. Explain your answers.
A.
An increase in refrigerator prices
B.
A fall in interest rates
C.
A rise in interest rates
D.
A severe economic recession
E.
A robust economic expansion
375,000
262,500
+112,500
300,000
300,000
0
225,000
337,500
-112,500
150,000
375,000
-225,000
75,000
412,500
-337,500
32. Demand Analysis. The demand for high-definition television sets (HDTV) is often described as highly
cyclical, and very sensitive to HDTV prices and interest rates. Given these characteristics, describe the effect of
each of the following in terms of whether it would increase or decrease the quantity demanded or the demand of
HDTVs. Moreover, when price is expressed as a function of quantity, indicate whether the effect of each of the
following is an upward or downward movement along a given demand curve or instead involves an outward or
inward shift in the relevant demand curve for HDTVs. Explain your answers.
A.
A decrease in HDTV prices
B.
A fall in interest rates
C.
A rise in interest rates
D.
A severe economic recession
E.
A robust economic expansion
A.
A decrease in HDTV prices will increase the quantity demanded and involve a downward movement along the HDTV demand curve.
B.
A fall in interest rates will increase the demand for HDTVs and cause an outward shift of the demand curve.
C.
A rise in interest rates will decrease the demand for HDTVs and cause an inward shift of the demand curve.
D.
A severe economic recession (fall in income) will decrease the demand for HDTVs and result in an inward shift of the demand curve.
E.
A robust economic expansion (rise in income) will increase the demand for HDTVs and result in an outward shift of the demand curve.
33. Comparative Statics. Demand and supply conditions in the market for unskilled labor are important
concerns to business and government decision makers. Consider the case of a federally mandated minimum
wage set above the equilibrium or market clearing wage level. Some of the following factors have the potential
to influence the demand or quantity demanded of unskilled labor. Influences on the supply or quantity supplied
may also result. Holding all else equal, describe these influences as increasing or decreasing, and indicate the
direction of the resulting movement along or shift in the relevant curve(s).
A.
An increase in the popularity of self-service gas stations, car washes, and so on.
B.
A fall in welfare benefits
C.
An increase in the minimum wage
D.
A rise in interest rates
E.
A decrease in the quality of secondary education
B.
A fall in interest rates will increase the demand for refrigerators and cause an outward shift of the demand curve.
C.
A rise in interest rates will decrease the demand for refrigerators and cause an inward shift of the demand curve.
34. Comparative Statics. Demand and supply conditions in the steel market are important concerns to business
and government decision makers. Some of the following factors have the potential to influence the demand or
quantity demanded of raw steel. Influences on the supply or quantity supplied may also result. Holding all else
equal, describe these influences as increasing or decreasing, and indicate the direction of the resulting
movement along or shift in the relevant curve(s).
A.
Increases in the U. S. Department of Transportation’s mileage requirements for car fleets.
B.
Public outcry at the poor condition of the nation’s interstate freeway system.
C.
New alloys that increase steel’s tensile strength are created.
D.
A severe recession.
E.
A new technology reduces the production cost of raw steel by one-third.
D.
A severe recession would lower new construction rates and thus decrease the demand for steel (leftward shift).
B.
A fall in welfare benefits makes working more attractive, and will cause an increase or rightward shift in the supply of unskilled labor.
35. Comparative Statics. Demand and supply conditions in the market for utility-generated electric power are
important concerns to business and government decision makers. Some of the following factors have the
potential to influence the demand or quantity demanded of electric power. Influences on the supply or quantity
supplied may also result. Holding all else equal, describe these influences as increasing or decreasing, and
indicate the direction of the resulting movement along or shift in the relevant curve(s).
A.
An increase in the strategic desirability for large manufacturers to co-generate (or self-generate) power.
B.
Congress mandates reduced emissions from coal combustion.
C.
Environmentalist groups spark a conservation effort nationwide.
D.
A health study finds a positive correlation between number of hours under a heat lamp and reduced risk of cancer.
E.
An advance in solar technology creates very efficient collection devices, allowing for cheap and efficient roof-top solar energy.
36. Comparative Statics. Coupon Promotions, Inc., is a coupon book publisher with markets in several
southwestern states. CPI coupon books are sold directly to the public, sold through religious and other
charitable organizations, or given away as promotional items. Operating experience during the past year
suggests the following demand function for its coupon books:
Q = 10,000 – 5,000P + 0.02Pop + 0.4I + 0.6A
where Q is quantity, P is price ($), Pop is population, I is disposable income per capita ($), and A is advertising expenditures ($).
A.
Determine the demand curve faced by CPI in a typical market where P = $5, Pop = 1,000,000 persons, I = $35,000 and A = $10,000.
Show the demand curve with quantity expressed as a function of price, and price expressed as a function of quantity.
B.
Calculate the quantity demanded at prices of $5, $2.50, and $0.
C.
Calculate the prices necessary to sell 10,000, 25,000, and 50,000 units.
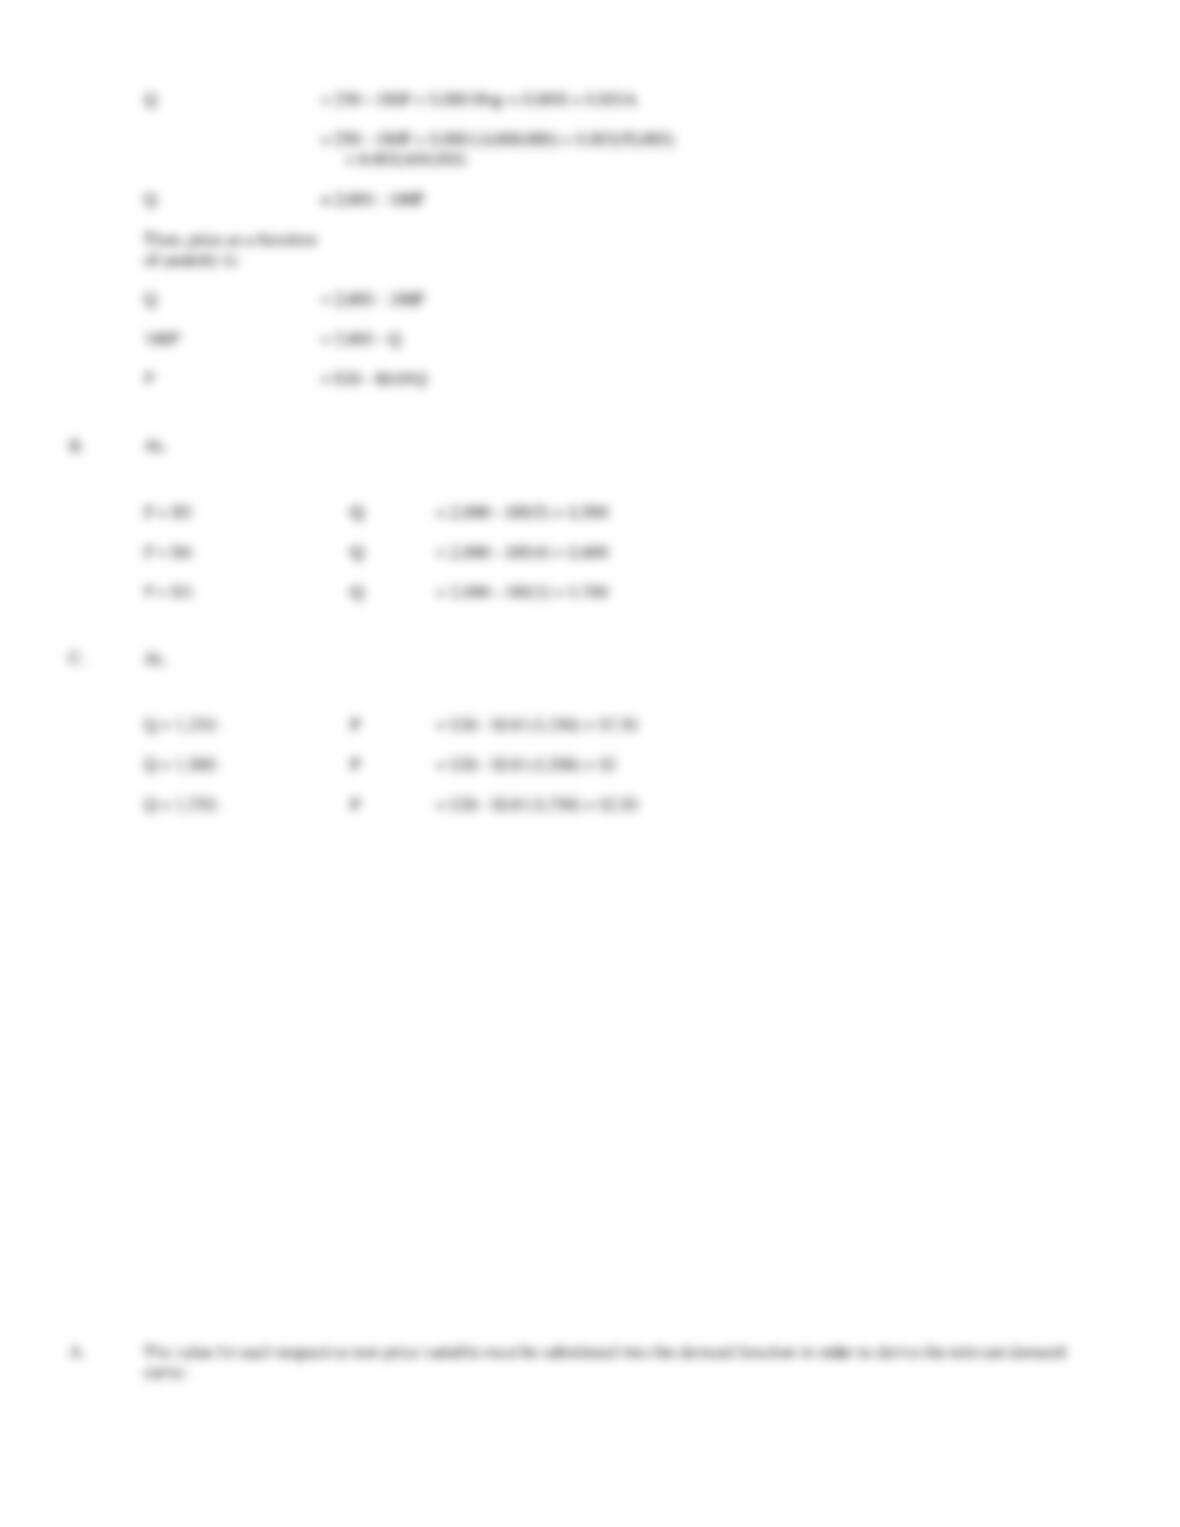
A.
The value for each respective non-price variable must be substituted into the demand function in order to derive the relevant demand
A.
Co-generation of power by manufacturers will reduce demand for electric power, causing a leftward shift of the demand curve.
D.
A study finding that the more time one spends under a heat lamp, the less the chance of developing a cancer will undoubtedly increase
the demand of electric power, causing a rightward shift in the demand curve.
37. Quantity Demanded. Gurgling Springs, Inc. is a bottler of natural spring water distributed throughout the
New England states. Five-gallon containers of GSI spring water are regionally promoted and distributed
through grocery chains. Operating experience during the past year suggests the following demand function for
its spring water:
Q = 250 – 100P + 0.0001Pop + 0.003I + 0.003A
where Q is quantity in thousands of five-gallon containers, P is price ($), Pop is population, I is disposable income per capita ($), and A is advertising
expenditures ($).
A.
Determine the demand curve faced by CPI in a typical market where P = $4, Pop = 4,000,000 persons, I = $50,000 and A = $400,000.
Show the demand curve with quantity expressed as a function of price, and price expressed as a function of quantity.
B.
Calculate the quantity demanded at prices of $5, $4, and $3.
C.
Calculate the prices necessary to sell 1,250, 1,500, and 1,750 thousands of five-gallon containers.
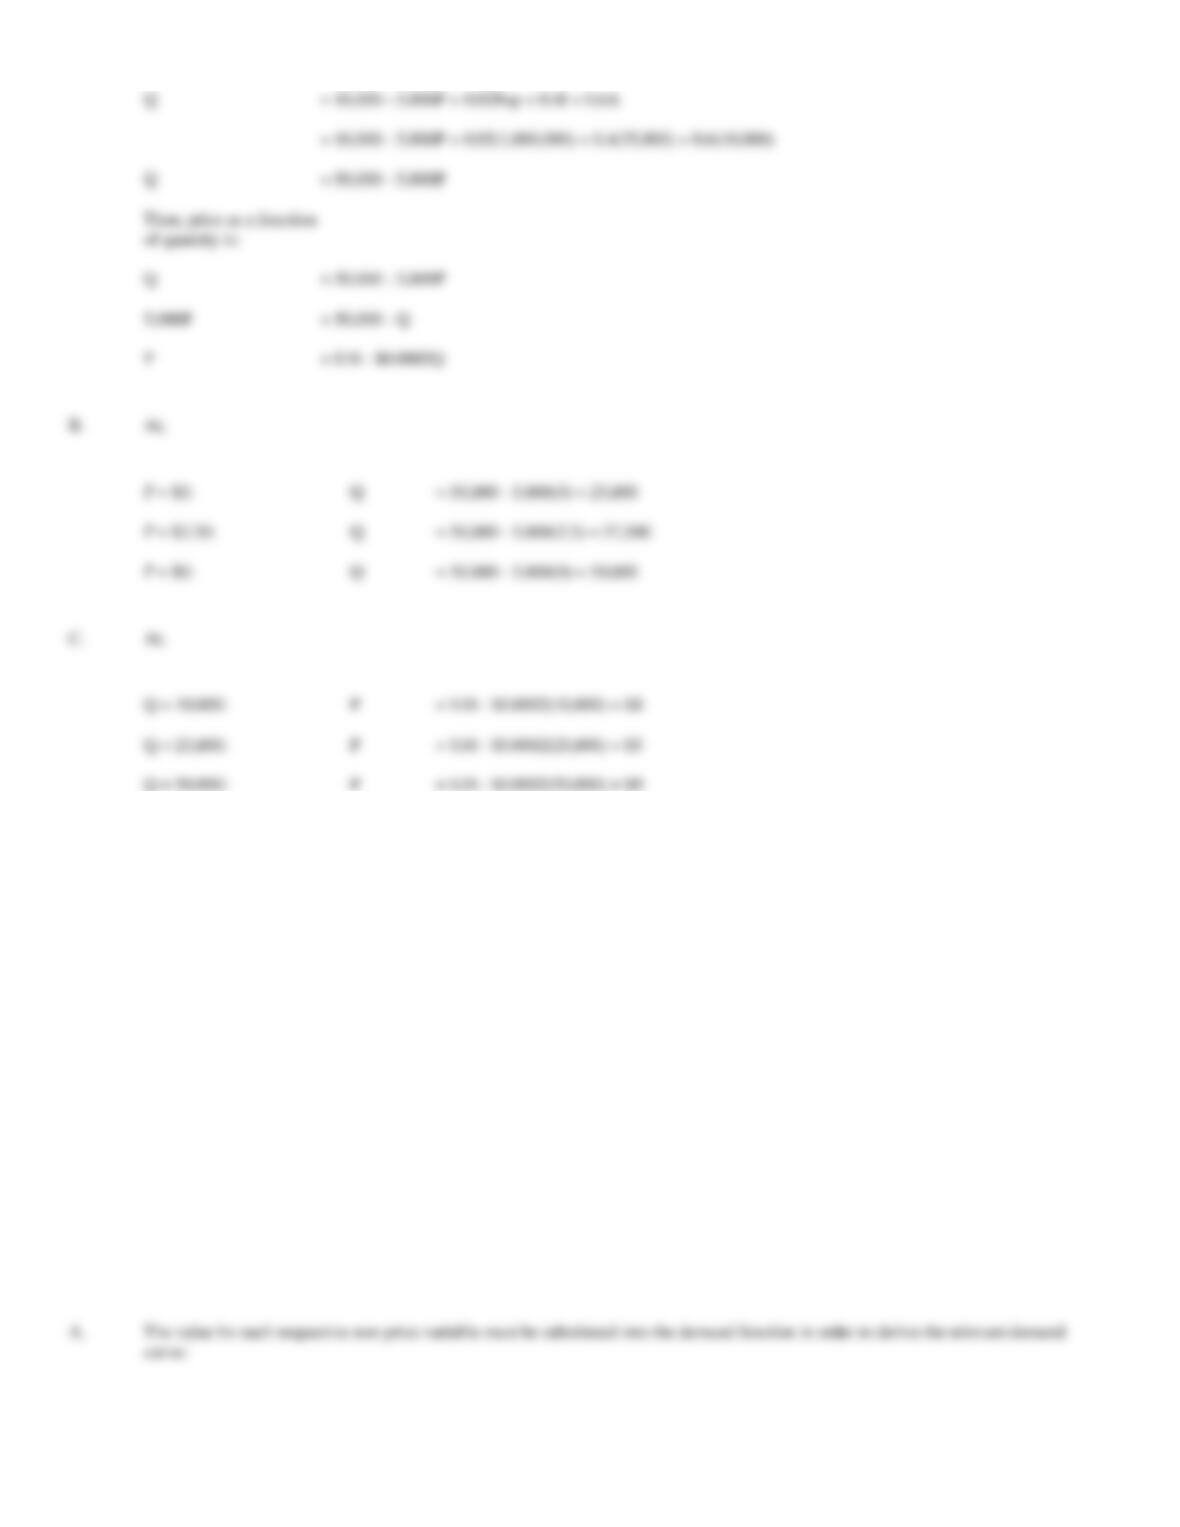
Q
= 10,000 – 5,000P + 0.02Pop + 0.4I + 0.6A
= 10,000 – 5,000P + 0.02(1,000,000) + 0.4(35,000) + 0.6(10,000)
Q
= 50,000 – 5,000P
Then, price as a function
Q
= 50,000 – 5,000P
5,000P
= 50,000 – Q
P
= $10 – $0.0002Q
B.
At,
P = $5:
Q
= 50,000 – 5,000(5) = 25,000
P = $2.50:
Q
= 50,000 – 5,000(2.5) = 37,500
P = $0:
Q
= 50,000 – 5,000(0) = 50,000
C.
At,
Q = 10,000:
P
= $10 – $0.0002(10,000) = $8
Q = 25,000:
P
= $10 – $0.0002(25,000) = $5
Q = 50,000:
P
= $10 – $0.0002(50,000) = $0
38. Quantity Demanded. The Sharper Edge, Inc. is a leading retailer of Yingsu Knives, a set of kitchen cutlery,
which it markets on a nationwide basis. SEI knife sets are either sold directly to the public through national
television marketing programs, or given away as promotional items. Operating experience during the past year
suggests the following demand function for its knife sets:
Q = 4,000 – 4,000P + 10,000N + 0.25I + 0.4A
Where Q is quantity, P is the price ($), N is the average Nielson rating of television programs during which SEI advertises Yingsu Knives, I is
average disposable income per household ($), and A is advertising expenditures ($).
A.
Determine the demand curve faced by SEI in a typical market where P = $35, N = 18.5, I = $44,000, and A = $500,000. Show the
demand curve with quantity expressed as a function of price, and price expressed as a function of quantity.
B.
Calculate the quantity demanded at prices of $40, $35, and $30.
C.
Calculate the prices necessary to sell 264,000, 292,000, and 320,000 sets of knives.
Q
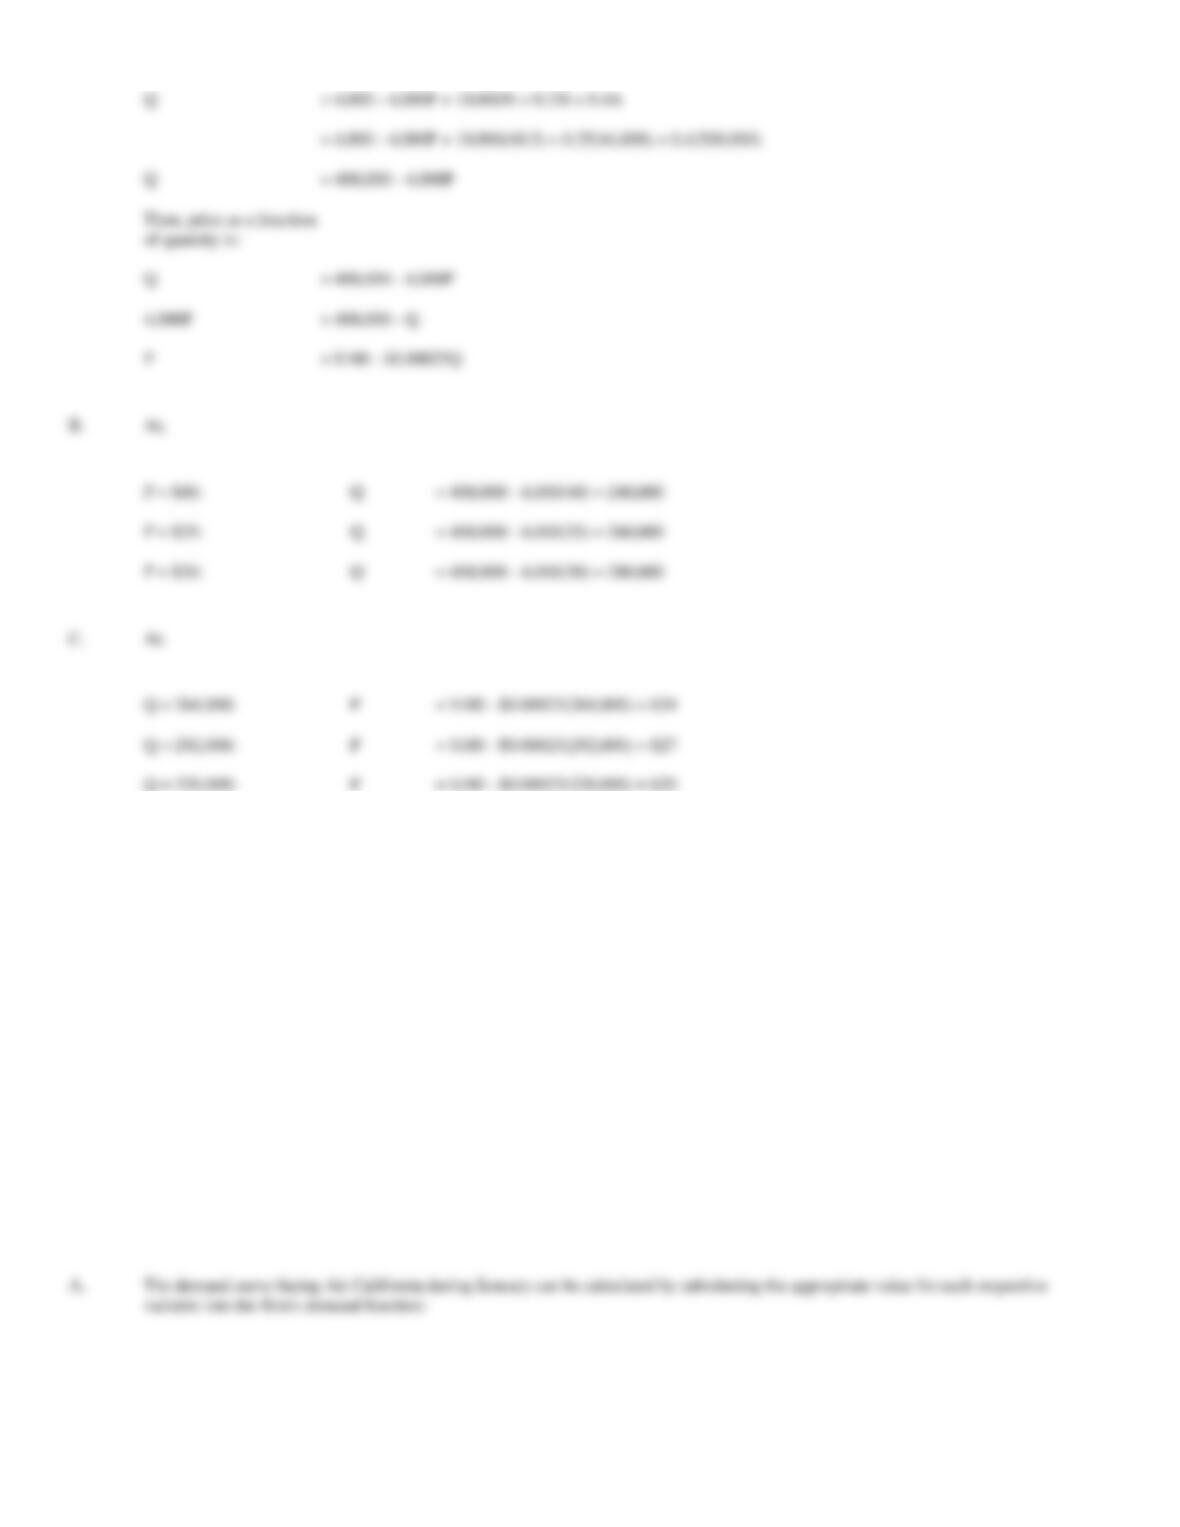
= 250 – 100P + 0.0001Pop + 0.005I + 0.003A
= 250 – 100P + 0.0001(4,000,000) + 0.003(50,000)
+ 0.003(400,000)
Q
= 2,000 – 100P
Then, price as a function
of quantity is:
Q
= 2,000 – 100P
100P
= 2,000 – Q
P
= $20 – $0.01Q
B.
At,
P = $5:
Q
= 2,000 – 100(5) = 1,500
P = $4:
Q
= 2,000 – 100(4) = 1,600
P = $3:
Q
= 2,000 – 100(3) = 1,700
C.
At,
Q = 1,250:
P
= $20 – $0.01(1,250) = $7.50
Q = 1,500:
P
= $20 – $0.01(1,500) = $5
Q = 1,750:
P
= $20 – $0.01(1,750) = $2.50
39. Demand Curve Analysis. Air California, Inc. is a regional airline providing service between Los Angeles,
California and Las Vegas, Nevada. An analysis of the monthly demand for service has revealed the following
demand relation:
Q = 45,000 – 250P – 300PC + 250BAI + 10,000S
Where Q is quantity measured by the number of passengers per month, P is the price ($), PC is a price index for connecting flights (1982 = 100.), BAI
is a business activity index (1982 = 100) and S, a binary or dummy variable, equals 1 in summer months, zero otherwise.
A.
Determine the demand curve facing the airline during the winter month of January if P = $100, PC = 150, BAI = 200, and S = 0.
B.
Calculate the quantity demanded and total revenues during the summer month of July if all price-related variables are as specified
above.
Q
= 4,000 – 4,000P + 10,000N + 0.25I + 0.4A
= 4,000 – 4,000P + 10,000(18.5) + 0.25(44,000) + 0.4(500,000)
Q
= 400,000 – 4,000P
Then, price as a function
of quantity is:
4,000P
= 400,000 – Q
At,
P = $35:
Q
= 400,000 – 4,000(35) = 260,000
At,
Q = 292,000:
P
= $100 – $0.00025(292,000) = $27
Q = 320,000:
P
= $100 – $0.00025(320,000) = $20
40. Demand Curve Analysis. The Badger Bus Company is a regional bus line providing service between
Milwaukee, Wisconsin and Chicago, Illinois. An analysis of the monthly demand for service has revealed the
following demand relation:
Q = 1,750 – 40P – 15PC + 30BAI – 1,700S
Where Q is quantity measured by the number of passengers per month, P is the price ($), PC is a price index for connecting bus routes (1992 = 100.),
BAI is a business activity index (1992 = 100) and S, a binary or dummy variable, equals 1 in summer months, zero otherwise.
A.
Determine the demand curve facing the bus service during the winter month of February if P = $40, PC = 120, BAI = 175, and S = 0.
B.
Calculate the quantity demanded and total revenues during the summer month of August if all price-related variables are as specified
above.
Q
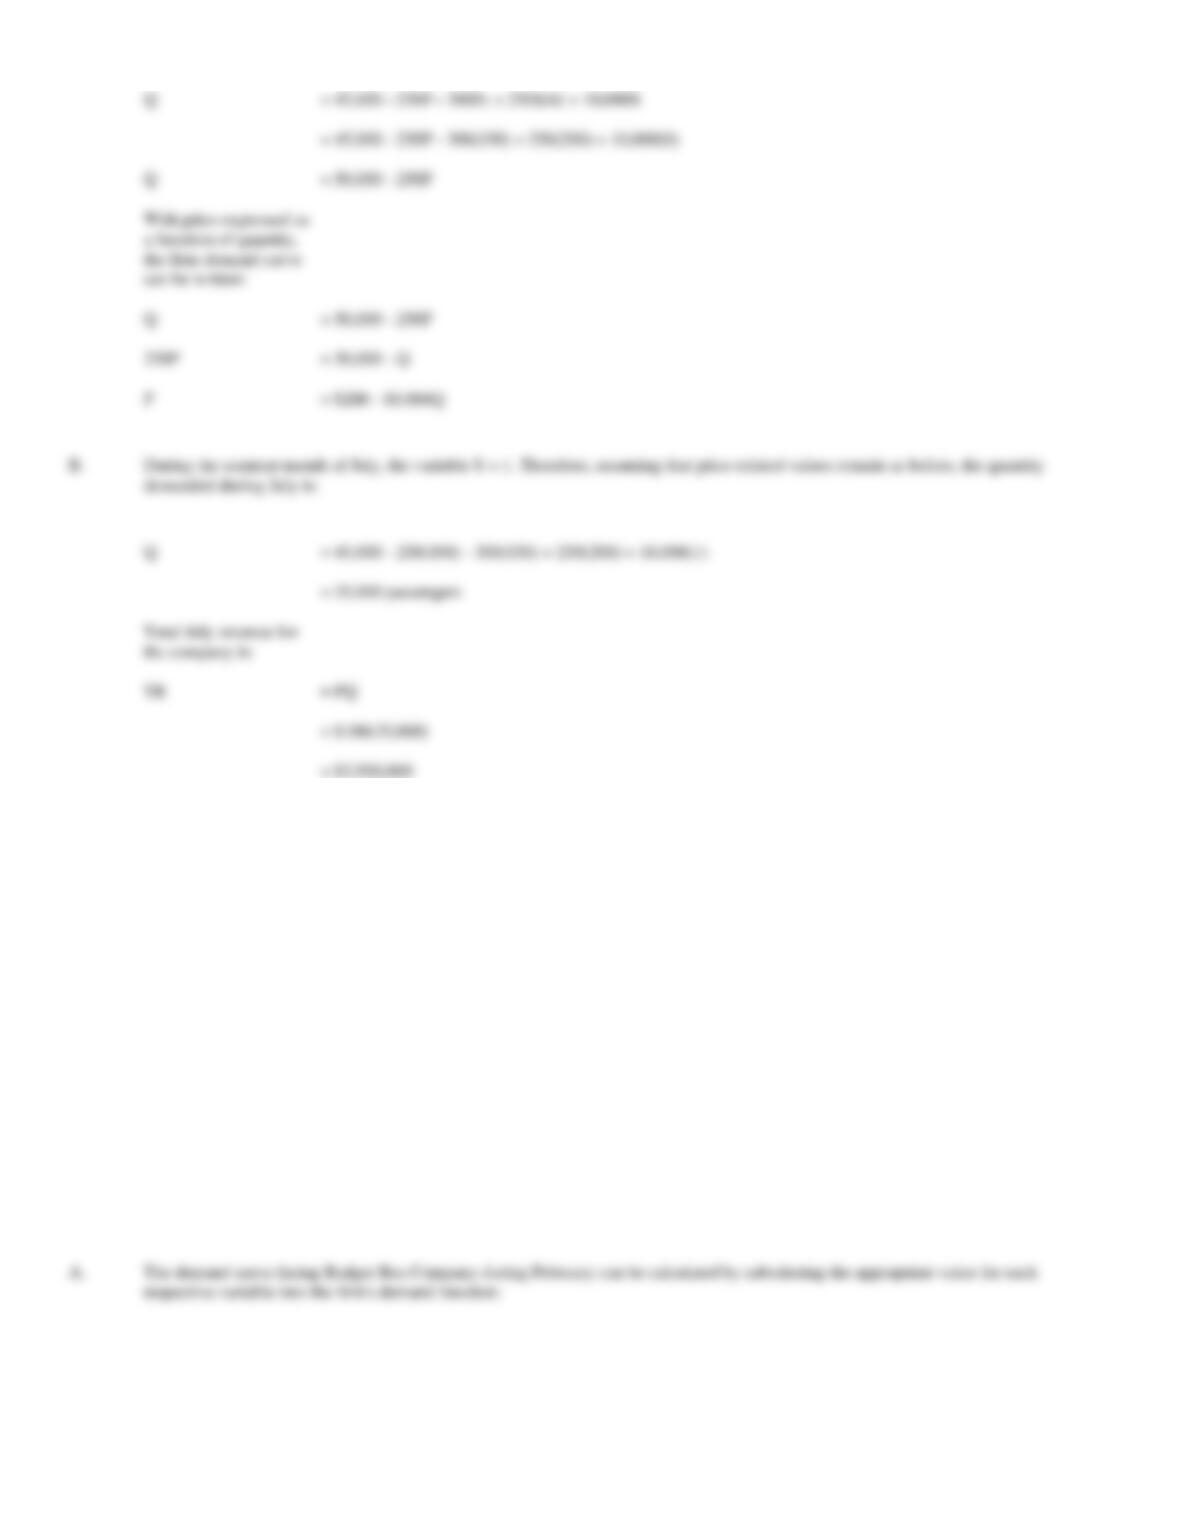
= 45,000 – 250P – 300PC + 250BAI + 10,000S
= 45,000 – 250P – 300(150) + 250(200) + 10,000(0)
Q
= 50,000 – 250P
Q
= 50,000 – 250P
P
= $200 – $0.004Q
Q
= 45,000 – 250(100) – 300(150) + 250(200) + 10,000(1)
= 35,000 passengers
Total July revenue for
= PQ
= $3,500,000