
1. The labor supply curve is fundamentally a representation of the trade-off people face between which of the following?
a.
work and wages
b.
work and leisure
c.
wages and productivity
d.
technology and wages
2. For a worker, the opportunity cost of an hour of leisure
a.
rises by $8 when his wage rises by $8 per hour.
b.
falls by $8 when his wage rises by $8 per hour.
c.
is the same for a celebrity talk-show host as it is for a teacher.
d.
is determined by factors that are unrelated to his hourly wage.
3. Fiona’s hourly wage increases from $8 to $10. Which of the following describes a consequence of the increase in
Fiona’s wage?
a.
The opportunity cost of Fiona’s leisure time has decreased.
b.
Fiona may choose to work fewer hours due to the increase in her wage.
c.
If Fiona’s labor supply curve is upward sloping, she will choose to work fewer hours.
d.
Both a and b are correct.
4. Roxanne’s hourly wage increases from $9 to $13. Which of the following describes a consequence of the increase in
Roxanne’s wage?
a.
The opportunity cost of Roxanne’s leisure time has increased.
b.
Roxanne may choose to work fewer hours due to the increase in her wage.
c.
If Roxanne’s labor supply curve is upward sloping, she will choose to work fewer hours.
d.
Both a and b are correct.

5. Fiona’s hourly wage decreases from $10 to $8. Which of the following describes a consequence of the decrease in
Fiona’s wage?
a.
The opportunity cost of Fiona’s leisure time has decreased.
b.
Fiona may choose to work more hours due to the decrease in her wage.
c.
Fiona may choose to work fewer hours due to the decrease in her wage.
d.
All of the above are correct.
6. Fiona’s hourly wage decreases from $10 to $8. Which of the following describes a consequence of the decrease in
Fiona’s wage?
a.
The opportunity cost of Fiona’s leisure time has increased.
b.
Fiona may choose to work more hours due to the decrease in her wage.
c.
Fiona may choose to work fewer hours due to the decrease in her wage.
d.
Both b and c are correct.
7. If your wage increases from $10 per hour to $15 per hour, then your
a.
opportunity cost of an hour of leisure decreases by $5 per hour.
b.
opportunity cost of an hour of leisure increases by $5 per hour.
c.
out–of-pocket cost of an hour of leisure decreases by $5 per hour.
d.
out–of-pocket cost of an hour of leisure increases by $5 per hour.

Scenario 18-3
Sam has two jobs, one for the winter and one for the summer. In the winter, he works as a lift attendant at a ski resort
where he earns $13 per hour. During the summer, he drives a tour bus around the ski resort, earning $11 per hour.
8. Refer to Scenario 18-3. During the winter months, what is Sam’s opportunity cost of taking an hour off work to go
skiing?
a.
$13
b.
between $11 and $12
c.
$11
d.
less than $11
9. Refer to Scenario 18-3. During the summer months, what is Sam’s opportunity cost of taking an hour off work to go
hiking?
a.
$13
b.
between $11 and $12
c.
$11
d.
less than $11
10. Refer to Scenario 18-3. Assume that Sam has an upward-sloping labor supply curve. If the opportunity cost of Sam’s
leisure time increases, he will respond by working
a.
more hours.
b.
fewer hours.
c.
an equal number of hours.
d.
a number of hours that cannot be determined from the information. The labor demand curve is needed to make
this determination.

11. Refer to Scenario 18-3. If Sam takes fewer hours of leisure in the summer than in the winter, we can assume that his
labor supply curve for the range of earnings in this example
a.
is horizontal.
b.
is vertical.
c.
is upward sloping.
d.
has a backward-bending portion.
12. Refer to Scenario 18-3. If Sam takes fewer hours of leisure in the winter than in the summer, we can assume that his
labor supply curve for the range of earnings in this example
a.
is horizontal.
b.
is vertical.
c.
is upward sloping.
d.
has a backward-sloping portion.
13. Your college roommate receives a pay raise at her part-time job from $9 to $11 per hour. She used to work 25 hours
per week, but now she decides to work 20 hours per week in order to spend more time studying economics. For this price
range, her labor supply curve is
a.
vertical.
b.
horizontal.
c.
upward sloping.
d.
backward sloping.
14. Your college roommate receives a pay raise at her part-time job from $9 to $11 per hour. She used to work 10 hours
per week, but now she decides to work 15 hours per week. For this price range, her labor supply curve is
a.
vertical.

b.
horizontal.
c.
upward sloping.
d.
backward sloping.
15. Miguel receives a pay raise at his part-time job from $7.50 to $9 per hour. He used to work 10 hours per week, but
now he decides to work 12 hours per week. For this price range, his labor supply curve is
a.
vertical.
b.
horizontal.
c.
upward sloping.
d.
backward sloping.
16. An upward-sloping labor supply curve means that
a.
workers prefer to buy more leisure time when their incomes increase.
b.
workers prefer to supply less labor when wages are high.
c.
an increase in the opportunity cost of leisure leads workers to increase the quantity of labor they supply.
d.
All of the above are correct.
17. An upward-sloping labor-supply curve implies that an increase in the wage induces
a.
firms to decrease the quantity of labor they hire.
b.
firms to increase the quantity of labor they hire.
c.
workers to increase the quantity of labor they supply.
d.
workers to increase the quantity of leisure they enjoy.

18. An upward-sloping labor-supply curve implies that an increase in the wage induces
a.
firms to increase the quantity of labor they hire.
b.
firms to increase the quantity of output they produce.
c.
workers to decrease the quantity of leisure they enjoy.
d.
All of the above are correct.
19. If a worker responds to an increase in the opportunity cost of leisure by taking less leisure, then his labor supply curve
is
a.
horizontal.
b.
vertical.
c.
backward sloping.
d.
upward sloping.
20. If a worker responds to an increase in the opportunity cost of leisure by taking more leisure, then her labor supply
curve is
a.
upward sloping.
b.
backward sloping.
c.
horizontal.
d.
vertical.

21. A household member’s decision about how much labor to supply is most closely linked to
a.
the supply of factors of production other than labor.
b.
technological change.
c.
the tradeoff between leisure and work.
d.
immigration trends.
22. Among the people who are characterized below, who has the highest opportunity cost of leisure?
a.
an attorney who earns $200 per hour and who plays golf during her leisure time
b.
a medical doctor who earns $210 per hour and who sleeps during his leisure time
c.
a retail clerk who earns $15 per hour and who watches TV during her leisure time
d.
a waiter who earns $12 per hour and who reads poetry during his leisure time
23. Among the people who are characterized below, who has the highest opportunity cost of leisure?
a.
a veterinarian who earns $25 per hour and who goes surfing during her leisure time
b.
a professional tennis player who earns $50 per hour giving tennis lessons and who watches TV during his
leisure time
c.
a retail clerk who earns $15 per hour and who plays computer games during his leisure time
d.
a CPA who earns $150 per hour and who golfs during her leisure time
24. The labor supply curve reflects how
a.
workers’ decisions about the labor-leisure tradeoff respond to a change in the wage.
b.
workers’ decisions about the opportunity cost of labor respond to a change in the quantity of labor supplied.
c.
firms’ decisions about the labor-leisure tradeoff respond to the quantity of labor demanded.
d.
firms’ decisions about how the quantity of labor they hire respond to changes in their opportunities to earn
profits.

25. If Ernie’s individual labor supply curve is upward sloping, then Ernie responds to an increase in the
a.
wage by working more hours per week.
b.
opportunity cost of leisure by working fewer hours per week.
c.
opportunity cost of leisure by taking more hours of leisure per week.
d.
Both a and b are correct.
26. Which of the following statements is correct? An individual worker’s labor supply curve
a.
can never be backward sloping.
b.
slopes backward if that person responds to a higher wage by taking fewer hours of leisure per week.
c.
slopes backward if that person responds to a higher opportunity cost of leisure by working fewer hours per
week.
d.
slopes upward if that person works the same number of hours per week, regardless of the opportunity cost of
leisure.
27. If the wages of a dentist increase,
a.
so does her opportunity cost of leisure.
b.
her hours of labor supplied may increase.
c.
her hours of labor supplied may decrease.
d.
All of the above are correct.
28. If the wages of a CPA decrease,
(i)
her opportunity cost of leisure increases.
(ii)
her opportunity cost of leisure decreases.
(iii)
her hours of labor supply may increase.
(iv)
her hours of labor supply may decrease.
a.
(i) and (iii) only
b.
(ii) and (iv) only
c.
(i), (iii), and (iv) only
d.
(ii), (iii), and (iv) only
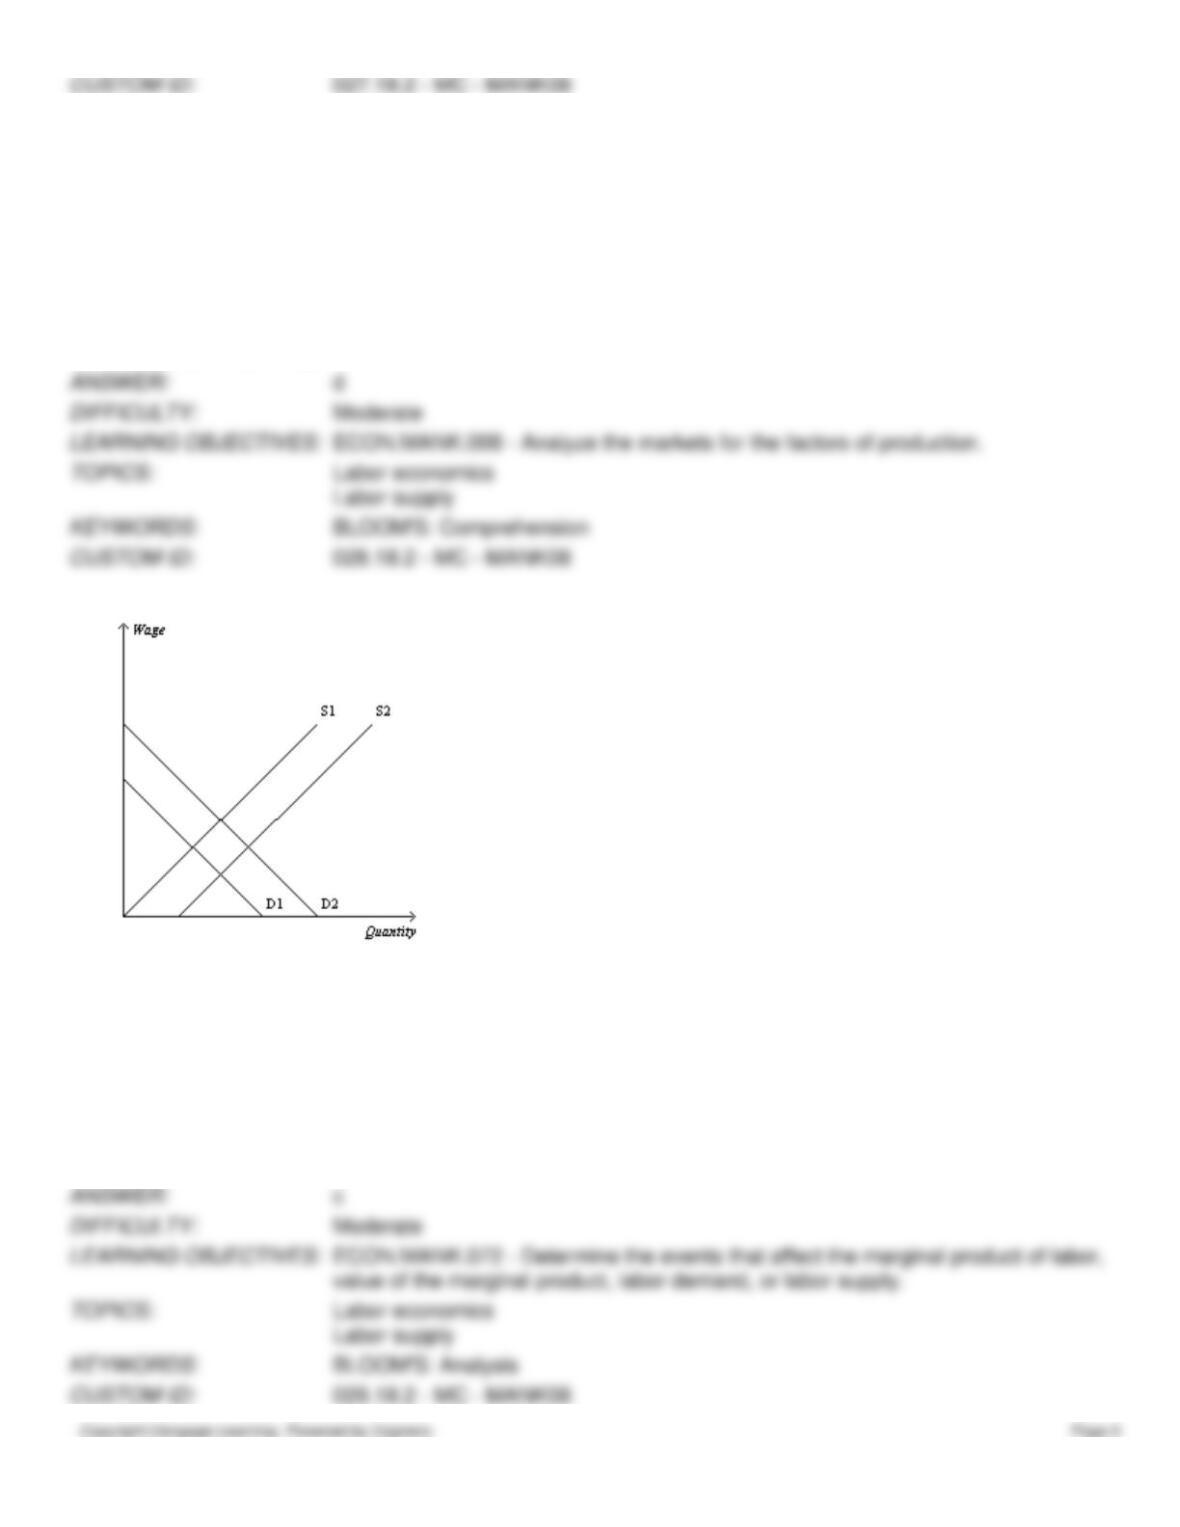
Figure 18-6
29. Refer to Figure 18–6. The graph above illustrates the market for bakers who make homemade breads and breakfast
pastries. If the bakery profession becomes more attractive to young women and men because of a new reality television
show, what happens in the market for bakers?
a.
Demand increases from D1 to D2.
b.
Demand decreases from D2 to D1.
c.
Supply increases from S1 to S2.
d.
Supply decreases from S2 to S1.

30. Refer to Figure 18–6. The graph above illustrates the market for bakers who make homemade breads and breakfast
pastries. If the bakery profession becomes less attractive to young women and men because of news reports documenting
health risks, what happens in the market for bakers?
a.
Demand increases from D1 to D2.
b.
Demand decreases from D2 to D1.
c.
Supply increases from S1 to S2.
d.
Supply decreases from S2 to S1.
31. Refer to Figure 18–6. The graph above illustrates the market for bakers who make homemade breads and breakfast
pastries. If the wages paid to wedding cake bakers increase, what happens in the market for bread bakers?
a.
Demand increases from D1 to D2.
b.
Demand decreases from D2 to D1.
c.
Supply increases from S1 to S2.
d.
Supply decreases from S2 to S1.
32. Refer to Figure 18–6. The graph above illustrates the market for bakers who make homemade breads and breakfast
pastries. If the wages paid to wedding cake bakers decrease, what happens in the market for bread bakers?
a.
Demand increases from D1 to D2.
b.
Demand decreases from D2 to D1.
c.
Supply increases from S1 to S2.
d.
Supply decreases from S2 to S1.
33. Refer to Figure 18–6. The graph above illustrates the market for bakers who make homemade breads and breakfast

pastries in Northern Minnesota. If Northern Minnesota experiences an increase in immigration from Canada, what
happens in the market for bakers?
a.
Demand increases from D1 to D2.
b.
Demand decreases from D2 to D1.
c.
Supply increases from S1 to S2.
d.
Supply decreases from S2 to S1.
34. Which of the following events can cause the labor-supply curve to shift?
a.
an increase in the wage rate
b.
an increase in the price of output
c.
an increase in the rate of immigration
d.
a technological advance
35. Which of the following events can not cause the labor-supply curve to shift?
a.
a change in people’s attitudes toward work
b.
an increase in the price of output
c.
a change in workers’ alternative opportunities
d.
an increase in the rate of immigration
36. Which of the following would shift a market labor supply curve to the right?
a.
an increase in the price of output
b.
an increase in immigration
c.
a labor-saving technological change

d.
a decrease in the wage rate
37. Which of the following would not shift a market labor supply curve to the right?
a.
a decrease in the wage paid to workers in a competing market
b.
labor-augmenting technology
c.
a change in worker tastes so that workers want to retire later
d.
an increase in immigration
38. Which of the following would shift a market labor supply curve to the left?
a.
a decrease in the price of output
b.
an increase in the price of output
c.
a labor-augmenting technological change
d.
better employment opportunities in a closely-related job
39. Which of the following would shift a market labor supply curve to the left?
a.
an increase in the wage paid to workers in a competing market
b.
labor-saving technology
c.
a change in worker tastes so that workers want to retire later
d.
an increase in immigration

40. Immigration is an important
a.
explanation for the failure of firms to operate on their labor-demand curves.
b.
explanation for the failure of firms to operate on their output-supply curves.
c.
source of shifts in labor demand.
d.
source of shifts in labor supply.
41. Which of the following events would shift the labor supply curve?
a.
changes in the number of women willing to work
b.
immigration of workers
c.
changing attitudes towards work
d.
All of the above are correct.
42. Which of the following events would shift a labor supply curve?
(i)
immigration of high-skilled workers
(ii)
immigration of low-skilled workers
(iii)
changes in the number of women willing to work full time
a.
(i) and (iii) only
b.
(ii) and (iii) only
c.
(iii) only
d.
(i), (ii), and (iii)

43. The labor supply curve shifts when
a.
employers need to hire more people.
b.
employers develop new technology.
c.
workers change the number of hours that they want to work at any given wage.
d.
workers become more productive.
44. What happens to labor supply in the pear-picking market when the wage paid to apple pickers increases?
a.
The labor supply will stay unchanged until the wages paid to pear pickers change.
b.
The labor supply will decrease.
c.
The labor supply will increase.
d.
The labor supply may fall or rise, depending on the price of pears.
45. Suppose that the wage paid to workers who detassel corn rises. What happens in the market for workers who weed
soybean fields, given that workers who detassel corn can easily work weeding soybean fields?
a.
The demand curve for soybean workers increases.
b.
The demand curve for soybean workers decreases.
c.
The supply curve for soybean workers increases.
d.
The supply curve for soybean workers decreases.
46. What happens to the labor supply curves in both countries when Mexican workers leave Mexico and move to the

United States?
a.
Labor supply decreases in Mexico and decreases in the United States.
b.
Labor supply increases in the United States and increases in Mexico.
c.
Labor supply increases in the United States and decreases in Mexico.
d.
Labor supply increases in Mexico and decreases in United States.
47. Immigration of workers into the United States is often an important source of
a.
increases in the demand for labor in the United States.
b.
decreases in the demand for labor in the United States.
c.
increases in the supply of labor in the United States.
d.
decreases in the supply of labor in the United States.
48. Which of the following events would lead to an increase in the supply of labor?
a.
The price of a firm’s product increases.
b.
A country experiences an increase in immigrant labor.
c.
The development of a new labor-augmenting technology.
d.
All of the above are correct.
49. When the wages paid to government economists increase, the labor supply curve for academic economists
a.
shifts to the left.
b.
shifts to the right.
c.
will become backward-sloping.
d.
will not change.

50. Which of the following could increase the labor-supply curve for computer-repair technicians?
a.
an increase in the wages paid to computer-repair technicians
b.
an increase in immigration
c.
a change in the work preferences of men, with more of them preferring to be stay-at-home fathers
d.
an increase in the wages paid to television-repair technicians
51. Which of the following could decrease the labor-supply curve for teachers?
a.
a decrease in the wages paid to teachers
b.
an increase in immigration
c.
a change in the work preferences of men, with more of them preferring to be stay-at-home fathers
d.
any factor that would decrease the labor-demand curve
52. Which of the following could increase the supply of labor in the market for cranberry pickers?
(i)
a change in the preferences of women toward full-time work
(ii)
an increase in the output price
(iii)
an increase in the wages paid to apple pickers
(iv)
a decrease in the wages paid to apple pickers
a.
(ii) only
b.
(i), (ii), and (iv) only
c.
(i) and (iv) only
d.
(ii) and (iii) only

53. The labor supply curve is fundamentally a representation of the trade-off people face between which of the following?
a.
inflation and unemployment
b.
prosperity and wages
c.
time and leisure
d.
labor and leisure
54. If Sharnae’s individual labor supply curve is backward sloping, then Sharnae responds to an increase in her
a.
wage by working fewer hours per week.
b.
opportunity cost of leisure by taking more hours of leisure per week.
c.
wage by working more hours per week.
d.
Both a and b are correct.
55. Which of the following would not shift a market labor supply curve to the left?
a.
an increase in the wage paid to workers in a competing market
b.
labor-saving technology
c.
a change in worker tastes so that workers want to retire earlier
d.
an increase in immigration