Unlock document.
This document is partially blurred.
Unlock all pages and 1 million more documents.
Get Access
b.
domestic producers of bicycles are worse off, domestic consumers of bicycles are better off, and the economic
well-being of the country falls.
c.
domestic producers of bicycles are better off, domestic consumers of bicycles are worse off, and the economic
well-being of the country rises.
d.
domestic producers of bicycles are better off, domestic consumers of bicycles are worse off, and the economic
well-being of the country falls.
276. When a country allows trade and becomes an importer of jet skis,
a.
domestic producers of jet skis are worse off, domestic consumers of jet skis are better off, and the economic
well-being of the country rises.
b.
domestic producers of jet skis are worse off, domestic consumers of jet skis are better off, and the economic
well-being of the country falls.
c.
domestic producers of jet skis are better off, domestic consumers of jet skis are worse off, and the economic
well-being of the country rises.
d.
domestic producers of jet skis are better off, domestic consumers of jet skis are worse off, and the economic
well-being of the country falls.
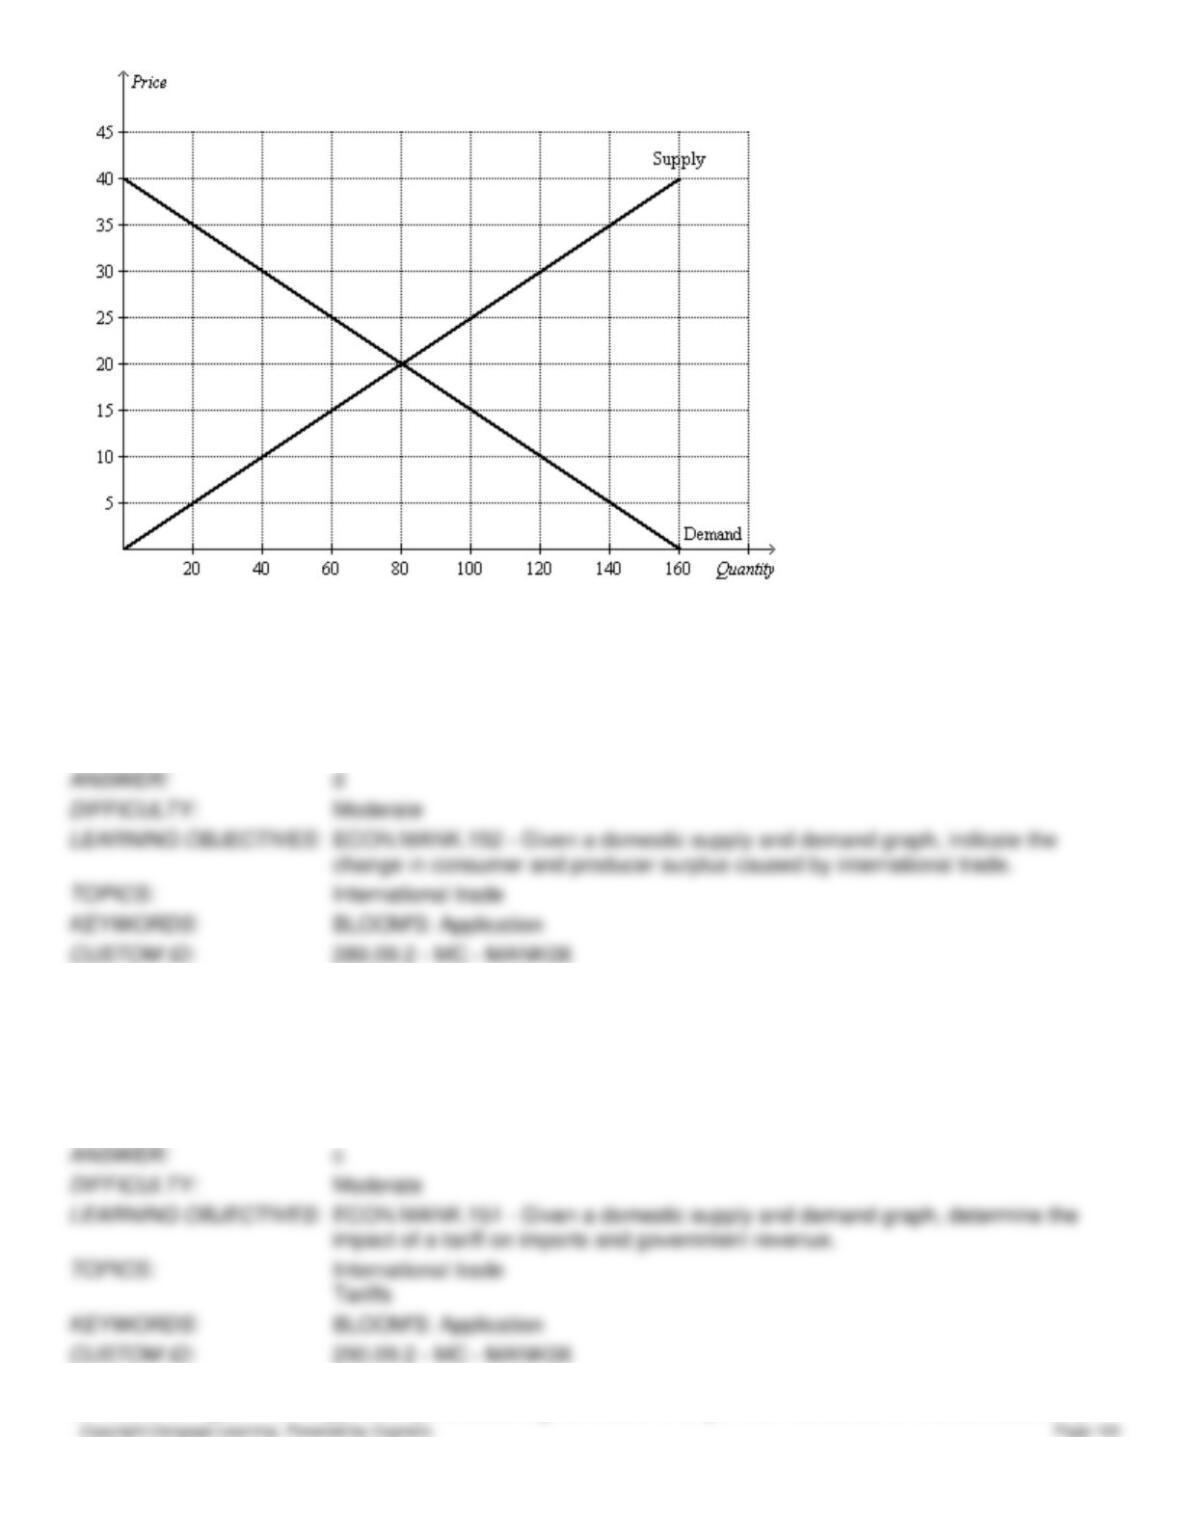
Figure 9-23
The following diagram shows the domestic demand and domestic supply for a market. Assume that the world price in this
market is $120 per unit.
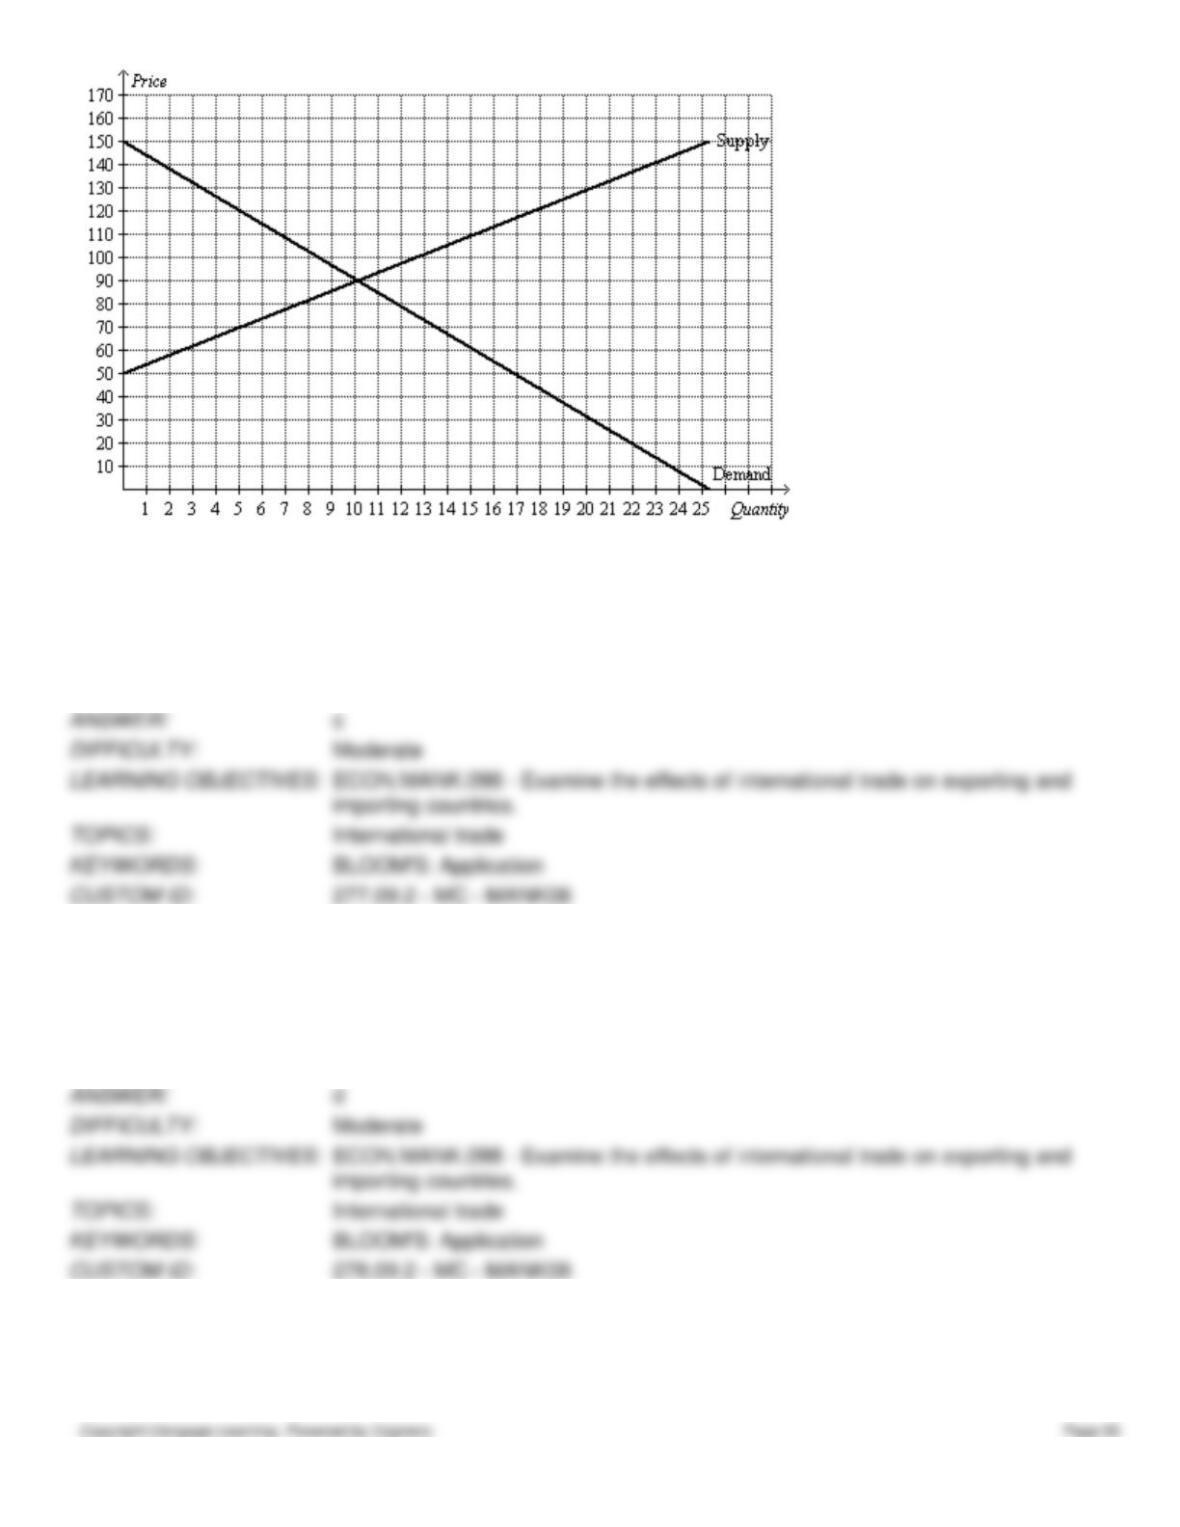
277. Refer to Figure 9-23. With free trade, the domestic price and domestic quantity demanded are
a.
$90 and 5.
b.
$90 and 10.
c.
$120 and 5.
d.
$120 and 18.
278. Refer to Figure 9-23. With free trade, the domestic price and domestic quantity supplied are
a.
$90 and 10.
b.
$90 and 18.
c.
$120 and 5.
d.
$120 and 18.
279. Refer to Figure 9-23. With free trade allowed, this country
a.
exports 5 units of the good.
b.
imports 5 units of the good.
c.
exports 13 units of the good.
d.
imports 13 units of the good.
280. Refer to Figure 9-23. Consumer surplus with free trade is
a.
$75.
b.
$150.
c.
$200.
d.
$300.
281. Refer to Figure 9-23. Producer surplus with free trade is
a.
$200.
b.
$450.
c.
$630.
d.
$1,080
Figure 9-24
The following diagram shows the domestic demand and supply in a market. Assume that the world price in this market is
$20 per unit.
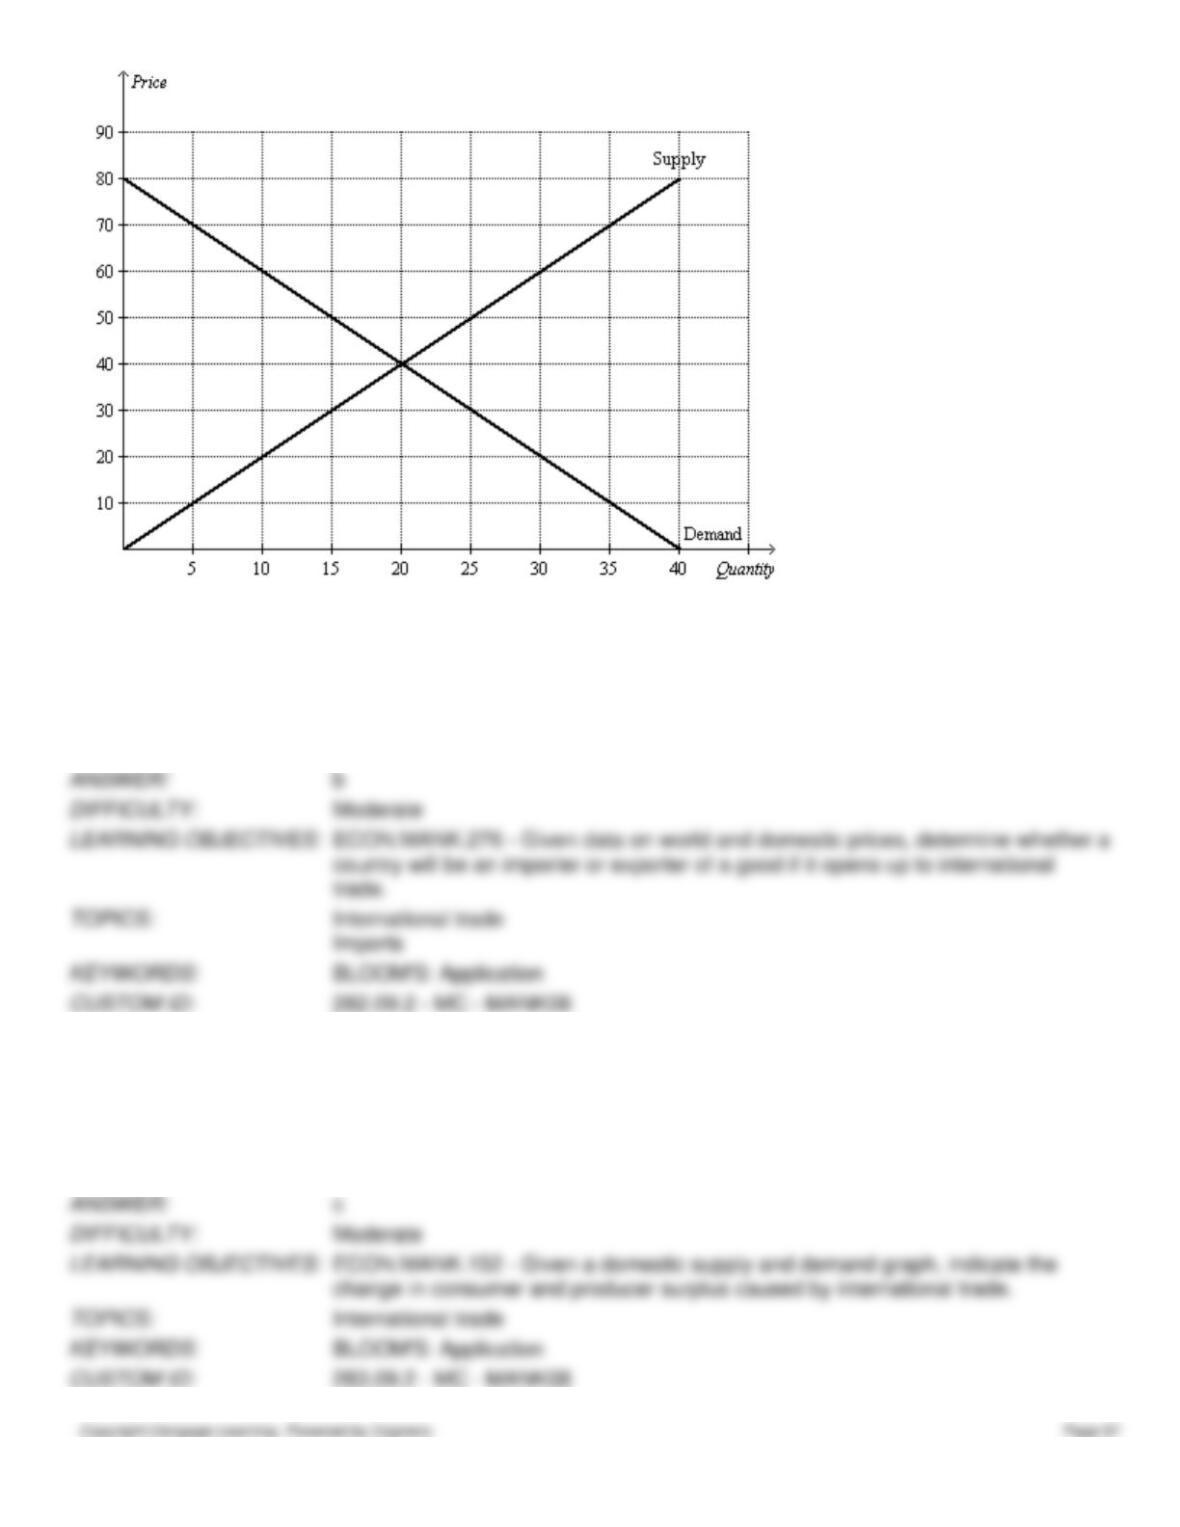
282. Refer to Figure 9-24. With free trade, the country
a.
exports 20 units of the good.
b.
imports 20 units of the good.
c.
exports 30 units of the good.
d.
imports 30 units of the good.
283. Refer to Figure 9-24. With free trade, consumer surplus is
a.
$400 and producer surplus is $100.
b.
$400 and producer surplus is $400.
c.
$900 and producer surplus is $100.
d.
$900 and producer surplus is $400.
284. Refer to Figure 9-24. With free trade, total surplus is
a.
$500.
b.
$800.
c.
$1,000.
d.
$1,300.
285. Refer to Figure 9-24. Suppose the government imposes a tariff of $10 per unit. With trade and a tariff, consumer
surplus is
a.
$625 and producer surplus is $25.
b.
$625 and producer surplus is $225.
c.
$1,225 and producer surplus is $25.
d.
$1,225 and producer surplus is $225.
286. Refer to Figure 9-24. Suppose the government imposes a tariff of $10 per unit. The amount of revenue collected by
the government from the tariff is
a.
$50.
b.
$100.
c.
$150.
d.
$200.
287. Refer to Figure 9-24. Suppose the government imposes a tariff of $10 per unit. With trade and a tariff, total surplus
is
a.
$750.
b.
$900.
c.
$950.
d.
$1,550.
288. Refer to Figure 9-24. Suppose the government imposes a tariff of $10 per unit. The deadweight loss caused by the
tariff is
a.
$25.
b.
$50.
c.
$75.
d.
$100.
Figure 9-25
The following diagram shows the domestic demand and supply in a market. Assume that the world price in this market is
$10 per unit.
289. Refer to Figure 9-25. With free trade, total surplus is
a.
$800.
b.
$1,200.
c.
$1,600.
d.
$2,000.
290. Refer to Figure 9-25. Suppose the government imposes a tariff of $5 per unit. With trade and a tariff, total surplus is
a.
$1,700.
b.
$1,800.
c.
$1,900.
d.
$2,000.
291. Refer to Figure 9-25. Suppose the government imposes a tariff of $5 per unit. The amount of revenue collected by
the government from the tariff is
a.
$50.
b.
$100.
c.
$150.
d.
$200.
292. Refer to Figure 9-25. Suppose the government imposes a tariff of $5 per unit. The deadweight loss caused by the
tariff is
a.
$25.
b.
$50.
c.
$75.
d.
$100.
293. Refer to Figure 9-25. With free trade and a $5 per unit tariff, the country
a.
exports 20 units of the good.
b.
imports 20 units of the good.
c.
exports 40 units of the good.
d.
imports 40 units of the good.
294. When a country opens up to trade in a good for which it has a comparative advantage, and the country begins to
export the good, we can conclude that
a.
the domestic price will fall after trade opens up.
b.
both buyers and sellers in that country will be better off as a consequence of opening up the market to
international trade.
c.
the total surplus for this good will increase as a result of opening up the market to international trade.
d.
opening the market to international trade will create a deadweight loss.
295. Suppose that the U.S. has a comparative advantage in the production of spreadsheet software. As a result of opening
up the market to international trade,
a.
U.S. citizens benefit from lower software prices, increasing consumer surplus in the market.
b.
U.S. software producers are harmed, since the price that these producers receive will decline as the price falls
to the world price.
c.
total surplus in this market will remain unchanged, as the decline in benefits received by software producers
exactly balances the increase in benefits received by US software consumers.
d.
U.S. producers benefit from higher software prices, increasing producer surplus in the market.
296. Mexico has imposed a tariff on the importation of chocolate. As a consequence of the tariff,
a.
Mexico as a whole is better off, since the tariff increases employment and production in the domestic
chocolate industry.
b.
Mexico as a whole is better off, since the tariff results in tax revenue for the Mexican government.
c.
Mexico as a whole is worse off, since producer surplus and consumer surplus both decrease.
d.
Mexico as a whole is worse off, since the increase in producer surplus is smaller than the drop in consumer
surplus plus tariff revenues.
Figure 9-26
The diagram below illustrates the market for baseballs in the U.S.
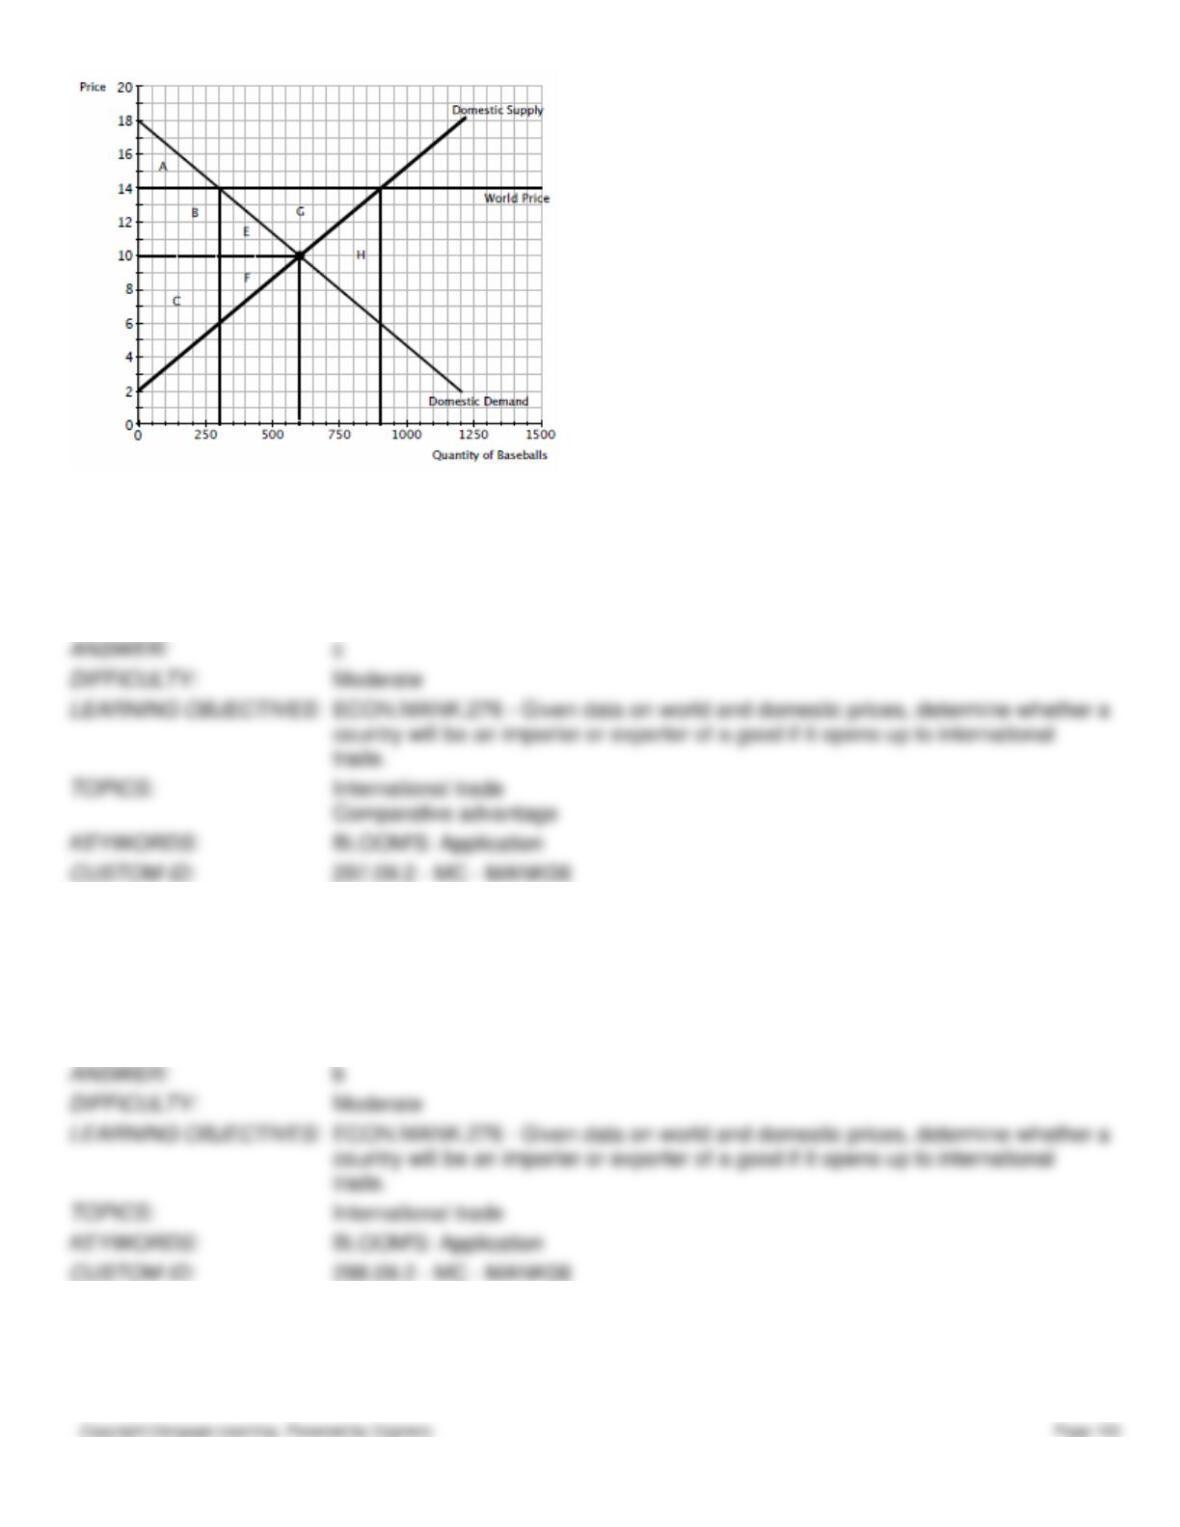
297. Refer to Figure 9-26. The figure shows that
a.
there will be a surplus of baseballs if the U.S. opens the market for baseballs to international trade.
b.
there will be a shortage of baseballs after the U.S. market for baseballs opens up to international trade.
c.
the U.S. has a comparative advantage in the production of baseballs.
d.
other countries have an absolute advantage in the production of baseballs.
298. Refer to figure 9-26. The figure shows that
a.
the U.S. will import baseballs when the market opens to international trade.
b.
the U.S. will export baseballs when the market opens to international trade.
c.
the U.S. will be a net loser when the market for baseballs opens to international trade.
d.
if the U.S. opens its baseball market to international trade, the price will plummet.
299. Refer to Figure 9-26. As a result of opening up the baseball market to international trade, the U.S. will
a.
import 600 baseballs.
b.
export 300 baseballs.
c.
import 400 baseballs.
d.
export 600 baseballs.
300. Refer to figure 9-26. Prior to opening the U.S. baseball market to trade, the equilibrium price of a baseball is
a.
$16
b.
$12
c.
$10
d.
$8
301. Refer to figure 9-26. Consumer surplus in the U.S. prior to the opening of the baseball market to international trade
is the area
a.
A
b.
A + B + C
c.
A + B + E
d.
C + F
302. Refer to figure 9-26. After the opening of the baseball market to international trade, producer surplus in the U.S.
a.
increases by the area G.
b.
decreases by the area E + F.
c.
decreases by the area B + E.
d.
increases by the area B + E + G
303. Refer to figure 9-26. After the opening of the U.S. baseball market to international trade, it’s possible to conclude
that
a.
both U.S. buyers and U.S. sellers are worse off.
b.
both U.S. buyers and U.S. sellers are better off.
c.
U.S. buyers are better off but U.S. sellers are worse off.
d.
U.S. buyers are worse off but U.S. sellers are better off.
304. Refer to figure 9-26. Prior to opening of the U.S. baseball market to international trade, total surplus is
a.
$4800.
b.
$2400.
c.
$600.
d.
$6000.
305. Refer to figure 9-26. After opening the U.S. baseball market to international trade, total surplus is
a.
$4800.
b.
$5400.
c.
$6000.
d.
$1200


