62. Refer to Figure 9-4. Consumer surplus in Nicaragua without trade is
a.
$375.
b.
$2,000.
c.
$2,250.
d.
$8,700.
63. Refer to Figure 9-4. The change in total surplus in Nicaragua because of trade is
a.
$625, and this is an increase in total surplus.
b.
$750, and this is an increase in total surplus.
c.
$625, and this is a decrease in total surplus.
d.
$750, and this is a decrease in total surplus.
64. Refer to Figure 9-4. Which of the following statements is accurate?
a.
Consumer surplus with trade is $3,200.
b.
Producer surplus with trade is $375.
c.
The gains from trade amount to $800.
d.
The gains from trade are represented on the graph by the area bounded by the points (0, $12), (300, $12), (300,
$7) and (0, $7).
bushel. The U.S. is a price-taker in the market for peaches.
65. Refer to Scenario 9-1. If trade in peaches is allowed, the United States
a.
will become an importer of peaches.
b.
will become an exporter of peaches.
c.
may become either an importer or an exporter of peaches, but this cannot be determined.
d.
will experience increases in both consumer surplus and producer surplus.
66. Refer to Scenario 9-1. If trade in peaches is allowed, the price of peaches in the United States
a.
will increase, and this will cause consumer surplus to decrease.
b.
will decrease, and this will cause consumer surplus to increase.
c.
will be unaffected, and consumer surplus will be unaffected as well.
d.
could increase or decrease or be unaffected; this cannot be determined.
67. Refer to Scenario 9-1. If trade in peaches is allowed, the price of peaches in the United States
a.
will be greater than the world price.
b.
will be equal to the world price.
c.
will be less than the world price.
d.
could be greater than, equal to, or less than the world price; this cannot be determined.
68. Refer to Scenario 9-1. If trade in peaches is allowed, U.S. producers of peaches
a.
will be better off.
b.
will be worse off.
c.
will be unaffected.
d.
will experience a decrease in their collective producer surplus.
69. Refer to Scenario 9-1. If trade in peaches is allowed, the
a.
price paid by American consumers of peaches is unchanged relative to the no-trade situation.
b.
total well-being of American producers of peaches is diminished relative to the no-trade situation.
c.
total well-being of American consumers of peaches is enhanced relative to the no-trade situation.
d.
total well-being of the United States is enhanced relative to the no-trade situation.
Figure 9-5
The figure illustrates the market for tricycles in a country.
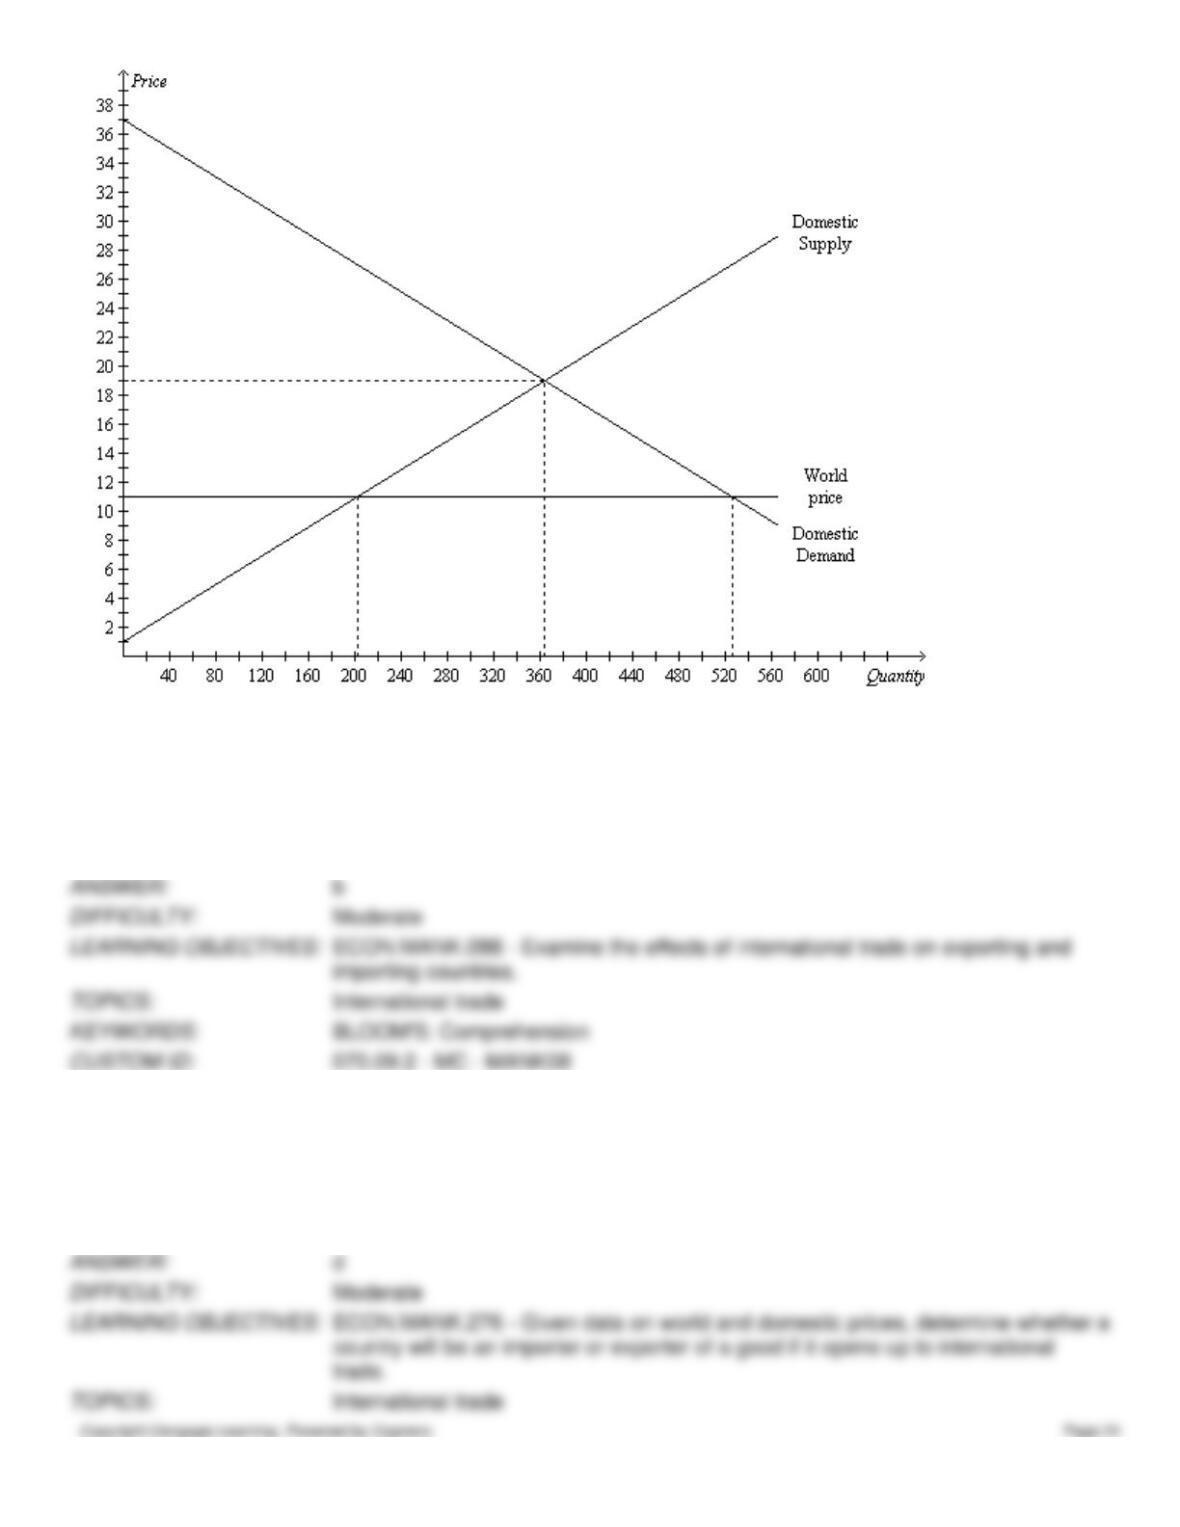
70. Refer to Figure 9-5. The horizontal line at the world price of tricycles represents the
a.
demand for tricycles from the rest of the world.
b.
supply of tricycles from the rest of the world.
c.
level of inefficiency in the domestic market caused by trade.
d.
surplus in the domestic tricycle market.
71. Refer to Figure 9-5. With trade, this country
a.
exports 160 tricycles.
b.
exports 320 tricycles.
c.
imports 160 tricycles.
d.
imports 320 tricycles.
72. Refer to Figure 9-5. Without trade, consumer surplus amounts to
a.
$810.
b.
$1,620.
c.
$3,240.
d.
$6,480.
73. Refer to Figure 9-5. Without trade, producer surplus amounts to
a.
$810.
b.
$1,620.
c.
$3,240.
d.
$6,480.
74. Refer to Figure 9-5. Without trade, total surplus amounts to
a.
$810.
b.
$1,620.
c.
$3,240.
d.
$6,480.
75. Refer to Figure 9-5. With trade, the price of tricycles in this country is
a.
$11, with 200 tricycles produced in this country and another 320 tricycles imported.
b.
$11, with 360 tricycles produced in this country and another 160 tricycles imported.
c.
$19, with 200 tricycles produced in this country and another 160 tricycles imported.
d.
$19, with 360 tricycles produced in this country and another 320 tricycles imported.
76. Refer to Figure 9-5. With trade, consumer surplus is
a.
$3,240.
b.
$6,480.
c.
$6,760.
d.
$13,520.
77. Refer to Figure 9-5. With trade, producer surplus is
a.
$500.
b.
$1,000.
c.
$1,500.
d.
$2,000.
78. Refer to Figure 9-5. With trade, total surplus is
a.
$3,240.
b.
$6,480.
c.
$7,760.
d.
$15,520.
79. Refer to Figure 9-5. Total surplus with trade exceeds total surplus without trade by
a.
$640.
b.
$1,280.
c.
$2,560.
d.
$3,840.
80. Refer to Figure 9-5. The increase in total surplus resulting from trade is
a.
$640, since consumer surplus increases by $1,760 and producer surplus falls by $1,120.
b.
$1,280, since consumer surplus increases by $3,520 and producer surplus falls by $2,240.
c.
$2,240, since consumer surplus increases by $3,240 and producer surplus falls by $1,000.
d.
$2,560, since consumer surplus increases by $7,040 and producer surplus falls by $4,480.
81. Refer to Figure 9-5. If this country allows free trade in tricycles,
a.
consumers will gain and producers will lose.
b.
consumers will lose and producers will gain.
c.
both consumers and producers will gain.
d.
both consumers and producers will lose.
82. Refer to Figure 9-5. If this country allows free trade in tricycles,
a.
consumers will gain more than producers will lose.
b.
producers will gain more than consumers will lose.
c.
producers and consumers will both gain equally.
d.
producers and consumers will both lose equally.
83. Refer to Figure 9-5. Bearing in mind that this country is “small,” which of the following events conceivably could
cause the country to switch from being an importer of tricycles to an exporter of tricycles?
a.
Incomes of domestic citizens increase, and tricycles are a normal good.
b.
Within this country, the price of a substitute for tricycles decreases.
c.
Within this country, the price of a complement to tricycles decreases.
d.
Wages increase for domestic workers who produce tricycles.
84. Refer to Figure 9-5. Bearing in mind that this country is “small,” what would happen if there were a decrease in the
price of tricycle helmets within this country, given that tricycles and tricycle helmets are complements?
a.
The quantity of tricycles that this country imports would increase.
b.
The quantity of tricycles that this country imports would decrease, but the country would still be an importer
of tricycles.
c.
This country would switch from being an importer of tricycles to an exporter of tricycles.
d.
The domestic price without trade would move closer to the world price.
Figure 9-6
The figure illustrates the market for roses in a country.
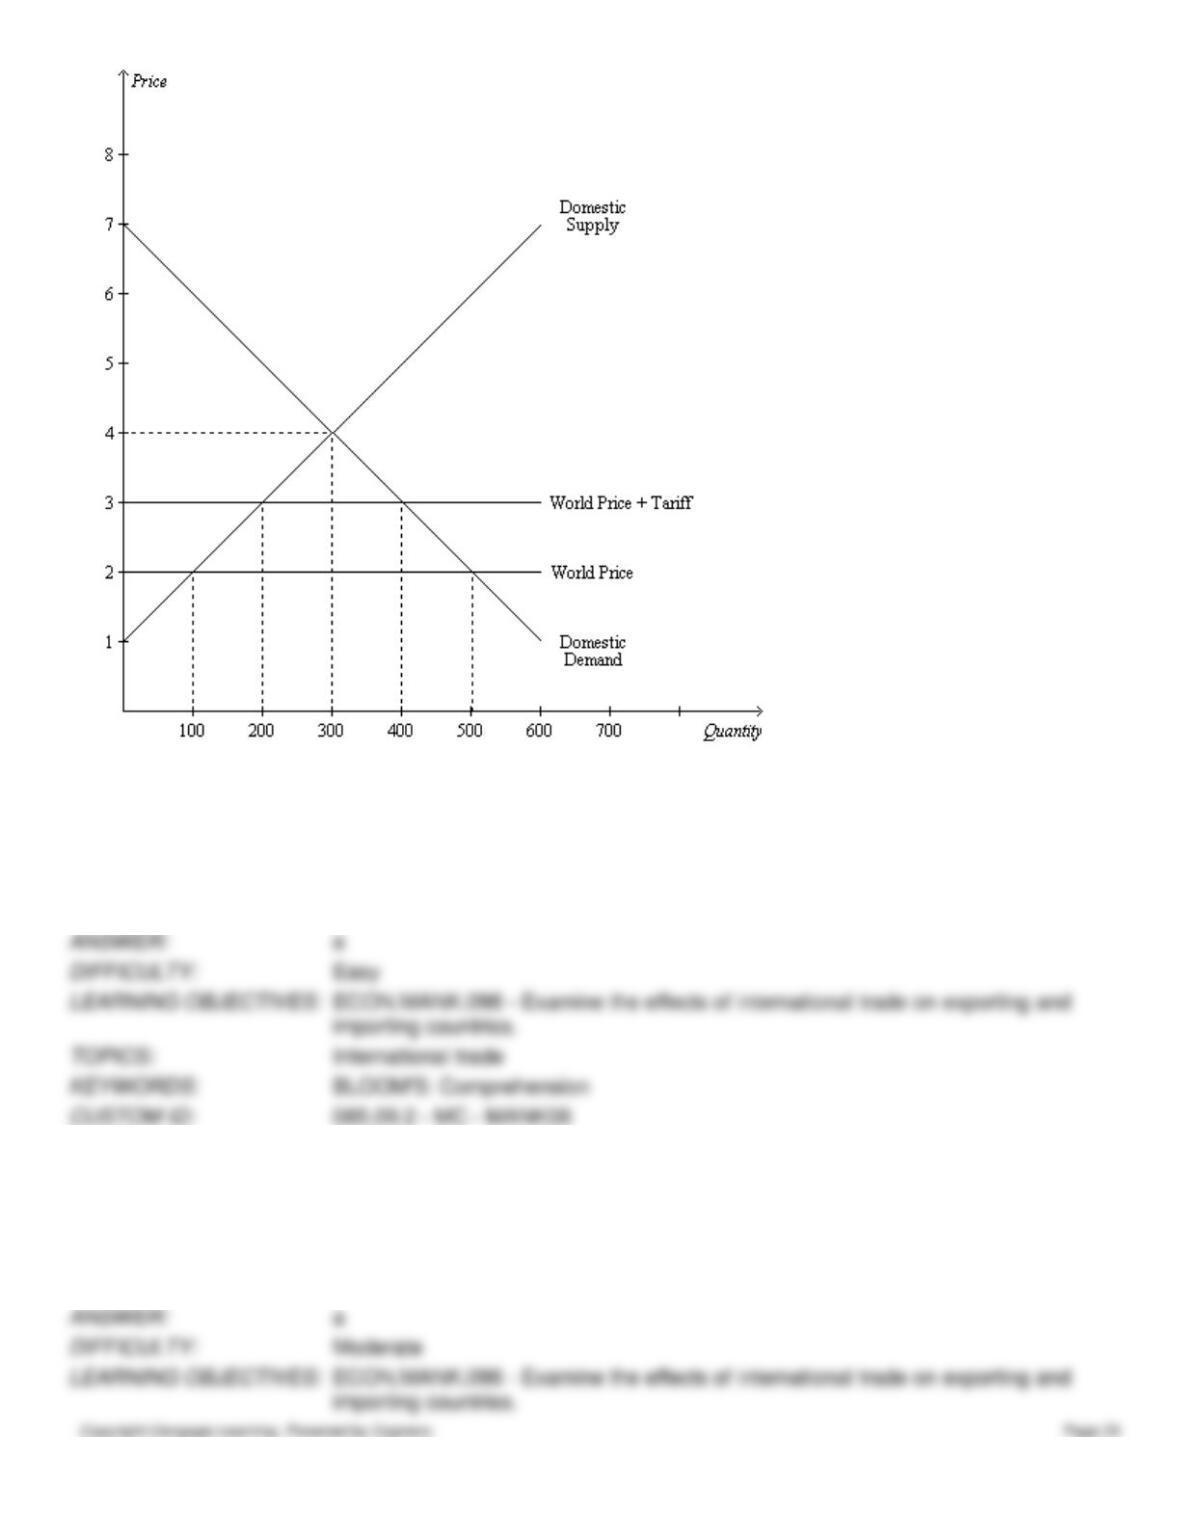
85. Refer to Figure 9-6. Without trade, the equilibrium price of roses is
a.
$4 and the equilibrium quantity is 300.
b.
$3 and the equilibrium quantity is 200.
c.
$3 and the equilibrium quantity is 400.
d.
$2 and the equilibrium quantity is 500.
86. Refer to Figure 9-6. With trade and without a tariff,
a.
the domestic price is equal to the world price.
b.
roses are sold at $4 in this market.
c.
there is a shortage of 400 roses in this market.
d.
this country imports 200 roses.
87. Refer to Figure 9-6. Before the tariff is imposed, this country
a.
imports 200 roses.
b.
imports 400 roses.
c.
exports 200 roses.
d.
exports 400 roses.
88. Refer to Figure 9-6. The size of the tariff on roses is
a.
$4.
b.
$2.
c.
$2.
d.
$1.
89. Refer to Figure 9-6. The imposition of a tariff on roses
a.
increases the number of roses imported by 100.
b.
increases the number of roses imported by 200.
c.
decreases the number of roses imported by 200.
d.
decreases the number of roses imported by 400.
90. Refer to Figure 9-6. The amount of revenue collected by the government from the tariff is
a.
$200.
b.
$400.
c.
$500.
d.
$600.
91. Refer to Figure 9-6. When a tariff is imposed in the market, domestic producers
a.
gain $100 of producer surplus.
b.
gain $150 of producer surplus.
c.
gain $200 of producer surplus.
d.
gain $300 of producer surplus.
92. Refer to Figure 9-6. The amount of deadweight loss caused by the tariff equals
a.
$100.
b.
$200.
c.
$400.
d.
$500.
93. Refer to Figure 9-6. When the tariff is imposed, domestic consumers
a.
lose by $200.
b.
lose by $450.
c.
gain by $200.
d.
gain by $450.
94. The before-trade price of fish in Germany is $8.00 per pound. The world price of fish is $6.00 per pound. Germany is
a price-taker in the fish market. If Germany allows trade in fish, then Germany will become an
a.
importer of fish and the price of fish in Germany will be $6.00.
b.
importer of fish and the price of fish in Germany will be $8.00.
c.
exporter of fish and the price of fish in Germany will be $6.00.
d.
exporter of fish and the price of fish in Germany will be $8.00.
95. The before-trade price of fish in Denmark is $10.00 per pound. The world price of fish is $6.00 per pound. Denmark is
a price-taker in the fish market. If Denmark begins to allow trade in fish, its consumers of fish will become
a.
better off, its producers of fish will become better off, and on balance the citizens of Denmark will become
better off.
b.
worse off, its producers of fish will become better off, and on balance the citizens of Denmark will become
worse off.
c.
worse off, its producers of fish will become better off, and on balance the citizens of Denmark will become
worse off.
d.
better off, its producers of fish will become worse off, and on balance the citizens of Denmark will become
better off.
Figure 9-7. The figure applies to the nation of Wales and the good is cheese.
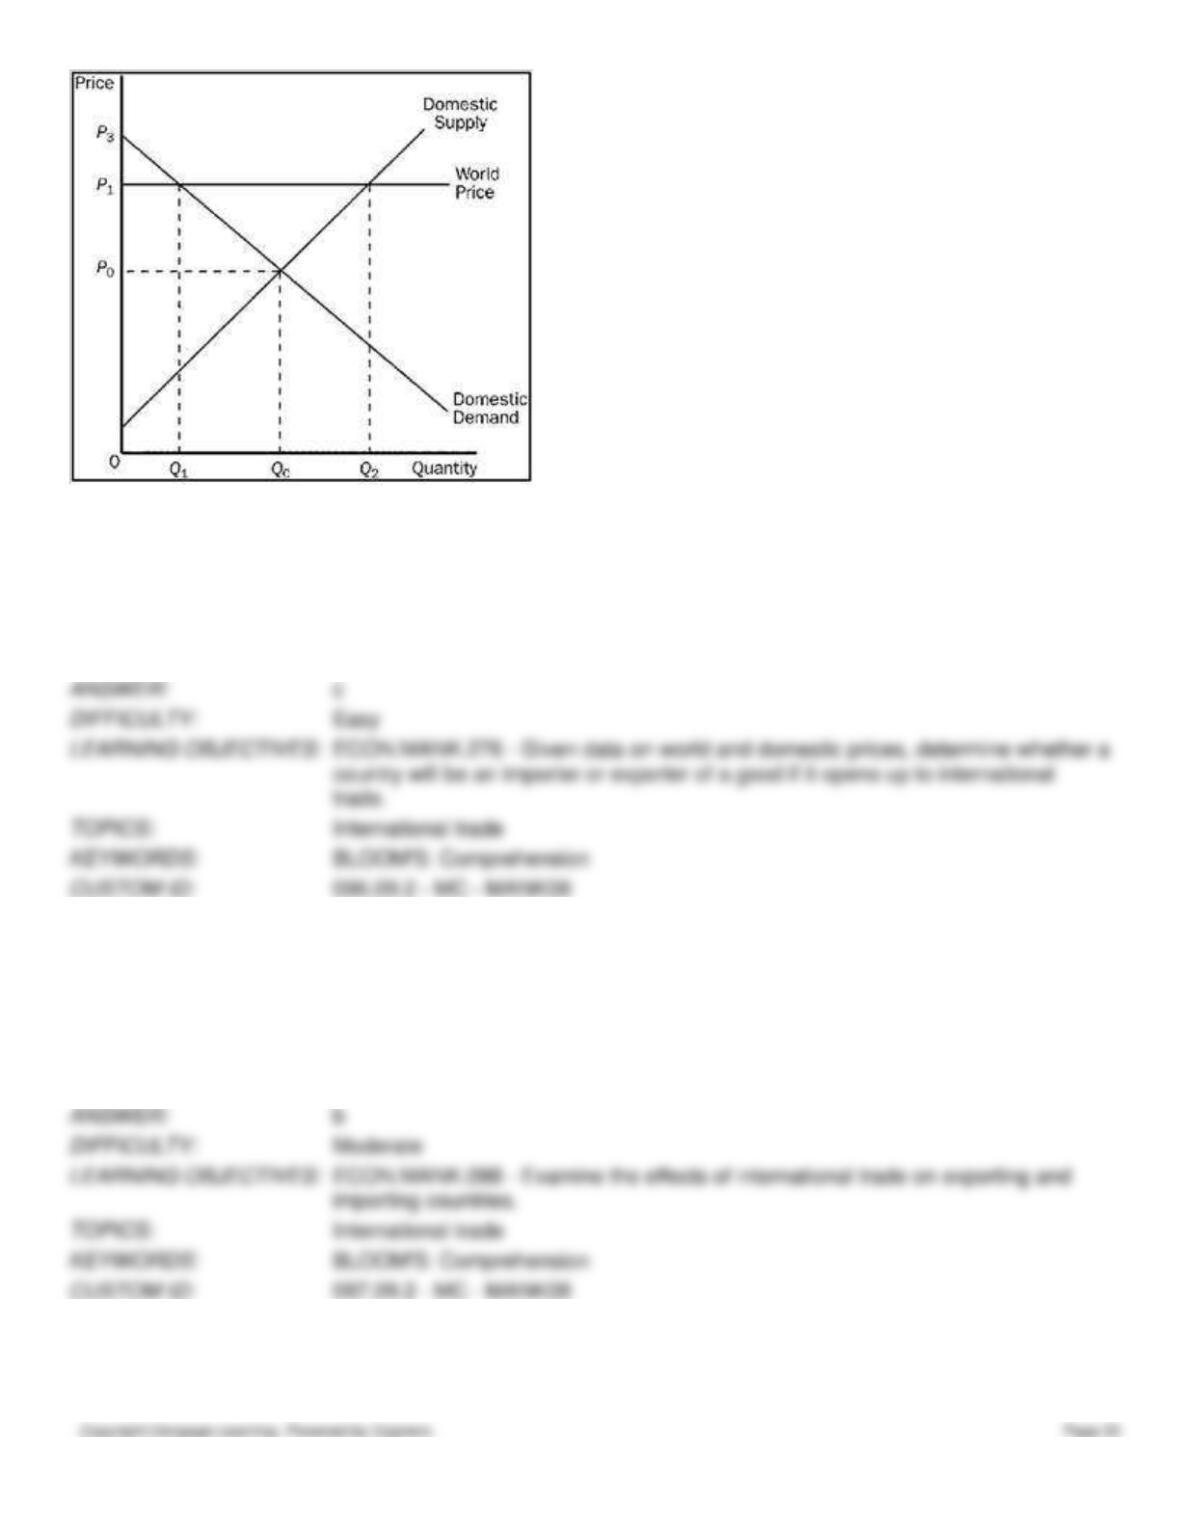
96. Refer to Figure 9-7. The equilibrium price and the equilibrium quantity of cheese in Wales before trade are
a.
P1 and Q2.
b.
P1 and Q1.
c.
P0 and Q0.
d.
P0 and Q1.
97. Refer to Figure 9-7. With trade, the Welsh price of cheese and the Welsh quantity of cheese demanded are
a.
P1 and Q2.
b.
P1 and Q1.
c.
P0 and Q0.
d.
P3 and Q1.
98. Refer to Figure 9-7. With trade, Wales
a.
imports Q2 – Q1 units of cheese.
b.
exports Q2 – Q1 units of cheese.
c.
imports Q2 – Q0 units of cheese.
d.
exports Q2 – Q0 units of cheese.
99. Refer to Figure 9-7. Which of the following is a valid equation for Welsh consumer surplus with trade?
a.
Consumer surplus with trade = (1/2)(Q0)(P1 – P0).
b.
Consumer surplus with trade = (1/2)(Q0)(P3 – P0).
c.
Consumer surplus with trade = (1/2)(Q1)(P3 – P1).
d.
None of the above is correct.
100. Refer to Figure 9-7. Which of the following is a valid equation for Welsh producer surplus with trade?
a.
Producer surplus with trade = (1/2)P0Q0.
b.
Producer surplus with trade = (1/2)P1Q1.
c.
Producer surplus with trade = (1/2)P1Q2.
d.
None of the above is correct.
101. Refer to Figure 9-7. Which of the following is a valid equation for the gains from trade?
a.
Gains from trade = (1/2)(P1 – P0)(Q2 – Q1).
b.
Gains from trade = (1/2)(P1 – P0)(Q2 – Q0)
c.
Gains from trade = (1/2)(P1 – P0)(Q1 + Q2).
d.
Gains from trade = (1/2)(Q1)(P3 – P1).
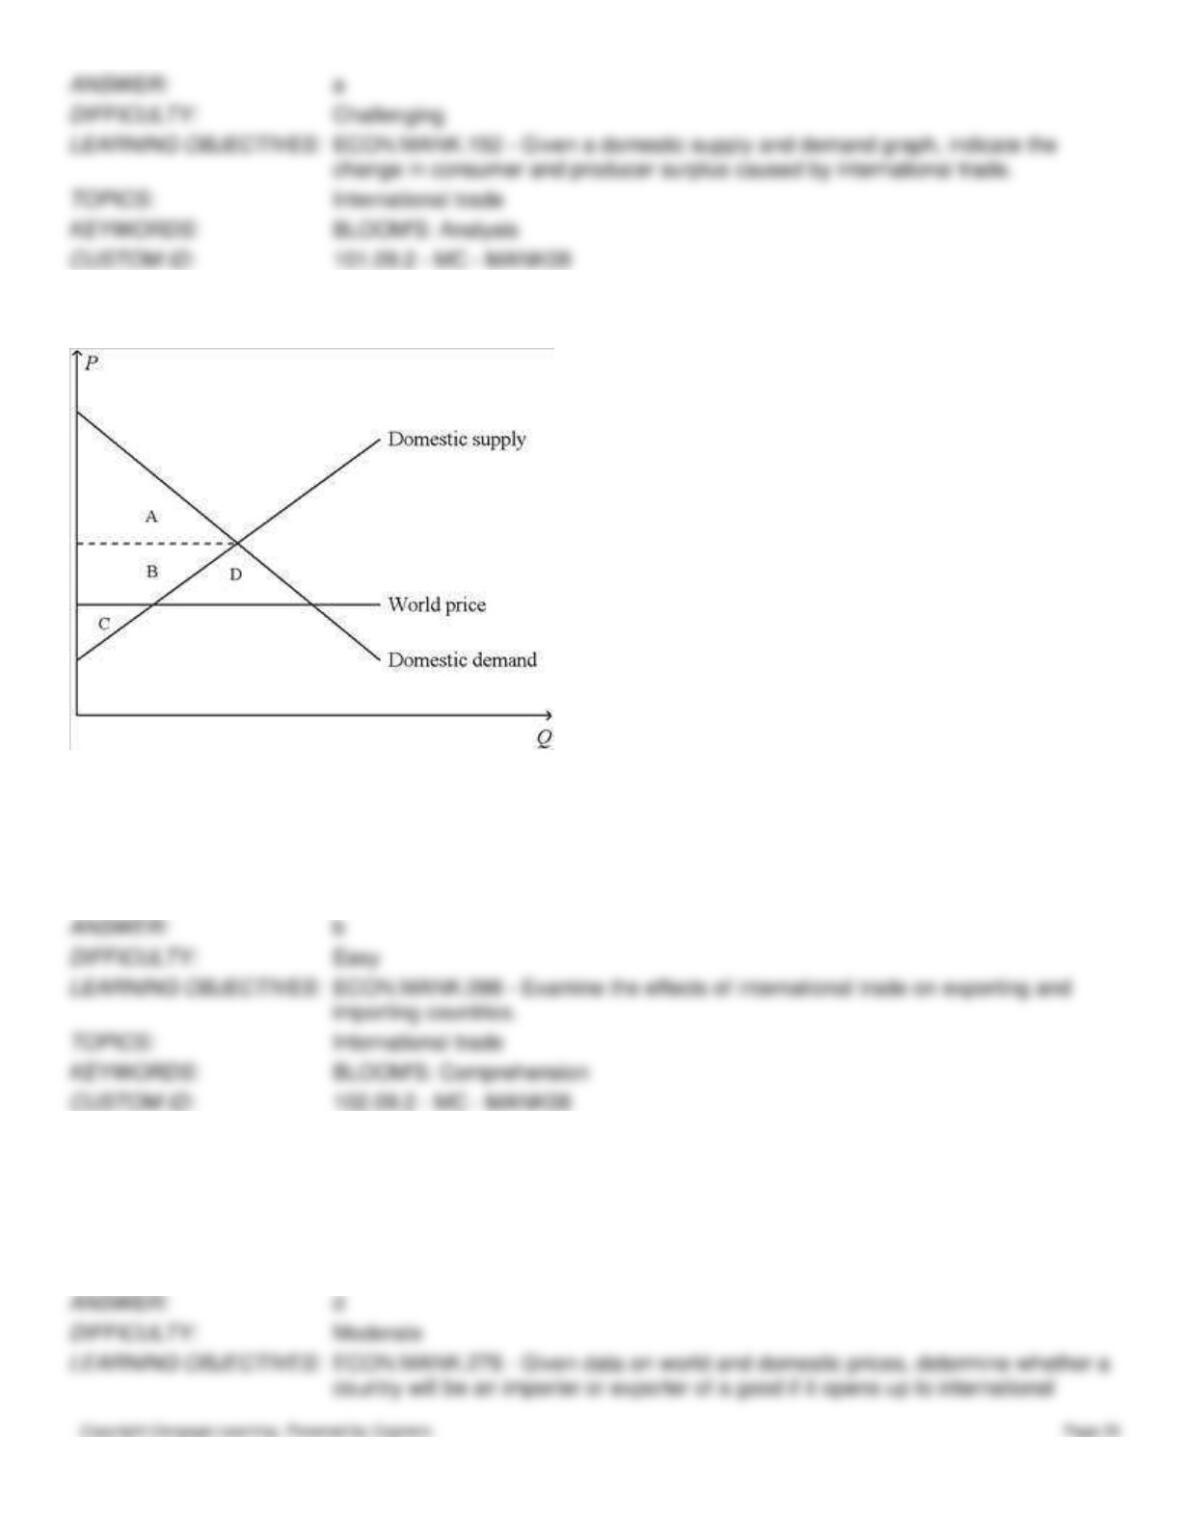
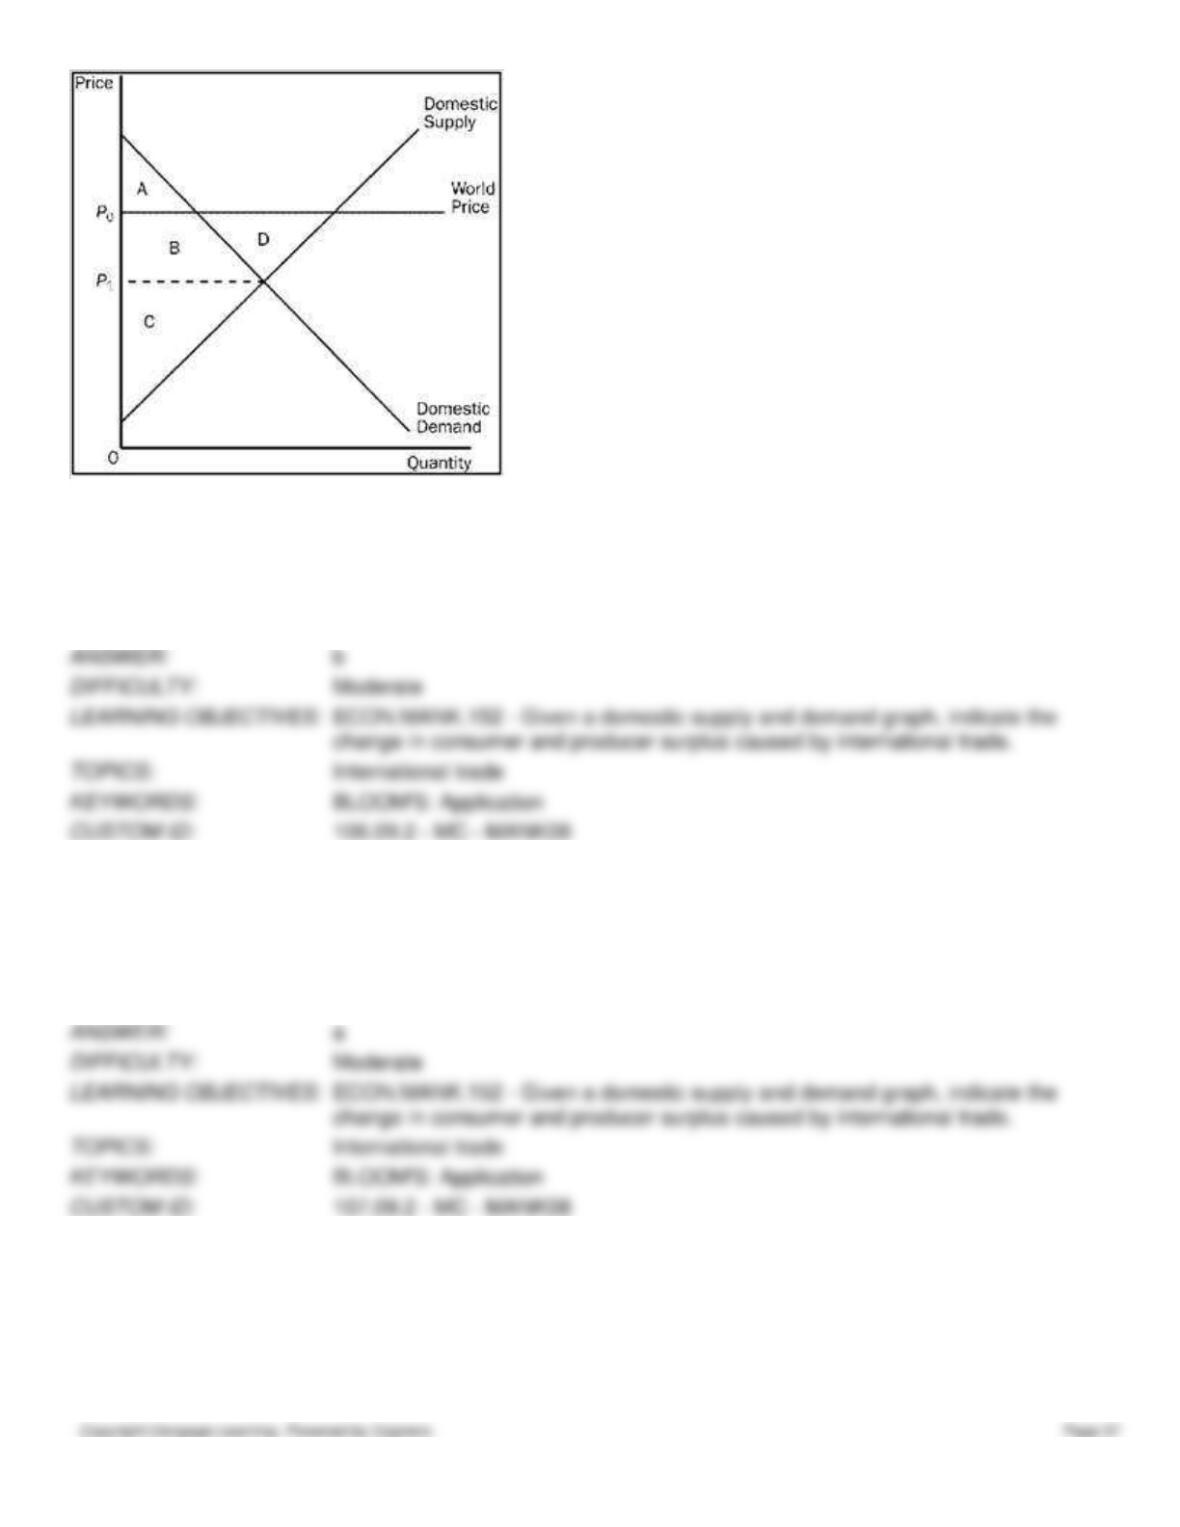
Figure 9-8. On the diagram below, Q represents the quantity of cars and P represents the price of cars.
102. Refer to Figure 9-8. The price corresponding to the horizontal dotted line on the graph represents the price of cars
a.
after trade is allowed.
b.
before trade is allowed.
c.
that maximizes total surplus when trade is allowed.
d.
that minimizes the well-being of domestic car producers when trade is allowed.
103. Refer to Figure 9-8. The country for which the figure is drawn
a.
has a comparative advantage relative to other countries in the production of cars and it will export cars.
b.
has a comparative advantage relative to other countries in the production of cars and it will import cars.
c.
has a comparative disadvantage relative to other countries in the production of cars and it will export cars.
d.
has a comparative disadvantage relative to other countries in the production of cars and it will import cars.
104. Refer to Figure 9-8. When the country for which the figure is drawn allows international trade in cars,
a.
consumer surplus increases by the area B.
b.
producer surplus decreases by the area B + D.
c.
total surplus increases by the area D.
d.
All of the above are correct.
105. Refer to Figure 9-8. In the country for which the figure is drawn, total surplus with international trade in cars
a.
is represented by the area A + B + C.
b.
is represented by the area A + B + D.
c.
is smaller than producer surplus without international trade in cars.
d.
is larger than total surplus without international trade in cars.
Figure 9-9
106. Refer to Figure 9-9. Consumer surplus in this market before trade is
a.
A.
b.
A + B.
c.
A + B + D.
d.
C.
107. Refer to Figure 9-9. Consumer surplus in this market after trade is
a.
A.
b.
A + B.
c.
A + B + D.
d.
C.
108. Refer to Figure 9-9. Producer surplus in this market before trade is
a.
A.
b.
A + B.
c.
B + C + D.
d.
C.
109. Refer to Figure 9-9. Producer surplus in this market after trade is
a.
A.
b.
A + B.
c.
B + C + D.
d.
C.
110. Refer to Figure 9-9. Total surplus in this market before trade is
a.
A + B.
b.
A + B + C.
c.
A + B + C + D.
d.
B + C + D.
111. Refer to Figure 9-9. Total surplus in this market after trade is
a.
A + B.
b.
A + B + C.
c.
A + B + C + D.
d.
B + C + D.
112. Refer to Figure 9-9. The change in total surplus in this market because of trade is
a.
D, and this area represents a loss of total surplus because of trade.
b.
D, and this area represents a gain in total surplus because of trade.
c.
B + D, and this area represents a loss of total surplus because of trade.
d.
B + D, and this area represents a gain in total surplus because of trade.
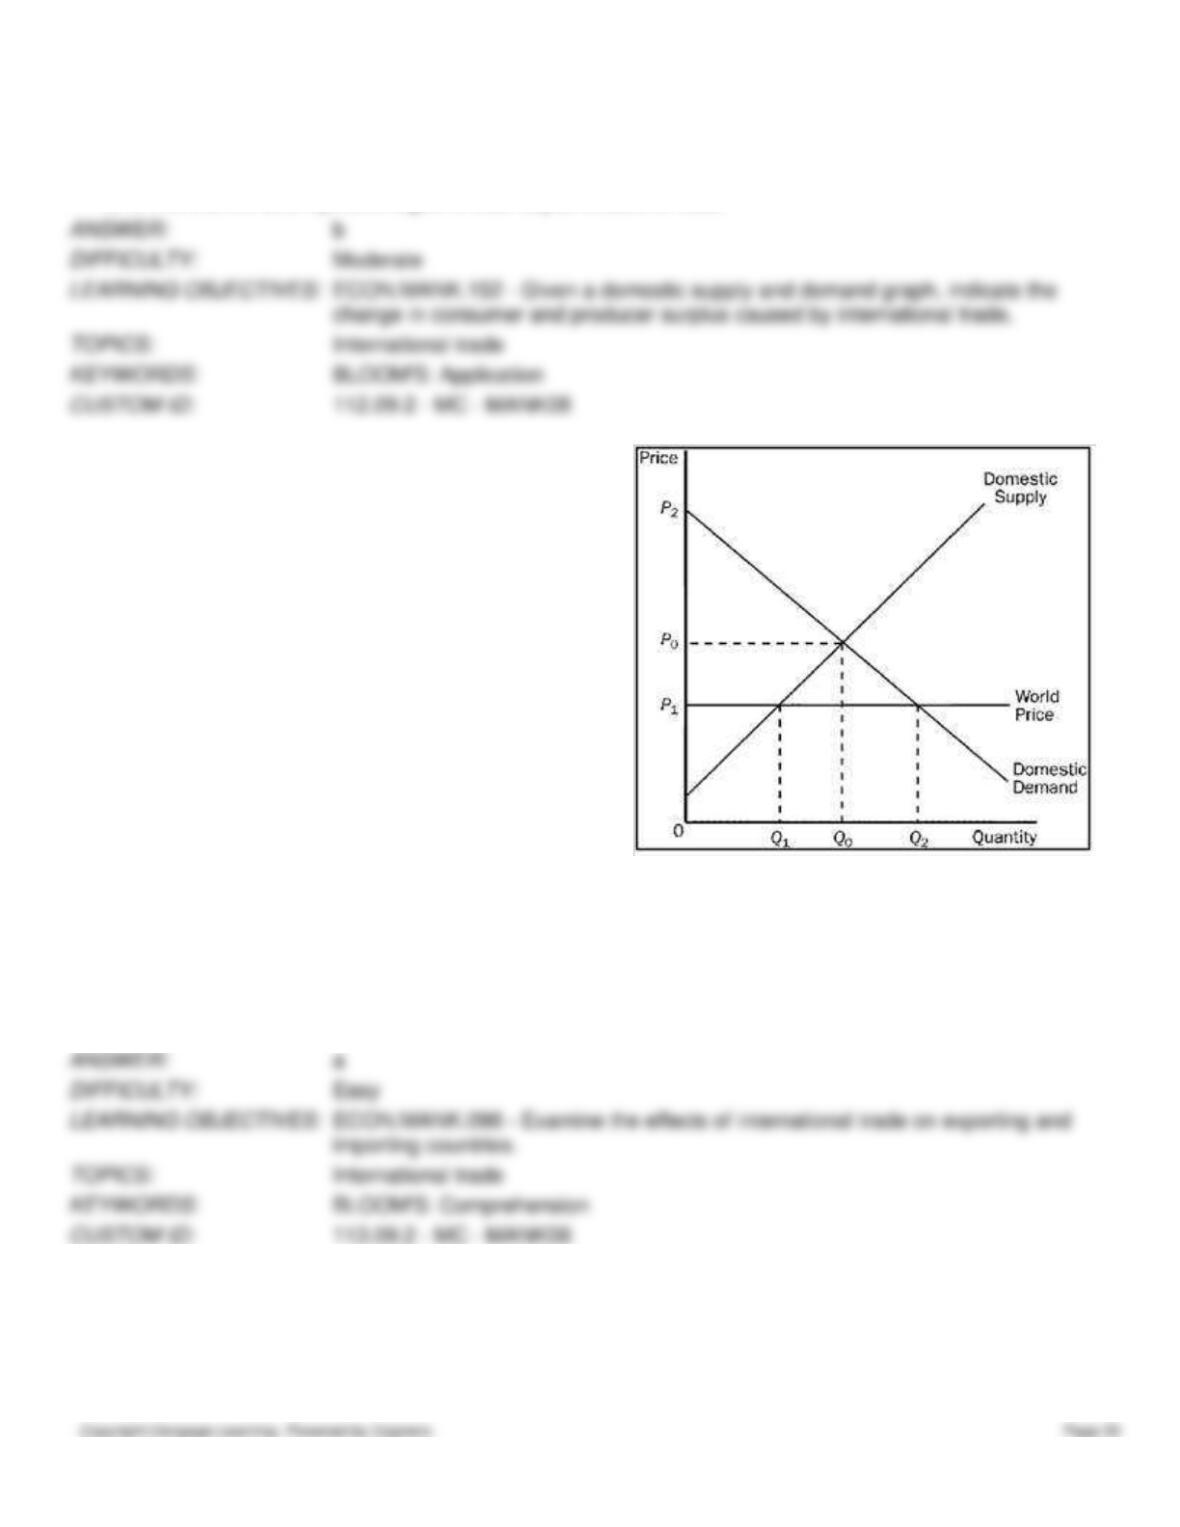
Figure 9-10. The figure applies to Mexico and the good is rifles.
113. Refer to Figure 9-10. The price and quantity of rifles in Mexico before trade is
a.
P0 and Q0.
b.
P1 and Q1.
c.
P2 and Q2.
d.
P1 and Q0.
114. Refer to Figure 9-10. With trade, the equilibrium price of rifles and the equilibrium quantity of rifles demanded in
Mexico are
a.
P1 and Q1.
b.
P1 and Q2.
c.
P2 and Q2.
d.
P0 and Q0.
115. Refer to Figure 9-10. When trade takes place, the quantity Q2 – Q1 is
a.
the number of rifles bought and sold in Mexico.
b.
the number of rifles produced in Mexico.
c.
the number of rifles exported by Mexico.
d.
the number of rifles imported by Mexico.
116. Refer to Figure 9-10. Mexico’s gains from trade are represented by the area that is bounded by the points
a.
(0, P0), (Q0, P0), (Q2, P1), and (0, P1).
b.
(0, P1), (0, P2), (Q0, P0), and (Q1, P1).
c.
(Q0, P0), (Q2, P1), and (Q1, P1).
d.
(0, P0), (0, P2), and (Q0, P0).
117. Refer to Figure 9-10. The area bounded by the points (Q0, P0), (Q2, P1), and (Q1, P1) represents
a.
Mexico’s gains from trade.
b.
the amount by which Mexico’s gain in consumer surplus exceeds its loss in producer surplus due to trade.
c.
Mexico’s gain in total surplus due to trade.
d.
All of the above are correct.