Subjective Short Answer
1. Suppose in the country of Jumanji that the price of coffee with no trade allowed is below the world price of coffee. If
Jumanji allows free trade, will Jumanji be an importer or an exporter of coffee?
2. Suppose in the country of Jumanji that the price of wheat with no trade allowed is above the world price of wheat. If
Jumanji allows free trade, will Jumanji be an importer or an exporter of wheat?
3. Suppose in the country of Nash that the price of corn is $4 per bushel with no trade allowed. If the world price of corn
is $3 per bushel and if Nash allows free trade, will Nash be an importer or an exporter of corn?
4. Suppose in the country of Nash that the price of oranges is $8 per bushel with no trade allowed. If the world price of
oranges is $10 per bushel and if Nash allows free trade, will Nash be an importer or an exporter of oranges?
5. A tax on an imported good is called a ______ .
6. A country has a comparative advantage in a product if the world price is _____ than that country’s domestic price
without trade.
7. Suppose the world price of coffee is $3 per pound and Brazil’s domestic price of coffee without trade is $2 per pound.
If Brazil allows free trade, will Brazil be an importer or an exporter of coffee?
8. Suppose the world price of coffee is $2 per pound and Brazil’s domestic price of coffee without trade is $3 per pound.
If Brazil allows free trade, will Brazil be an importer or an exporter of coffee?
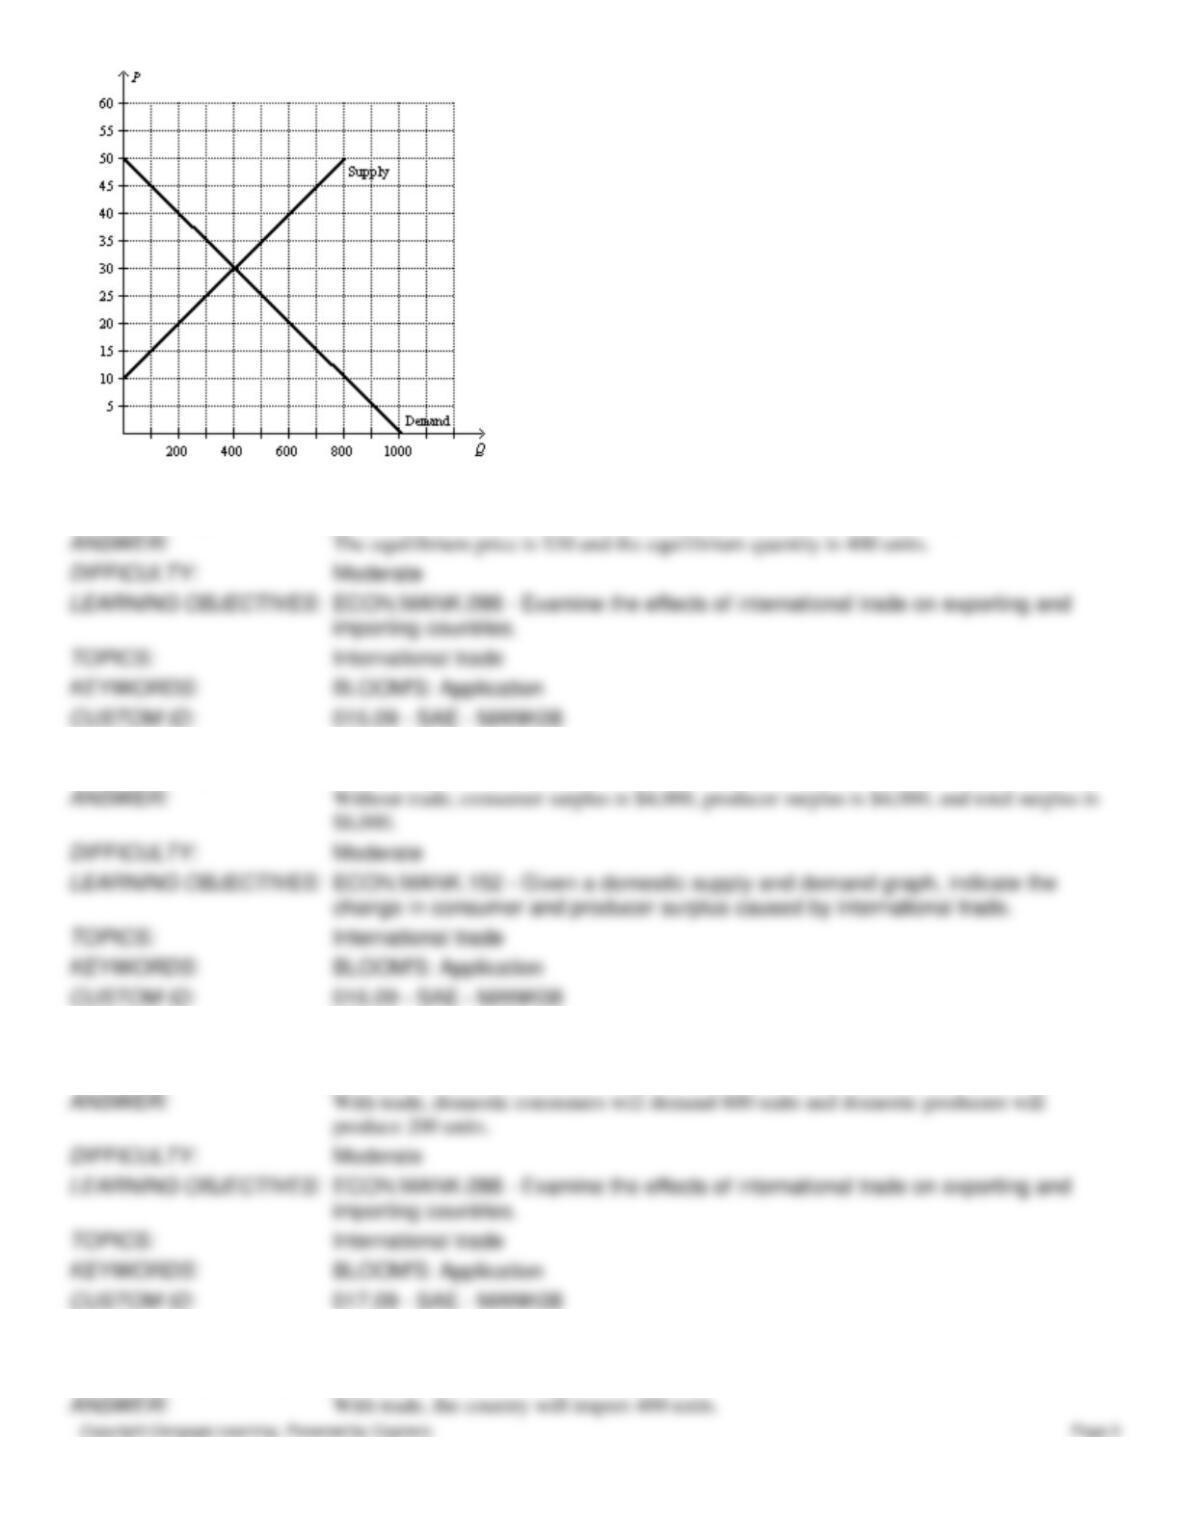
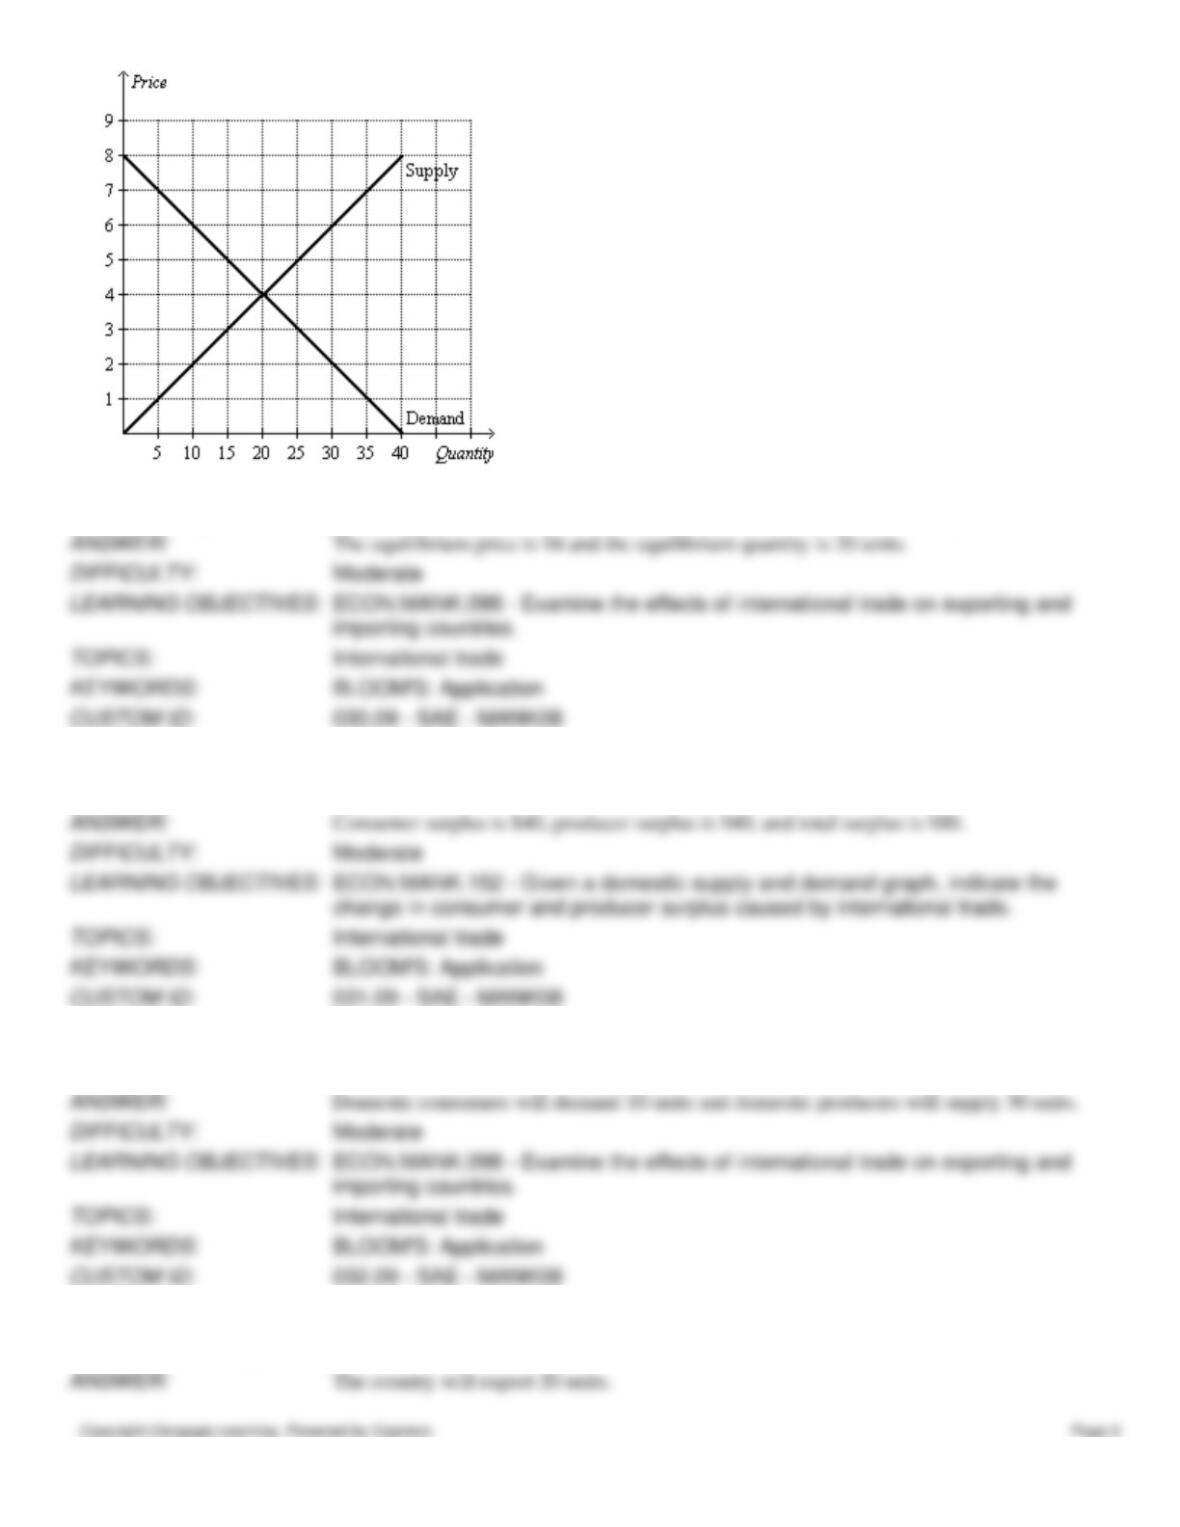
Figure 9-26
The following diagram shows the domestic demand and domestic supply curves in a market.
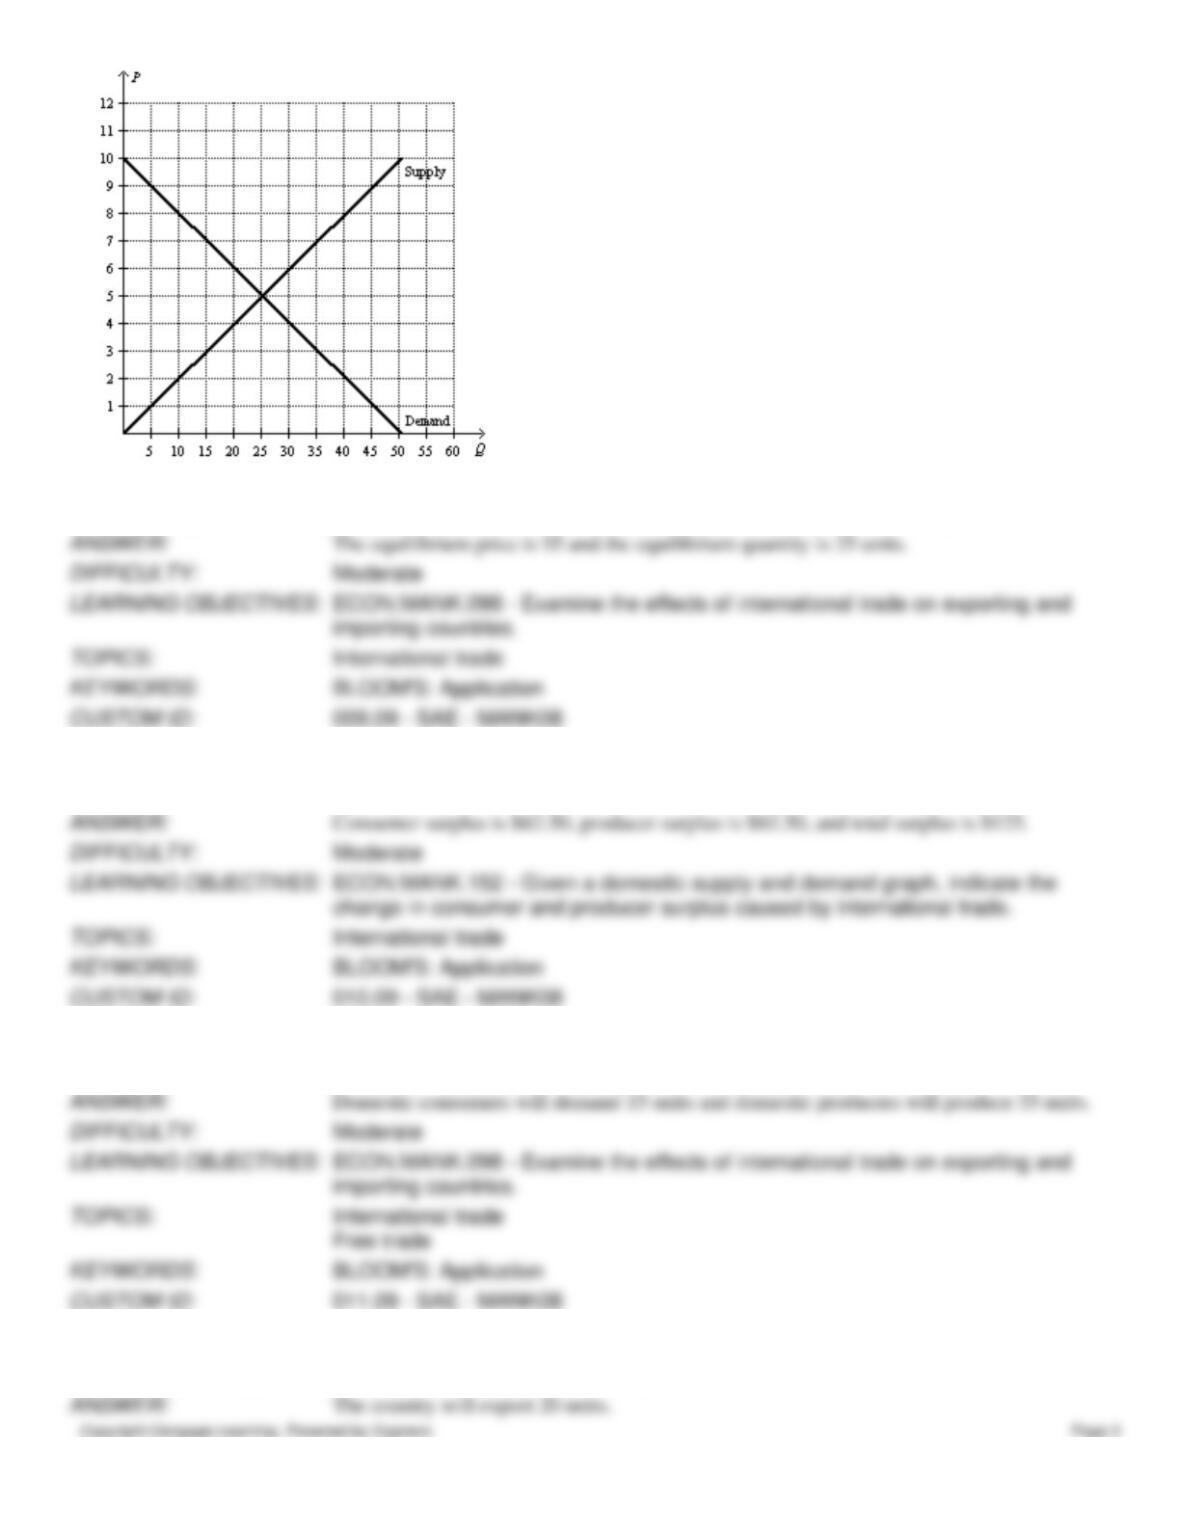
9. Refer to Figure 9-26. With no trade allowed, what are the equilibrium price and equilibrium quantity in this market?
10. Refer to Figure 9-26. With no trade allowed, how much are consumer surplus, producer surplus, and total surplus in
this market?
11. Refer to Figure 9-26. Suppose the world price in this market is $7. If the country allows free trade, how many units
will domestic consumers demand, and how many units will domestic producers produce?
12. Refer to Figure 9-26. Suppose the world price in this market is $7. If the country allows free trade, will the country
import or export this good, and how many units will be imported/exported?
13. Refer to Figure 9-26. Suppose the world price in this market is $7. If the country allows free trade, how much are
consumer surplus, producer surplus, and total surplus with trade?
14. Refer to Figure 9-26. Suppose the world price in this market is $7. If the country allows free trade, by how much do
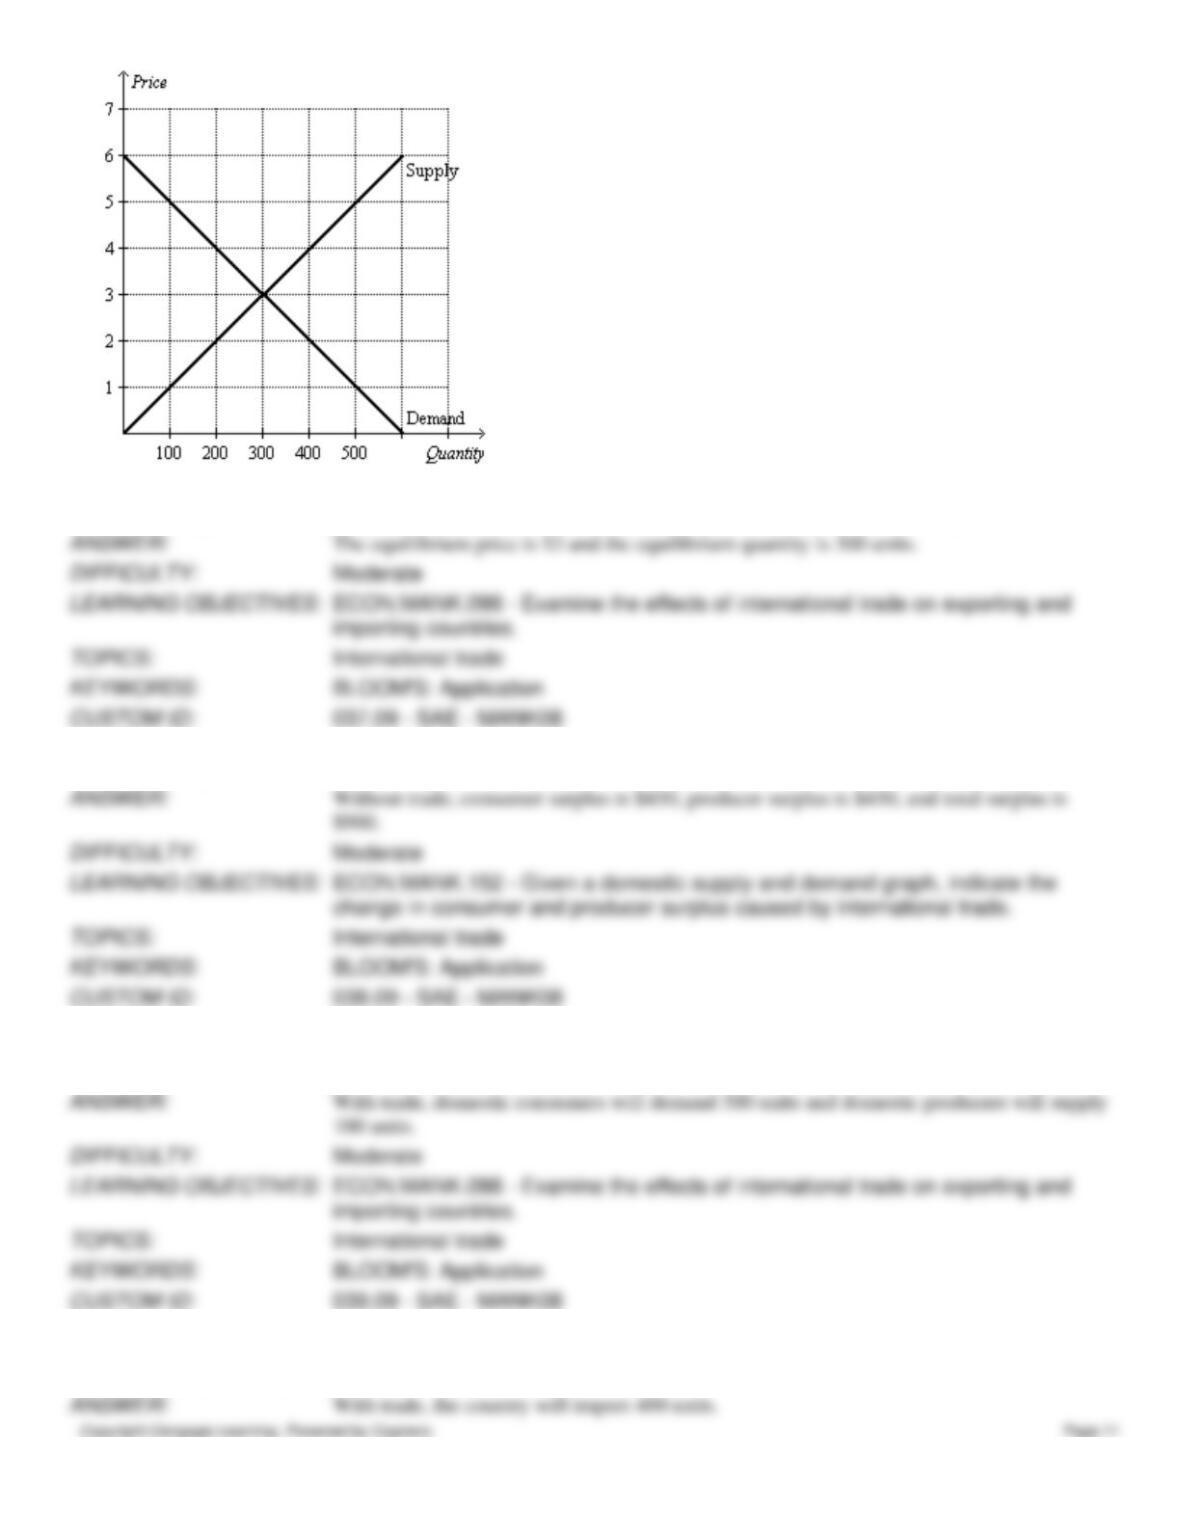
Figure 9-27
The following diagram shows the domestic demand and supply curves in a market. Assume that the world price in this
market is $20 per unit.
15. Refer to Figure 9-27. With no trade allowed, what are the equilibrium price and equilibrium quantity in this market?
16. Refer to Figure 9-27. With no trade allowed, how much are consumer surplus, producer surplus, and total surplus?
17. Refer to Figure 9-27. If the country allows free trade, how many units will domestic consumers demand and how
many units will domestic producers produce?
18. Refer to Figure 9-27. If the country allows free trade, will the country import or export this good, and how many
units will be imported/exported?
19. Refer to Figure 9-27. If the country allows free trade, how much are consumer surplus, producer surplus, and total
surplus with trade?
20. Refer to Figure 9-27. If the country allows free trade, by how much do consumer surplus, producer surplus, and total
surplus change with trade?
21. Refer to Figure 9-27. Suppose the country imposes a $5 per unit tariff. If the country allows trade with a tariff, how
much are consumer surplus, producer surplus, tariff revenue, and total surplus?
22. Refer to Figure 9-27. Suppose the country imposes a $5 per unit tariff. If the country allows trade with a tariff, how
much is the deadweight loss caused by the tariff?
23. Refer to Scenario 9-3. With no trade allowed, what are the equilibrium price and quantity in this market?
24. Refer to Scenario 9-3. With no trade allowed, how much are consumer surplus, producer surplus, and total surplus in
this market?
25. Refer to Scenario 9-3. Suppose the world price in this market is $8 per unit. If the country allows free trade, will the
country import or export this good, and how many units will be imported/exported?
26. Refer to Scenario 9-3. Suppose the world price in this market is $8 per unit. If the country allows free trade, how
much are consumer surplus, producer surplus, and producer surplus with trade?
27. Refer to Scenario 9-3. Suppose the world price in this market is $8 per unit. If the country allows free trade, by how
much do consumer surplus, producer surplus, and producer surplus change?
28. Refer to Scenario 9-3. Suppose the world price in this market is $8 per unit, and suppose the country imposes a $1
per unit tariff. If the country allows trade with a tariff, how much are consumer surplus, producer surplus, tariff revenue,
and total surplus?
29. Refer to Scenario 9-3. Suppose the world price in this market is $8 per unit, and suppose the country imposes a $1
per unit tariff. If the country allows trade with a tariff, how much is the deadweight loss caused by the tariff?
Figure 9-28
The following diagram shows the domestic demand and domestic supply curves in a market.
30. Refer to Figure 9-28. With no trade allowed, what are the equilibrium price and equilibrium quantity in this market?
31. Refer to Figure 9-28. With no trade allowed, how much are consumer surplus, producer surplus, and total surplus in
this market?
32. Refer to Figure 9-28. Suppose the world price in this market is $6. If the country allows free trade, how many units
will domestic consumers demand, and how many units will domestic producers supply?
33. Refer to Figure 9-28. Suppose the world price in this market is $6. If the country allows free trade, will the country
import or export this good, and how many units will be imported/exported?
34. Refer to Figure 9-28. Suppose the world price in this market is $6. If the country allows free trade, how much is
consumer surplus?
35. Refer to Figure 9-28. Suppose the world price in this market is $6. If the country allows free trade, how much is
producer surplus?
36. Refer to Figure 9-28. Suppose the world price in this market is $6. If the country allows free trade, how much is total
surplus?
Figure 9-29
The following diagram shows the domestic demand and domestic supply curves in a market. Assume that the world price
in this market is $1 per unit.
37. Refer to Figure 9-29. With no trade allowed, what are the equilibrium price and equilibrium quantity in this market?
38. Refer to Figure 9-29. With no trade allowed, how much are consumer surplus, producer surplus, and total surplus?
39. Refer to Figure 9-29. If the country allows free trade, how many units will domestic consumers demand and how
many units will domestic producers supply?
40. Refer to Figure 9-29. If the country allows free trade, will the country import or export this good, and how many
units will be imported/exported?
41. Refer to Figure 9-29. If the country allows free trade, how much are consumer surplus, producer surplus, and total
surplus with trade?
42. Refer to Figure 9-29. Suppose the country imposes a $1 per unit tariff. If the country allows trade with a tariff, what
will be the domestic price in this market?
43. Refer to Figure 9-29. Suppose the country imposes a $1 per unit tariff. If the country allows trade with a tariff, how
many units will domestic consumers demand and how many units will domestic producers supply?
44. Refer to Figure 9-29. Suppose the country imposes a $1 per unit tariff. If the country allows trade with a tariff, how
many units will be imported?
45. Refer to Figure 9-29. Suppose the country imposes a $1 per unit tariff. If the country allows trade with a tariff, how
much are consumer surplus and producer surplus?
46. Refer to Figure 9-29. Suppose the country imposes a $1 per unit tariff. If the country allows trade with a tariff, how
much is tariff revenue?
47. Refer to Figure 9-29. Suppose the country imposes a $1 per unit tariff. If the country allows trade with a tariff, how
much is total surplus?
48. Refer to Figure 9-29. Suppose the country imposes a $1 per unit tariff. If the country allows trade with a tariff, how
much is the deadweight loss caused by the tariff?
49. List four benefits of international trade.
and enhanced flow of ideas
50. List five arguments given to support trade restrictions.
competition argument; and the protection-as-a-bargaining-chip argument.
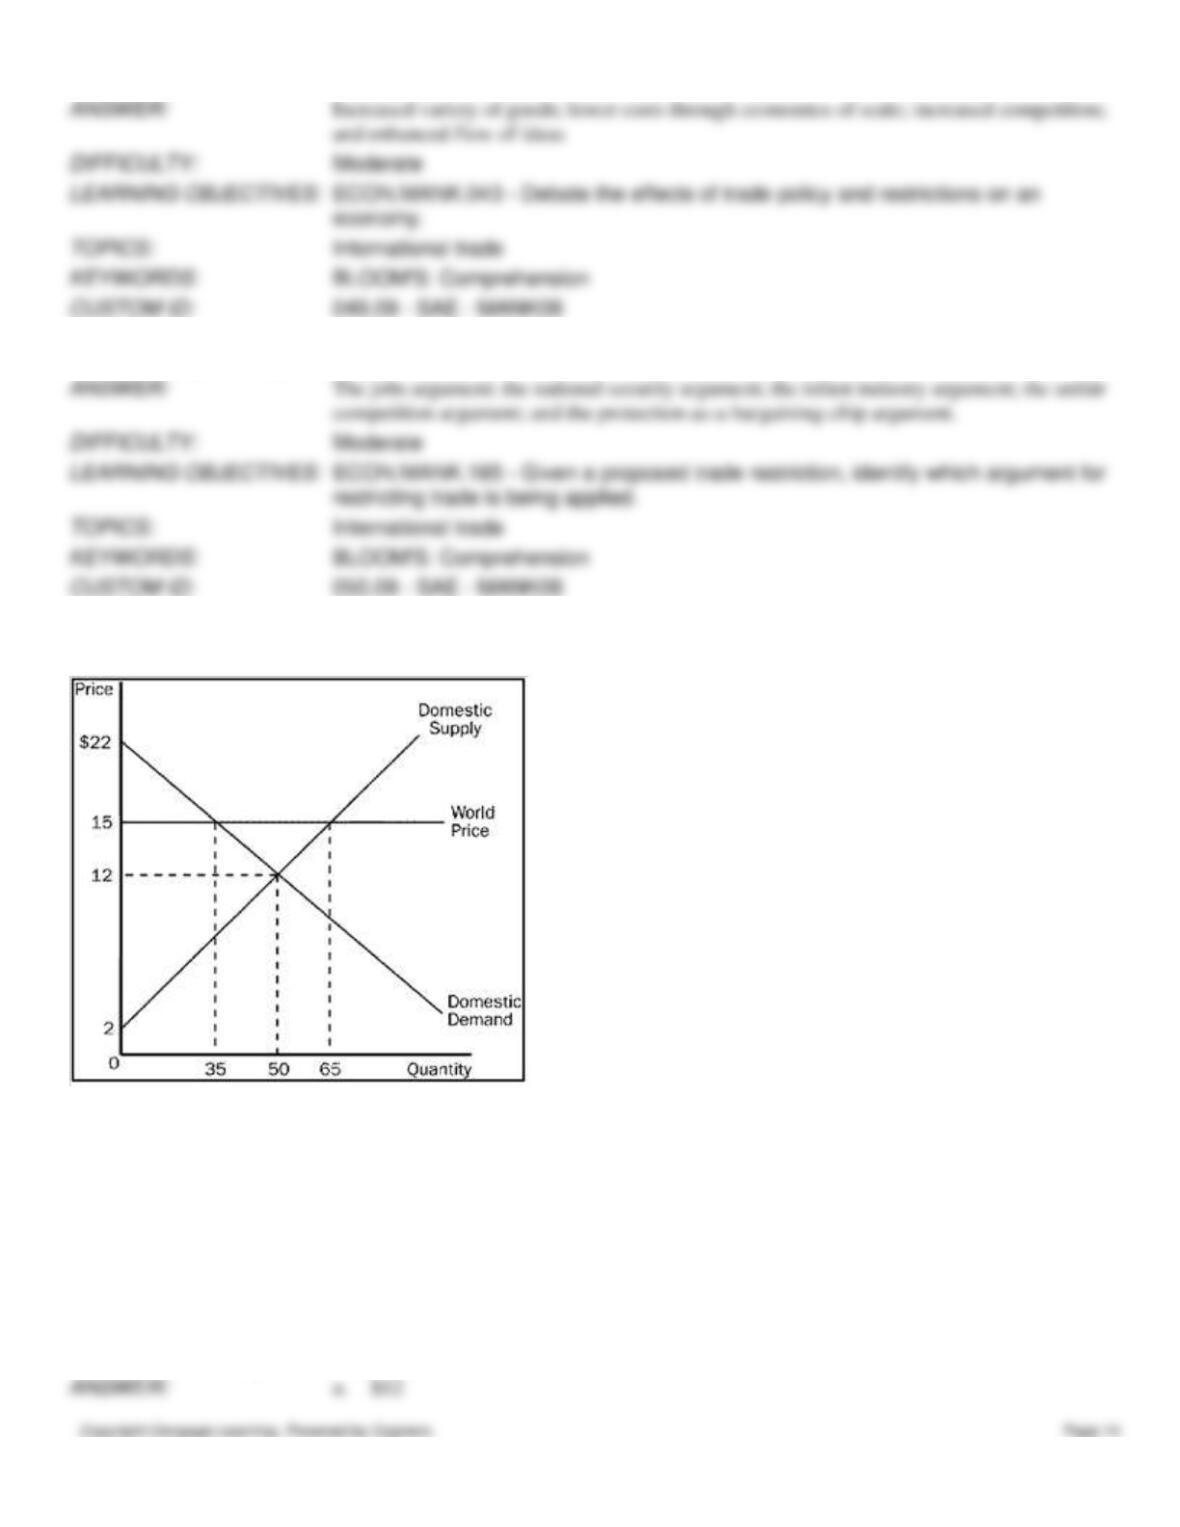
51. Use the graph to answer the following questions about CDs.
a.
What is the equilibrium price of CDs before trade?
b.
What is the equilibrium quantity of CDs before trade?
c.
What is the price of CDs after trade is allowed?
d.
What is the quantity of CDs exported after trade is allowed?
e.
What is the amount of consumer surplus before trade?
f.
What is the amount of consumer surplus after trade?
g.
What is the amount of producer surplus before trade?
h.
What is the amount of producer surplus after trade?
i.
What is the amount of total surplus before trade?
j.
What is the amount of total surplus after trade?
k.
What is the change in total surplus because of trade?
a.
$12
b.
50
c.
$15
d.
30
e.
$250
f.
g.
$250
h.
i.
$500
j.
$545
k.
$45
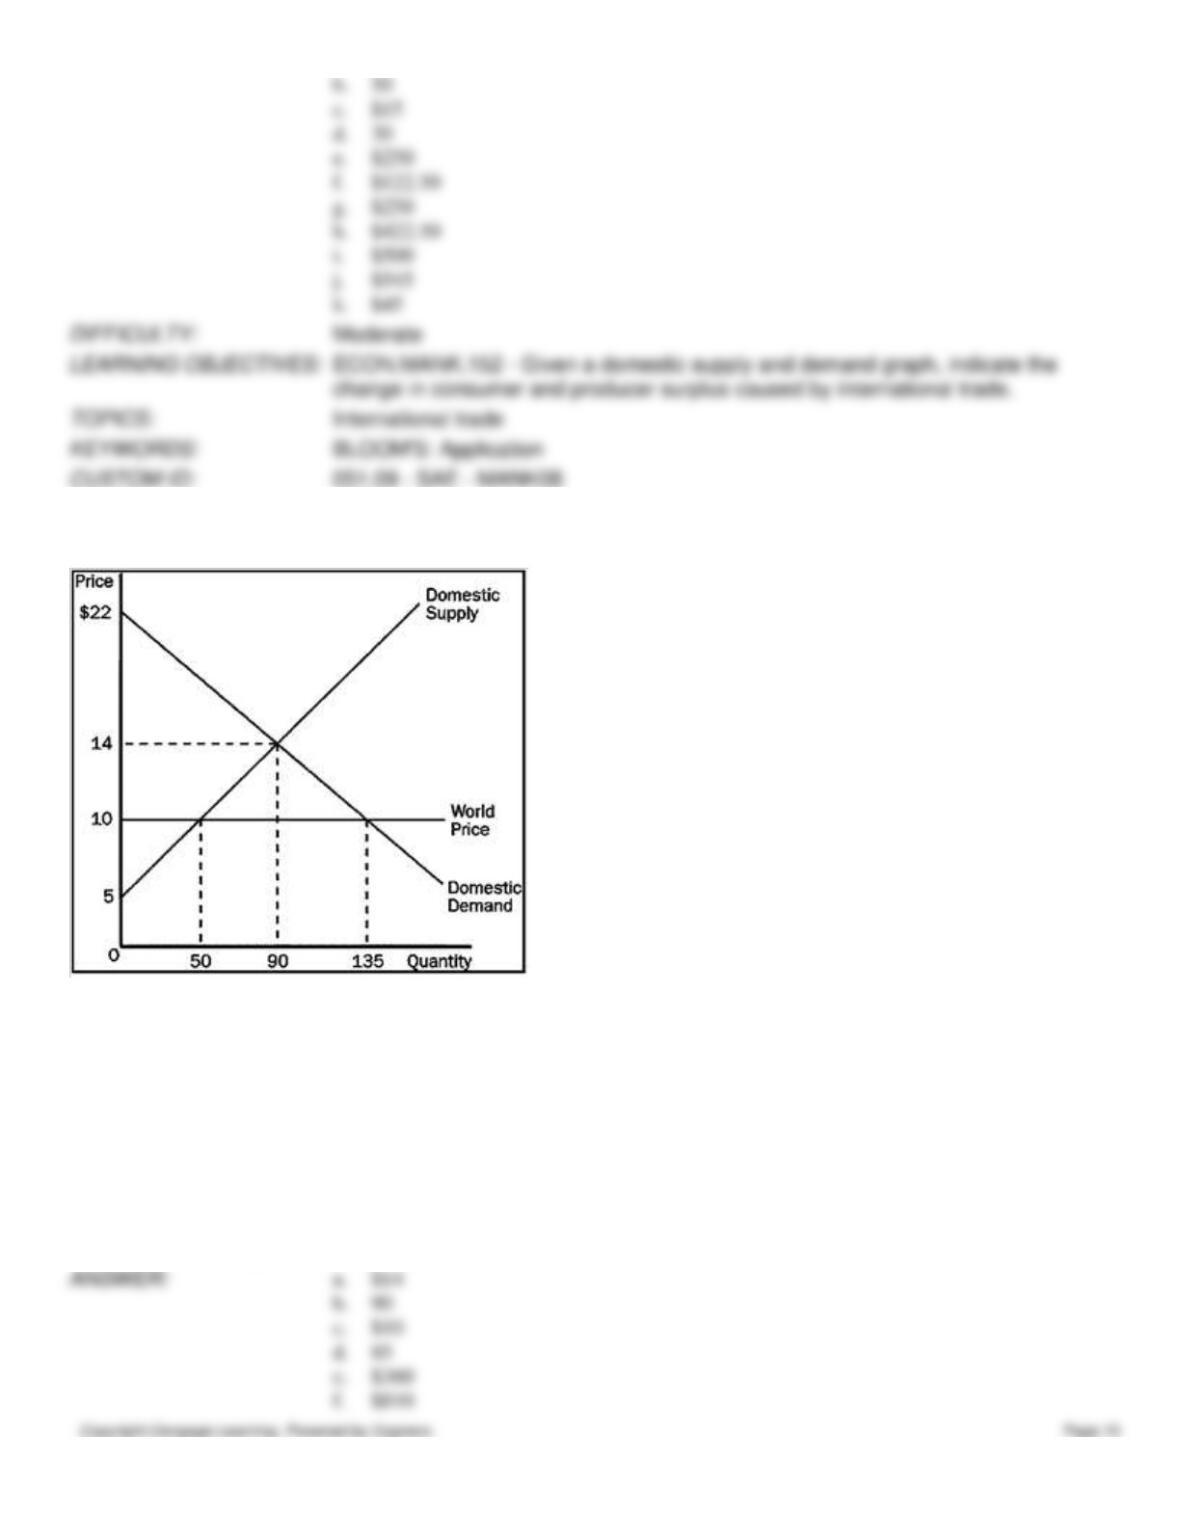
52. Using the graph below, answer the following questions about hammers.
a.
What is the equilibrium price of hammers before trade?
b.
What is the equilibrium quantity of hammers before trade?
c.
What is the price of hammers after trade is allowed?
d.
What is the quantity of hammers imported after trade is allowed?
e.
What is the amount of consumer surplus before trade?
f.
What is the amount of consumer surplus after trade?
g.
What is the amount of producer surplus before trade?
h.
What is the amount of producer surplus after trade?
i.
What is the amount of total surplus before trade?
j.
What is the amount of total surplus after trade?
k.
What is the change in total surplus because of trade?
a.
$14
b.
90
c.
$10
d.
85
e.
$360
f.
$810
g.
$405
h.
$125
i.
$765
j.
$935
k.
$170
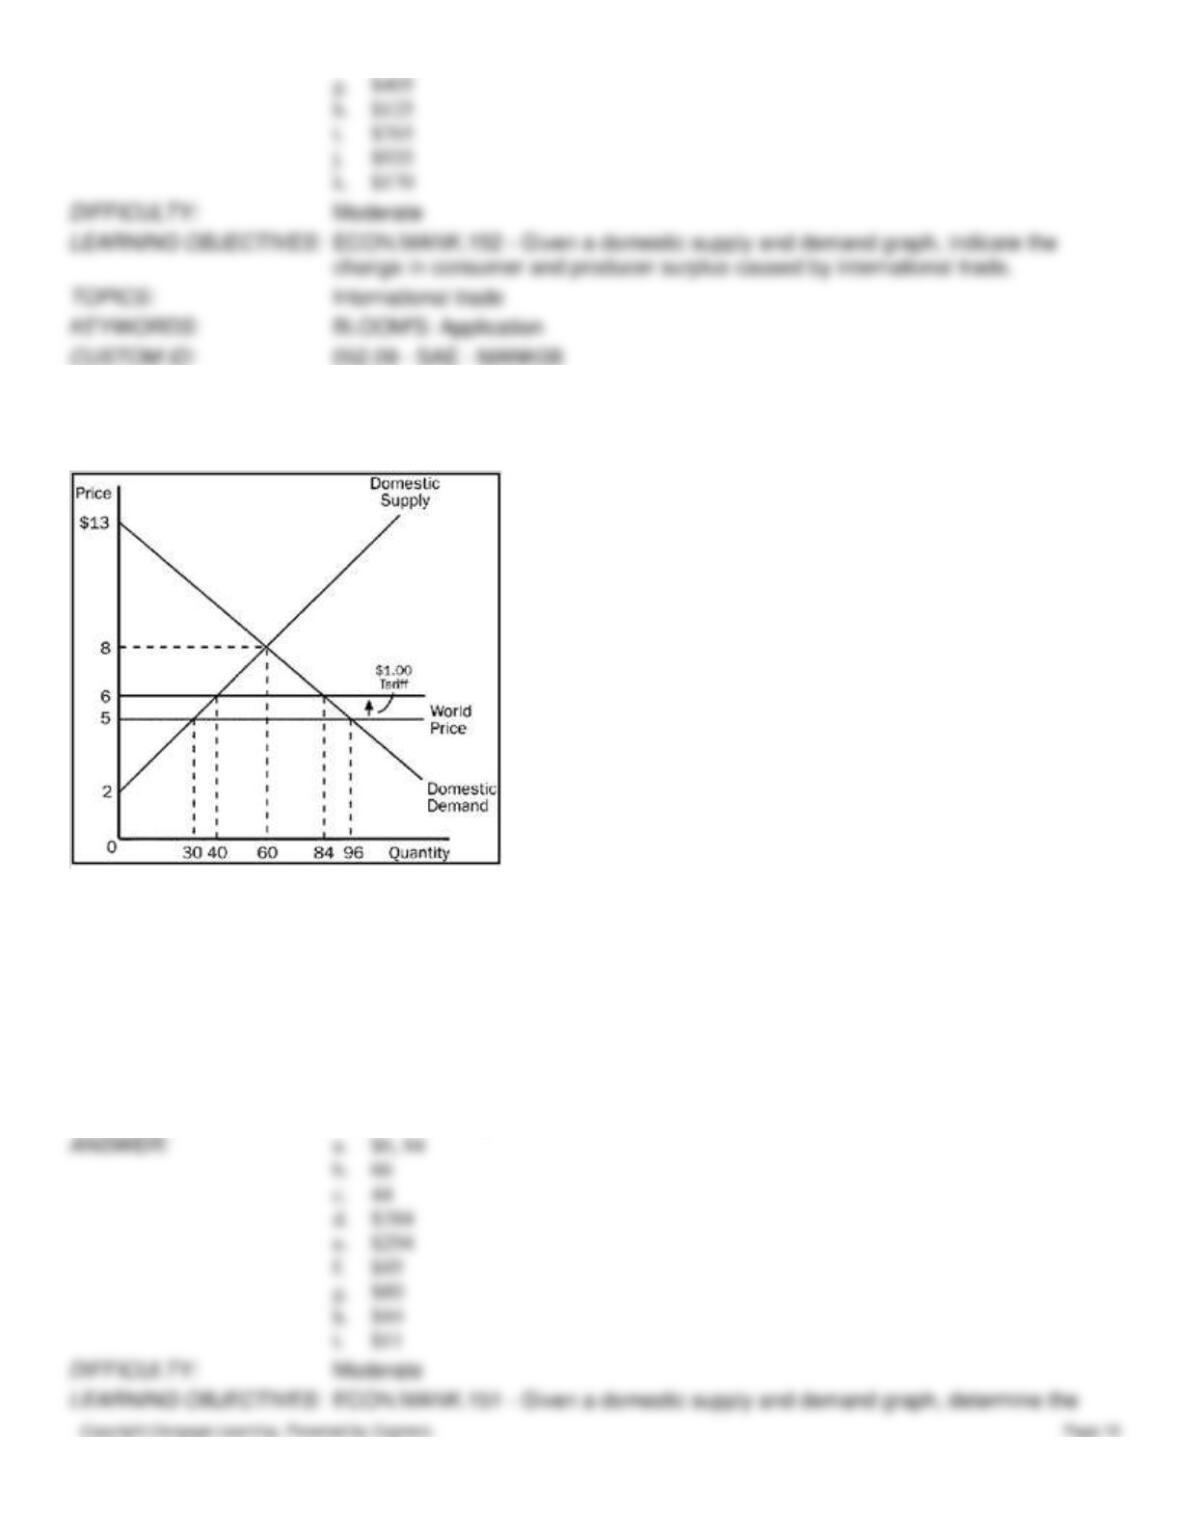
53. Using the graph, assume that the government imposes a $1 tariff on hammers. Answer the following questions given
this information.
a.
What is the domestic price and quantity demanded of hammers after the tariff is
imposed?
b.
What is the quantity of hammers imported before the tariff?
c.
What is the quantity of hammers imported after the tariff?
d.
What would be the amount of consumer surplus before the tariff?
e.
What would be the amount of consumer surplus after the tariff?
f.
What would be the amount of producer surplus before the tariff?
g.
What would be the amount of producer surplus after the tariff?
h.
What would be the amount of government revenue because of the tariff?
i.
What would be the total amount of deadweight loss due to the tariff?
a.
$6, 84
b.
66
c.
44
d.
$384
e.
$294
f.
$45
g.
$80
h.
$44
i.
$11
54. How does an import quota differ from an equivalent tariff?
55. Characterize the two different approaches a nation can take to achieve free trade. Does one approach have an
advantage over the other?
56. What are the arguments in favor of trade restrictions, and what are the counterarguments? According to most
economists, do any of these arguments really justify trade restrictions? Explain.