118. Refer to Figure 9-10. The area bounded by the points (Q0, P0), (Q2, P1), and (Q1, P1) represents
a.
Mexico’s gains from trade.
b.
the amount by which Mexico’s gain in producer surplus exceeds its loss in consumer surplus due to trade.
c.
Mexico’s loss in total surplus due to trade.
d.
All of the above are correct.
Figure 9-11
119. Refer to Figure 9-11. Consumer surplus in this market before trade is
a.
A.
b.
B + C.
c.
A + B + D.
d.
C.
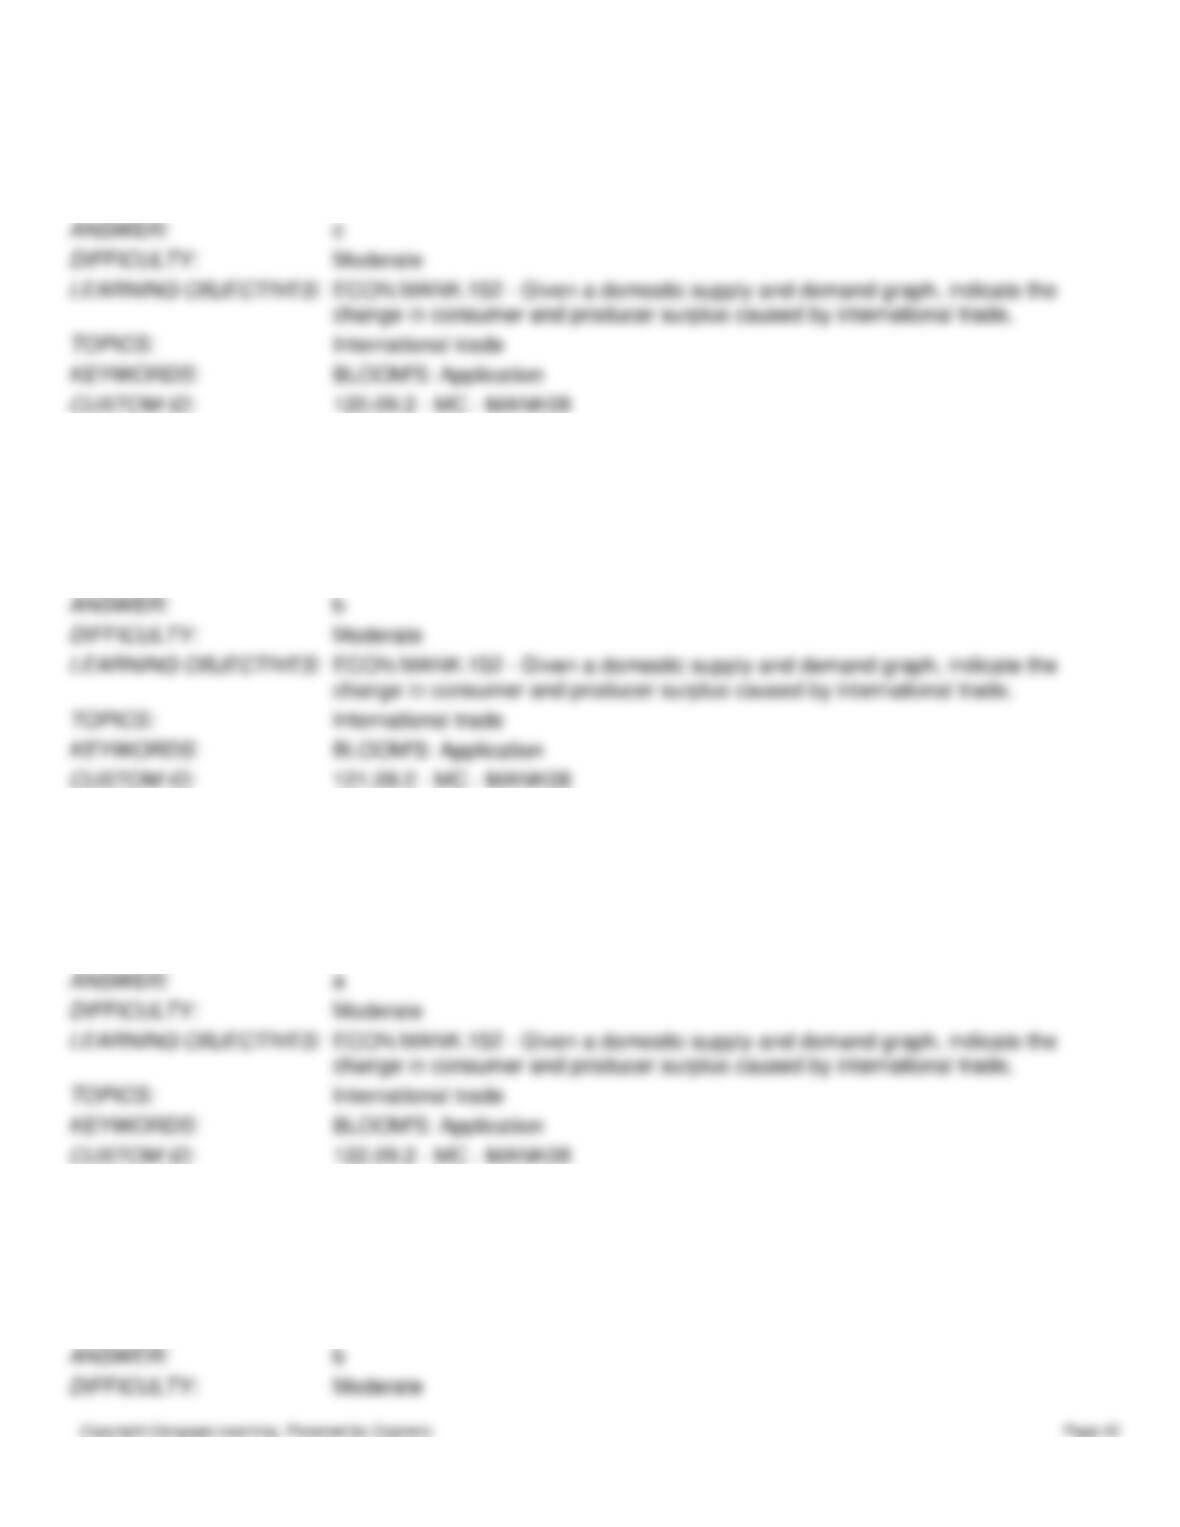
120. Refer to Figure 9-11. Consumer surplus in this market after trade is
a.
A.
b.
C + B.
c.
A + B + D.
d.
B + C + D.
121. Refer to Figure 9-11. Producer surplus in this market before trade is
a.
C.
b.
B + C.
c.
A + B + D.
d.
B + C + D.
122. Refer to Figure 9-11. Producer surplus in this market after trade is
a.
C.
b.
C + B.
c.
A + B + D.
d.
B + C + D.
123. Refer to Figure 9-11. Producer surplus plus consumer surplus in this market before trade is
a.
A + B.
b.
A + B + C.
c.
A + B + C + D.
d.
B + C + D.
124. Refer to Figure 9-11. Producer surplus plus consumer surplus in this market after trade is
a.
A + B.
b.
A + B + C.
c.
B + C + D.
d.
A + B + C + D.
125. Refer to Figure 9-11. The change in total surplus in this market because of trade is
a.
A, and this area represents a loss of total surplus.
b.
B, and this area represents a gain in total surplus.
c.
C, and this area represents a loss of total surplus.
d.
D, and this area represents a gain in total surplus.
Figure 9-12
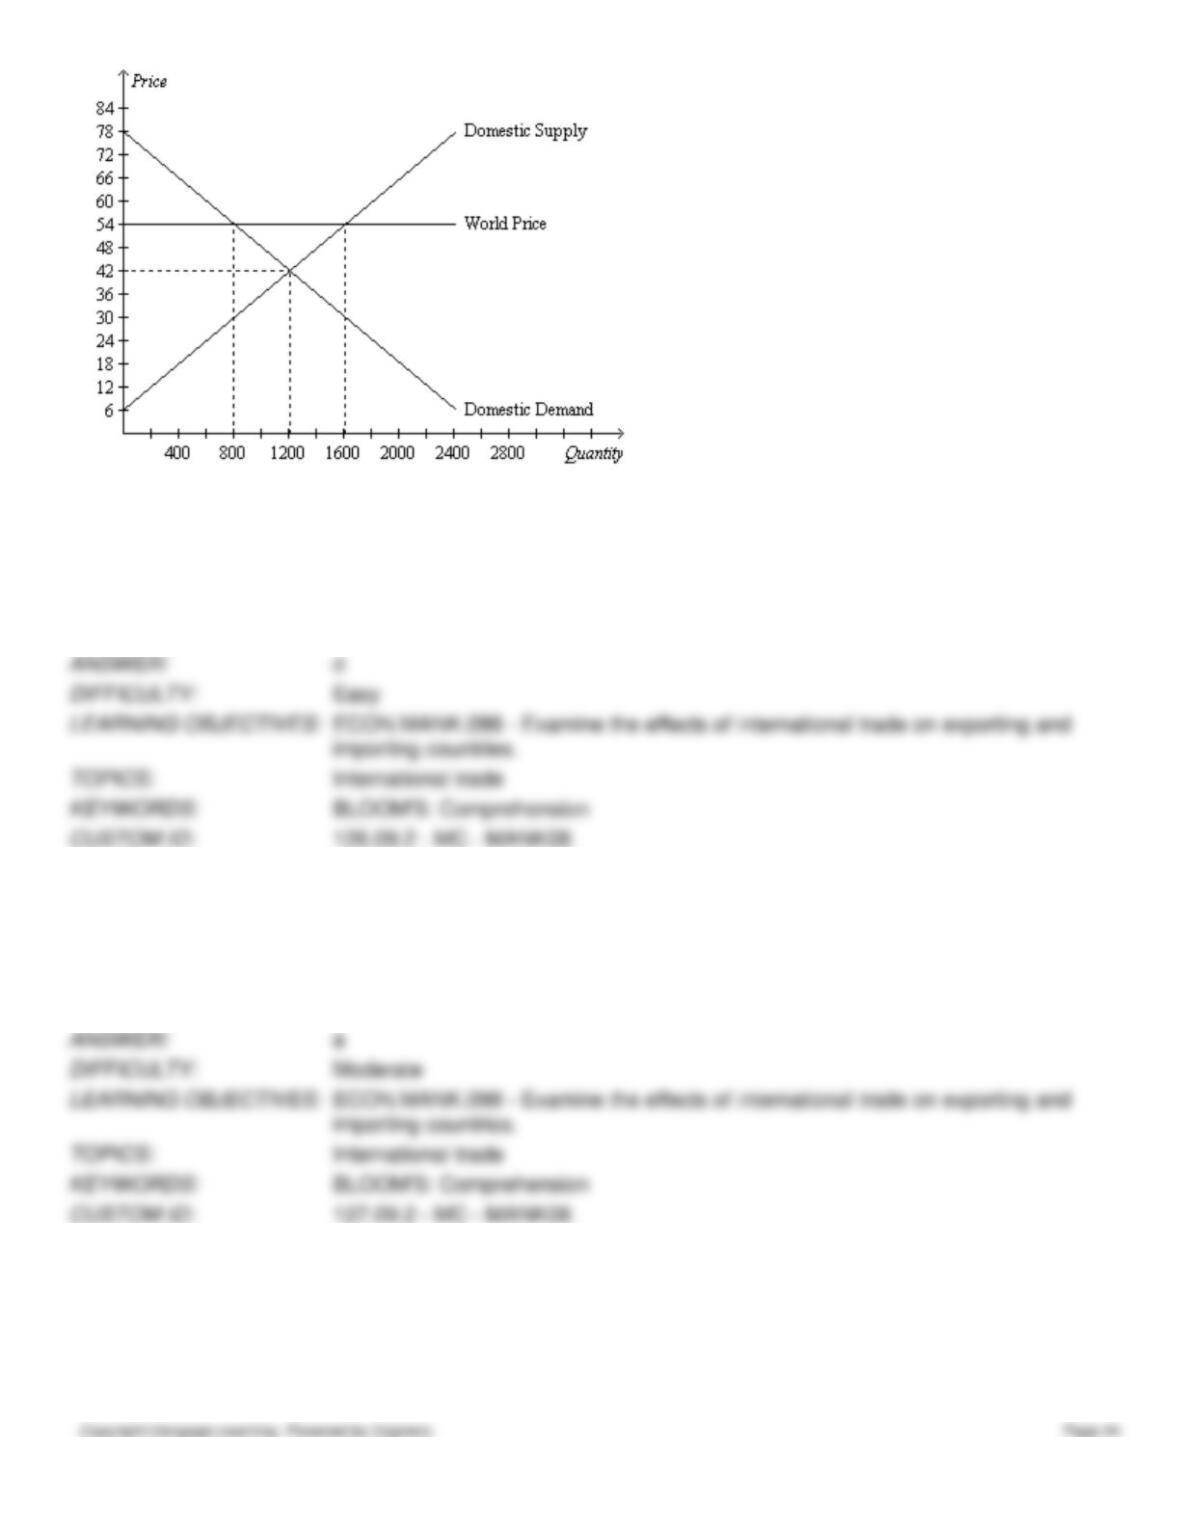
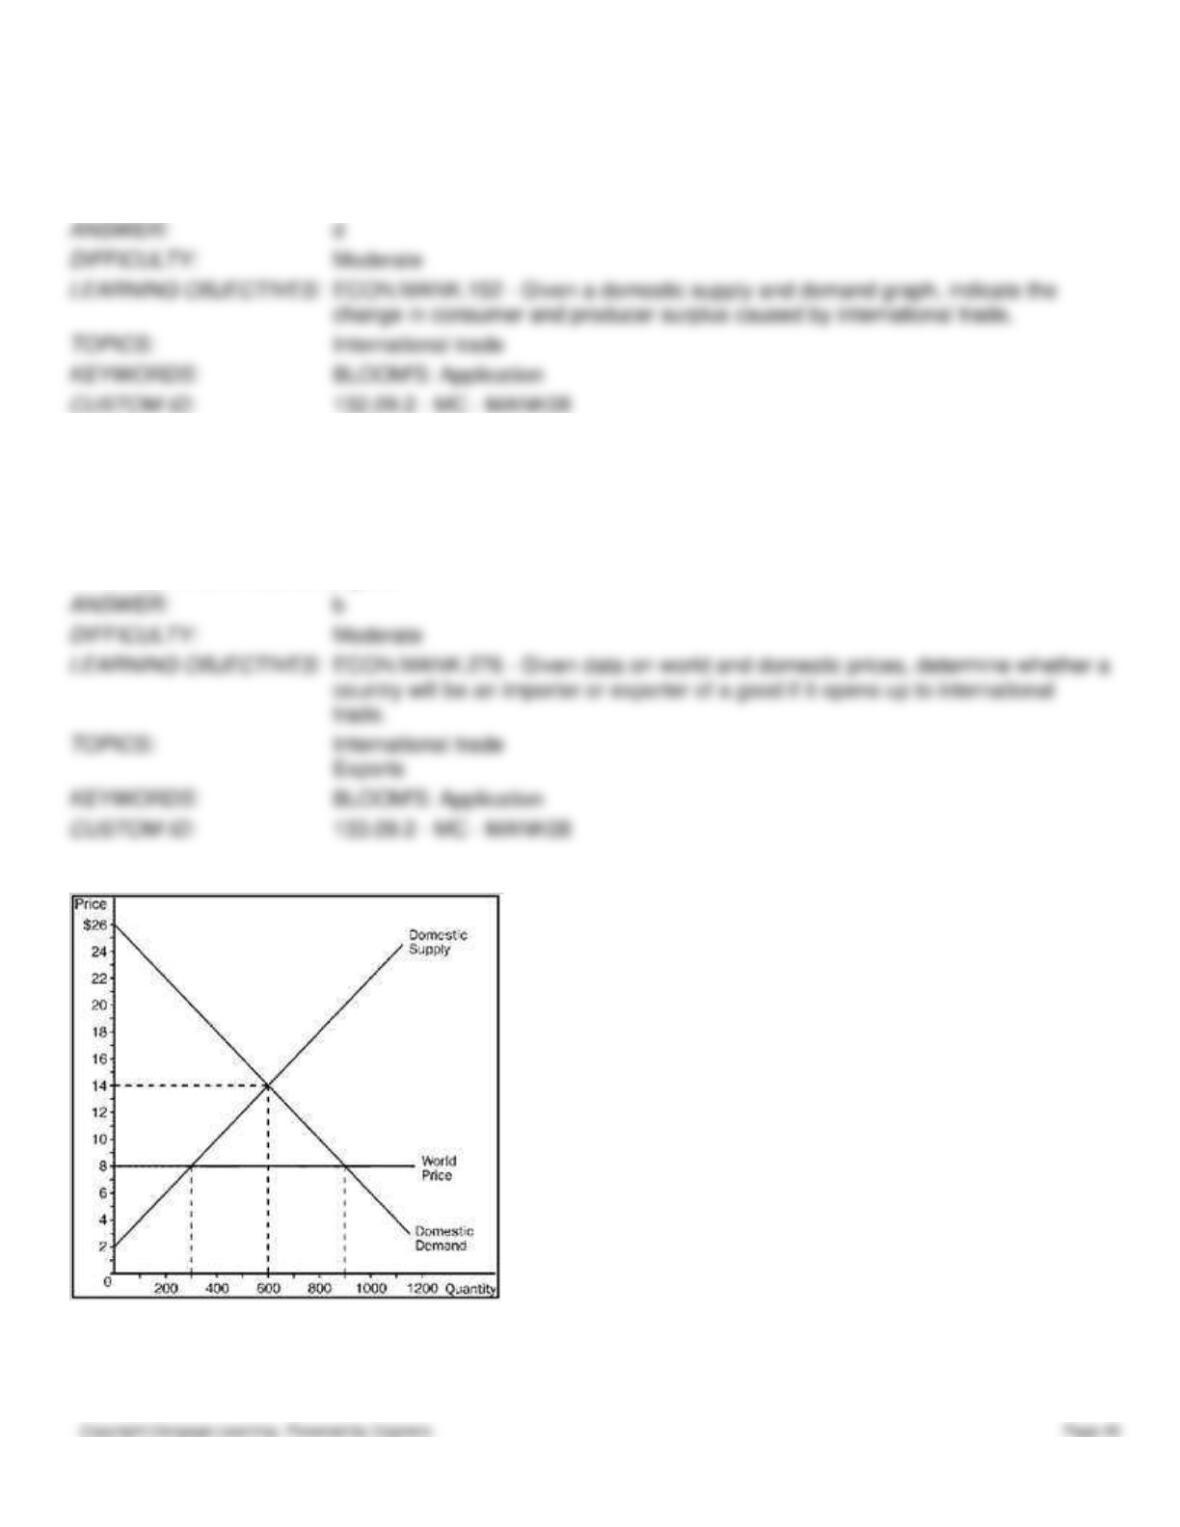
126. Refer to Figure 9-12. Equilibrium price and equilibrium quantity without trade are
a.
$54 and 800.
b.
$54 and 1,600.
c.
$42 and 800.
d.
$42 and 1,200.
127. Refer to Figure 9-12. With trade, the domestic price and domestic quantity demanded are
a.
$54 and 800.
b.
$54 and 1,600.
c.
$42 and 800.
d.
$42 and 1,200.
128. Refer to Figure 9-12. With trade, domestic production and domestic consumption, respectively, are
a.
1,200 and 800.
b.
1,600 and 800.
c.
800 and 1,200.
d.
800 and 1,600.
129. Refer to Figure 9-12. Consumer surplus before trade is
a.
$14,400.
b.
$16,800.
c.
$21,600.
d.
$24,800.
130. Refer to Figure 9-12. Consumer surplus after trade is
a.
$6,400.
b.
$9,600.
c.
$12,800.
d.
$14,400.
131. Refer to Figure 9-12. Producer surplus before trade is
a.
$14,400.
b.
$16,800.
c.
$21,600.
d.
$24,800.
132. Refer to Figure 9-12. Producer surplus after trade is
a.
$28,000.
b.
$30,000.
c.
$35,200.
d.
$38,400.
133. Refer to Figure 9-12. With trade allowed, this country
a.
exports 400 units of the good.
b.
exports 800 units of the good.
c.
imports 400 units of the good.
d.
exports 1,600 units of the good.
Figure 9-13
134. Refer to Figure 9-13. The price and domestic quantity demanded after trade are
a.
$8 and 300.
b.
$8 and 900.
c.
$14 and 900.
d.
$14 and 600.
135. Refer to Figure 9-13. With trade, domestic production and domestic consumption, respectively, are
a.
600 and 600.
b.
600 and 300.
c.
300 and 900.
d.
600 and 900.
136. Refer to Figure 9-13. Consumer surplus before trade is
a.
$1,600.
b.
$2,400.
c.
$3,200.
d.
$3,600.
137. Refer to Figure 9-13. Consumer surplus after trade is
a.
$3,600.
b.
$5,400.
c.
$7,200.
d.
$8,100.
138. Refer to Figure 9-13. Producer surplus before trade is
a.
$3,600.
b.
$4,400.
c.
$5,200.
d.
$6,600.
139. Refer to Figure 9-13. With trade, producer surplus is
a.
$900.
b.
$1,100.
c.
$1,500.
d.
$2,000.
140. Refer to Figure 9-13. With trade, the country
a.
exports 200 units of the good.
b.
exports 400 units of the good.
c.
imports 400 units of the good.
d.
imports 600 units of the good.
Figure 9-14. On the diagram below, Q represents the quantity of crude oil and P represents the price of crude oil.
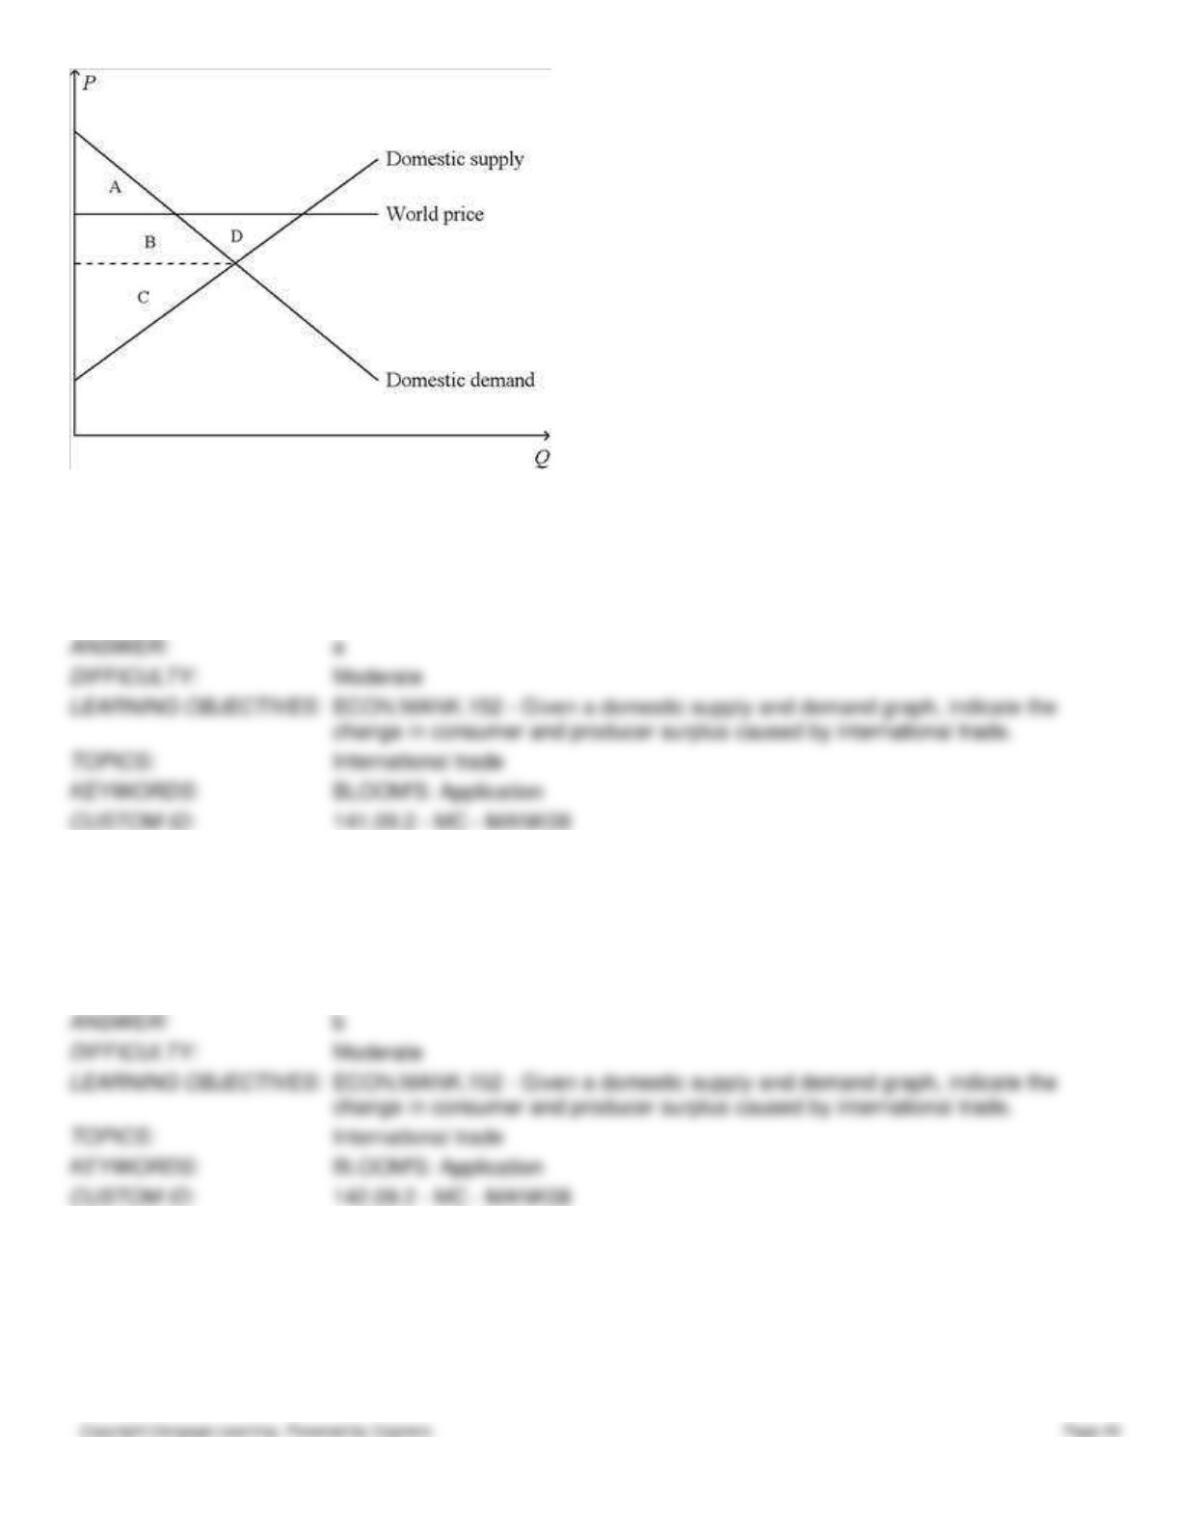
141. Refer to Figure 9-14. When the country for which the figure is drawn allows international trade in crude oil,
a.
consumer surplus for domestic crude-oil consumers decreases.
b.
the demand for crude oil by domestic crude-oil consumers decreases.
c.
the losses of the domestic losers outweigh the gains of the domestic winners.
d.
domestic crude-oil producers sell less crude oil.
142. Refer to Figure 9-14. When the country for which the figure is drawn allows international trade in crude oil,
a.
consumer surplus changes from the area A + B + D to the area A.
b.
producer surplus changes from the area C to the area B + C + D.
c.
total surplus decreases by the area D.
d.
All of the above are correct.
143. Refer to Figure 9-14. The country for which the figure is drawn
a.
has a comparative advantage relative to other countries in the production of crude oil and it will export crude
oil.
b.
has a comparative advantage relative to other countries in the production of crude oil and it will import crude
oil.
c.
has a comparative disadvantage relative to other countries in the production of crude oil and it will export
crude oil.
d.
has a comparative disadvantage relative to other countries in the production of crude oil and it will import
crude oil.
144. Refer to Figure 9-14. A result of this country allowing international trade in crude oil is as follows:
a.
The well-being of domestic crude-oil producers is now higher in that they now sell more crude oil at a higher
price per barrel.
b.
The effect on the well-being of domestic crude-oil consumers is unclear in that they now buy more crude oil,
but at a higher price per barrel.
c.
The effect on the well-being of the country is unclear in that domestic producer surplus increases, while the
effect on domestic consumer surplus is unclear.
d.
All of the above are correct.
145. A tariff on a product makes
a.
domestic sellers better off and domestic buyers worse off.
b.
domestic sellers worse off and domestic buyers worse off.
c.
domestic sellers better off and domestic buyers better off.
d.
domestic sellers worse off and domestic buyers better off.
146. A tariff on a product
a.
is a direct quantitative restriction on the amount of a good that can be imported.
b.
increases the domestic quantity supplied.
c.
increases domestic consumer surplus.
d.
All of the above are correct.
147. A tariff on a product
a.
enhances the economic well-being of the domestic economy.
b.
increases the domestic quantity supplied.
c.
increases the domestic quantity demanded.
d.
results in an increase in producer surplus that is greater than the resulting decrease in consumer surplus.
148. If the United States imports televisions and the U.S. government imposes a tariff on televisions, then
a.
total surplus in the American television market decreases.
b.
producer surplus in the American television market increases.
c.
U.S. imports of foreign televisions decrease.
d.
All of the above are correct.
149. When a country that imports a particular good imposes a tariff on that good,
a.
consumer surplus increases and total surplus increases in the market for that good.
b.
consumer surplus increases and total surplus decreases in the market for that good.
c.
consumer surplus decreases and total surplus increases in the market for that good.
d.
consumer surplus decreases and total surplus decreases in the market for that good.
150. When a country that imports a particular good imposes a tariff on that good,
a.
producer surplus increases and total surplus increases in the market for that good.
b.
producer surplus increases and total surplus decreases in the market for that good.
c.
producer surplus decreases and total surplus increases in the market for that good.
d.
producer surplus decreases and total surplus decreases in the market for that good.
151. When a country that imports a particular good imposes an import quota on that good,
a.
consumer surplus increases and total surplus increases in the market for that good.
b.
consumer surplus increases and total surplus decreases in the market for that good.
c.
consumer surplus decreases and total surplus increases in the market for that good.
d.
consumer surplus decreases and total surplus decreases in the market for that good.
152. When a country that imports a particular good imposes an import quota on that good,
a.
producer surplus increases and total surplus increases in the market for that good.
b.
producer surplus increases and total surplus decreases in the market for that good.
c.
producer surplus decreases and total surplus increases in the market for that good.
d.
producer surplus decreases and total surplus decreases in the market for that good.
153. A tariff is a tax placed on
a.
an exported good and it lowers the domestic price of the good below the world price.
b.
an exported good and it ensures that the domestic price of the good stays the same as the world price.
c.
an imported good and it lowers the domestic price of the good below the world price.
d.
an imported good and it raises the domestic price of the good above the world price.
154. A tariff
a.
lowers the domestic price of the exported good below the world price.
b.
keeps the domestic price of the exported good the same as the world price.
c.
raises the domestic price of the imported good above the world price.
d.
lowers the domestic price of the imported good below the world price.
155. When a country moves away from a free trade position and imposes a tariff on imports, it causes
a.
a decrease in total surplus in the market.
b.
a decrease in producer surplus in the market.
c.
an increase in consumer surplus in the market.
d.
a decrease in revenue to the government.
156. If the demand curve and the supply curve for a good are straight lines, then the deadweight loss that results from a
tariff is represented on the supply-and-demand graph by
a.
the area of one triangle.
b.
the area of one rectangle.
c.
the combined areas of two different triangles.
d.
the combined areas of two different rectangles.
157. Suppose Iran imposes a tariff on lumber. For the tariff to have any effect, it must be the case that
a.
Iran is an exporter of lumber.
b.
the domestic quantity of lumber supplied exceeds the domestic quantity of lumber demanded at the world
price without the tariff.
c.
the world price without the tariff is less than the price of lumber without trade.
d.
the world price without the tariff is greater than the price of lumber without trade.
158. Spain is an importer of computer chips, taking the world price of $12 per chip as given. Suppose Spain imposes a $5
tariff on chips. As a result,
a.
Spanish consumers of chips and Spanish producers of chips both gain.
b.
Spanish consumers of chips gain and Spanish producers of chips lose.
c.
Spanish consumers of chips lose and Spanish producers of chips gain.
d.
Spanish consumers of chips and Spanish producers of chips both lose.
159. Denmark is an importer of computer chips, taking the world price of $12 per chip as given. Suppose Denmark
imposes a $5 tariff on chips. Which of the following outcomes is possible?
a.
More Danish-produced chips are sold in Denmark.
b.
More foreign-produced chips are sold in Denmark.
c.
Danish consumers of chips become better off.
d.
Total surplus in the Danish chip market increases.
160. Chile is an importer of computer chips, taking the world price of $12 per chip as given. Suppose Chile imposes a $7
tariff on chips. Which of the following outcomes is possible?
a.
The price of chips in Chile increases to $19; the quantity of Chilean-produced chips decreases; and the
quantity of chips imported by Chile decreases.
b.
The price of chips in Chile increases to $16; the quantity of Chilean-produced chips increases; and the quantity
of chips imported by Chile decreases.
c.
The price of chips in Chile increases to $19; the quantity of Chilean-produced chips increases; and the quantity
of chips imported by Chile decreases.
d.
The price of chips in Chile increases to $16; the quantity of Chilean-produced chips increases; and the quantity
of chips imported by Chile does not change.
161. Honduras is an importer of goose-down pillows. The world price of these pillows is $50. Honduras imposes a $7
tariff on pillows. Honduras is a price-taker in the pillow market. As a result of the tariff, the price of goose-down pillows
in Honduras
a.
remains at $50 and the quantity of goose-down pillows purchased in Honduras decreases.
b.
increases to $57 and the quantity of goose-down pillows purchased in Honduras decreases.
c.
increases to a new price between $50 and $57 and the quantity of goose-down pillows purchased in Honduras
decreases.
d.
increases to a new price above $57 and the quantity of goose-down pillows purchased in Honduras remains the
same.
162. Turkey is an importer of wheat. The world price of a bushel of wheat is $7. Turkey imposes a $3-per-bushel tariff on
wheat. Turkey is a price-taker in the wheat market. As a result of the tariff,
a.
Turkish consumers of wheat become worse off and Turkish producers of wheat become worse off.
b.
Turkish consumers of wheat become worse off and Turkish producers of wheat become better off.
c.
Turkish consumers of wheat become better off and Turkish producers of wheat become worse off.
d.
Turkish consumers of wheat become better off and Turkish producers of wheat become better off.
163. When the nation of Brownland first permitted trade with other nations, domestic producers of wheat experienced an
increase in producer surplus of $4 million and total surplus in Brownland’s wheat market increased by $1 million. We can
conclude that
a.
Brownland became an exporter of wheat.
b.
consumer surplus in Brownland increased by $3 million.
c.
the opening of trade caused the domestic supply curve for wheat in Brownland to shift to the left.
d.
this example is inconsistent with the economic theory of international trade.
164. When the nation of Mooseland first permitted trade with other nations, domestic producers of sugar experienced a
decrease in producer surplus of $5 million and total surplus in Mooseland’s sugar market increased by $2 million. We can
conclude that
a.
Mooseland became an exporter of sugar.
b.
the overall economic well-being of participants in the sugar market in Mooseland fell because of trade.
c.
consumer surplus in Mooseland increased by $7 million.
d.
the opening of trade caused the domestic demand curve for sugar in Mooseland to shift to the right.
Figure 9-15
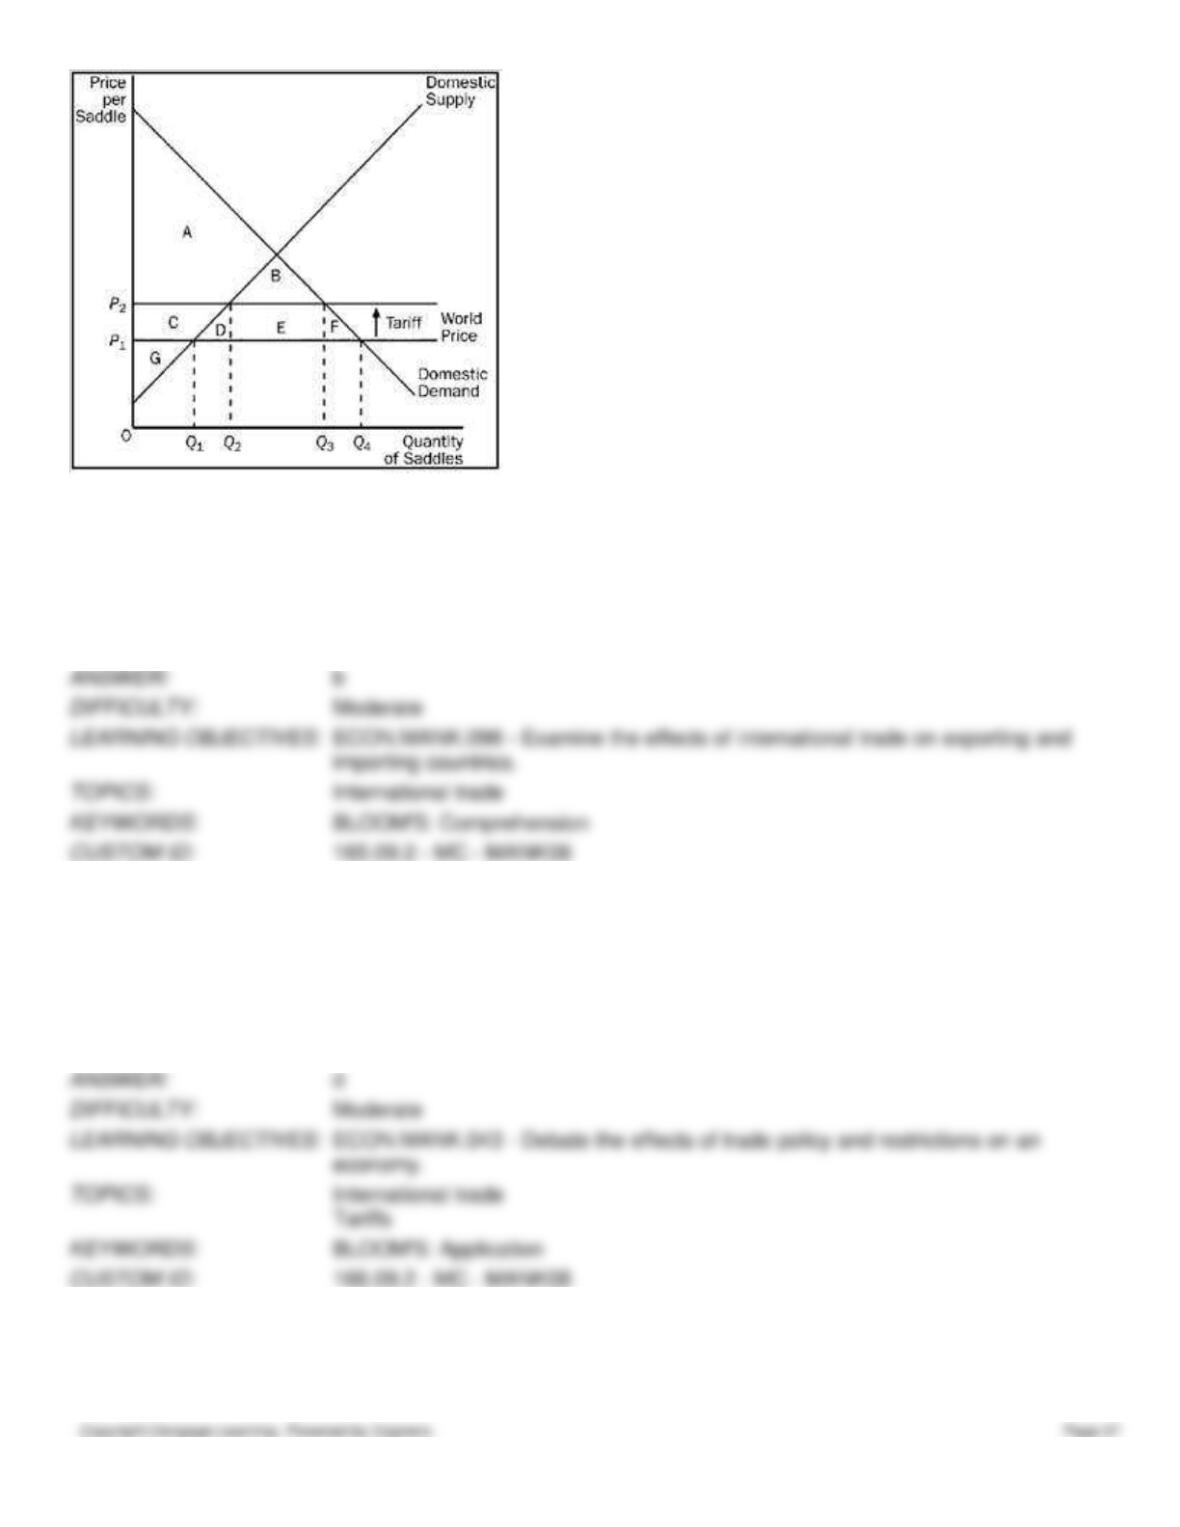
165. Refer to Figure 9-15. With trade and without a tariff, the price and domestic quantity demanded are
a.
P1 and Q1.
b.
P1 and Q4.
c.
P2 and Q2.
d.
P2 and Q3.
166. Refer to Figure 9-15. With the tariff, the price paid and quantity demanded by domestic buyers are
a.
P1 and Q1.
b.
P1 and Q4.
c.
P2 and Q2.
d.
P2 and Q3.
167. Refer to Figure 9-15. With the tariff, the quantity of saddles imported is
a.
Q3 – Q1.
b.
Q3 – Q2.
c.
Q4 – Q1.
d.
Q4 – Q2.
168. Refer to Figure 9-15. A result of the tariff is that, relative to the free-trade situation, the quantity of saddles imported
decreases by
a.
Q2 – Q1.
b.
Q3 – Q2.
c.
Q4 – Q3.
d.
Q4 – Q3 + Q2 – Q1.
169. Refer to Figure 9-15. Consumer surplus with trade and without a tariff is
a.
A.
b.
A + B.
c.
A + C + G.
d.
A + B + C + D + E + F.
170. Refer to Figure 9-15. Producer surplus with trade and without a tariff is
a.
G.
b.
C + G.
c.
A + C + G.
d.
A + B + C + G.
171. Refer to Figure 9-15. Consumer surplus with the tariff is
a.
A.
b.
A + B.
c.
A + C + G.
d.
A + B + C + D +E + F.
172. Refer to Figure 9-15. Producer surplus with the tariff is
a.
G.
b.
C + G.
c.
A + C + G.
d.
A + B + C + G.
173. Refer to Figure 9-15. The amount of government revenue created by the tariff is
a.
B.
b.
E.
c.
D + F.
d.
B + D + E + F.
174. Refer to Figure 9-15. As a result of the tariff, there is a deadweight loss that amounts to
a.
B.
b.
E.
c.
D + F.
d.
B + D + E + F.
175. Refer to Figure 9-15. For the saddle market, area B represents
a.
government’s revenue from the tariff.
b.
the deadweight loss of the tariff.
c.
the increase in producer surplus, relative to the free-trade situation, as a result of the tariff.
d.
None of the above is correct.
176. Refer to Figure 9-15. For the saddle market, area E represents
a.
government’s revenue from the tariff.
b.
producer surplus after the tariff becomes effective.
c.
the decrease in consumer surplus, relative to the free-trade situation, as a result of the tariff.
d.
the decrease in total surplus, relative to the free-trade situation, as a result of the tariff.
Figure 9-16. The figure below illustrates a tariff. On the graph, Q represents quantity and P represents price.