48) The inflation rate measures the average prices of goods and services in the economy.
49) Housing is the largest component of the U.S. CPI market basket.
50) The GDP deflator is the best measure that reflects the prices of goods and services purchased by the
typical household.
51) The inflation rate measures the percentage increase in the price level from one year to the next.
52) If the CPI falls from 142 to 140 between two consecutive years, this implies that prices fell by 2%
between those two years.
53) The producer price index tracks the prices firms receive for goods and services at all stages of
production.
54) Why does the substitution bias cause the consumer price index to overstate inflation and the cost of
living? Why does the increase in quality bias cause the consumer price index to overstate inflation and
the cost of living?
55) List three different price indices and explain how they differ in terms of the market basket on which
they are based.
56) Explain how the CPI is constructed.
Table 9-12
Product
Quantity
Base Year
Price (2001)
Price (2015)
Price (2016)
Burritos
10
$1.00
$1.50
$1.75
Flashlights
15
5.00
7.00
6.75
Golf balls
8
2.00
3.00
3.50
57) Refer to Table 9-12. Consider a simple economy that produces only three products: burritos,
flashlights, and golf balls. Use the information in the table to calculate the inflation rate for 2016, as
measured by the consumer price index.
Table 9-13
Product
Quantity
Base Year
Price (2001)
Price (2015)
Price (2016)
Tacos
5
$1.50
$2.00
$2.25
Earplugs
10
6.00
7.50
7.00
Toothbrushes
3
2.50
3.50
3.50
58) Refer to Table 9-13. Consider a simple economy that produces only three products: tacos, earplugs,
and toothbrushes. Use the information in the table to calculate the inflation rate for 2016, as measured
by the consumer price index.
9.5 Using Price Indexes to Adjust for the Effects of Inflation
1) The real wage equals the nominal wage ________ the CPI, all times 100.
A) divided by
B) times
C) minus
D) plus
2) If your nominal wage rises faster than the price level, we can say your real wage has ________ and the
purchasing power of your income has ________.
A) fallen; fallen
B) fallen; risen
C) risen; risen
D) risen; fallen
3) You earned $30,000 in 2007, and your salary rose to $80,000 in 2016. If the CPI rose from 82 to 202
between 2007 and 2016, which of the following is true?
A) There was deflation between 2007 and 2016.
B) The purchasing power of your salary fell between 2007 and 2016.
C) The purchasing power of your salary remained constant between 2007 and 2016.
D) The purchasing power of your salary increased between 2007 and 2016.
Table 9-14
Year
Nominal Average
Hourly Earnings
CPI (1982-1984 = 100)
1965
$2.65
32
2010
22.59
219
The table above reports the nominal average hourly earnings in private industry and the consumer
price index for 1965 and 2010.
4) Refer to Table 9-14. The real average hourly earnings for 1965 in 1982-1984 dollars equal
A) $1.28.
B) $6.49.
C) $8.28.
D) $15.45.
5) Refer to Table 9-14. The percentage change in real average earnings from 1965 to 2010 equals
A) 2.0 percent.
B) 19.7 percent.
C) 24.6 percent.
D) 80.3 percent.
6) Refer to Table 9-14. The real average hourly earnings for 1965 in 2010 dollars equal
A) $3.87.
B) $5.80.
C) $12.10.
D) $18.14.
Table 9-15
Year
Nominal Average
Hourly Earnings
CPI
2014
$10
100
2015
10
105
2016
12
110
7) Refer to Table 9-15. Looking at the table above, real average hourly earnings in 2014 were
A) $9.
B) $9.52.
C) $10.
D) $12.63.
8) Refer to Table 9-15. Looking at the table above, real average hourly earnings were equal to ________
in 2015.
A) $9
B) $9.52
C) $10
D) $12
9) Suppose your grandfather earned a salary of $12,000 in 1964. If the CPI is 31 in 1964 and 219 in 2016,
then the value of your grandfather’s salary in 2016 dollars is approximately
A) $84,775.
B) $63,830.
C) $37,200.
D) $26,280.
10) The CPI in 1990 was 131, and the CPI in 2010 was 218. If you earned a salary of $40,000 in 1990, what
would be a salary with equivalent purchasing power in 2010?
A) $45,977
B) $66,565
C) $87,200
D) $143,486
11) If your nominal wage rises more slowly than the price level, we can say your real wage has ________
and the purchasing power of a dollar has ________.
A) fallen; fallen
B) fallen; risen
C) risen; risen
D) risen; fallen
Table 9-16
Year
Nominal Average
Hourly Earnings
CPI
(1982-1984 =100)
2014
$10
100
2015
10
105
2016
12
110
12) Refer to Table 9-16. Looking at the table above, real wages ________ from 2014 to 2015, and real
wages ________ from 2015 to 2016.
A) rose; rose
B) rose; fell
C) fell; rose
D) fell; fell
Table 9-17
Year
Nominal Average
Hourly Earnings
CPI
(1982-1984 =100)
2014
$10
188.9
2015
11
195.3
2016
13
201.6
13) Refer to Table 9-17. Looking at the table above, real average hourly earnings in 2015 were
A) $3.67.
B) $5.63.
C) $10.24.
D) $11.37.
14) Refer to Table 9-17. Looking at the table above, real average hourly earnings between 2015 and 2016
changed by
A) 1.2%.
B) 4.5%.
C) 9.9%.
D) 14.5%.
15) Between 2015 and 2016, the CPI of a small nation rose from 182 to 185. If household incomes rose by
3% during that period of time, which of the following is true?
A) The purchasing power of household income rose between 2015 and 2016.
B) The purchasing power of household income fell between 2015 and 2016.
C) The purchasing power of household income remained constant between 2015 and 2016.
D) The CPI cannot be used to determine how the purchasing power of household income changes over
time.
69
Table 9-18
Year
Nominal Average Hourly
Earnings
CPI
(1982-1984 =100)
2014
$10
100
2015
10
105
2016
12
117
16) Refer to Table 9-18. Looking at the table above, what is the rate of growth of real average hourly
earnings from 2015 to 2016?
A) 7.8%
B) 6.25%
C) 4%
D) –4%
Table 9-19
Year
Nominal Average Hourly
Earnings
CPI
(1982-1984 =100)
2014
$10
100
2015
10
105
2016
12
110
17) Refer to Table 9-19. Looking at the table above, what is the approximate rate of growth of real
average hourly earnings from 2014 to 2015?
A) 15%
B) 4.4%
C) -1.5%
D) -4.8%
18) Refer to Table 9-19. Looking at the table above, what is the rate of growth of the average price level
from 2014 to 2015?
A) 1%
B) 2%
C) 3%
D) 4%
E) 5%
19) Refer to Table 9-19. Looking at the table above, what is the rate of growth of the average price level
from 2015 to 2016?
A) 1%
B) 2%
C) 3.5%
D) 4.76%
E) 5.25%
20) Nominal income is equal to real income if the CPI is less than 100.
21) Currently, the base year for the CPI is the average of prices in the years 1982 to 1984.
22) To obtain real average hourly earnings, nominal average hourly earnings are multiplied by the CPI.
71
23) The CPI in 2010 was 218, while the CPI in 1980 was 82. If you had $5,000 in 1980, its equivalent
purchasing power in 2008 would be $10,850.
Table 9-20
Year
Median Salary:
New York Yankees
CPI (1982-1984 = 100)
1989
$500,000
124
2015
3,300,000
238
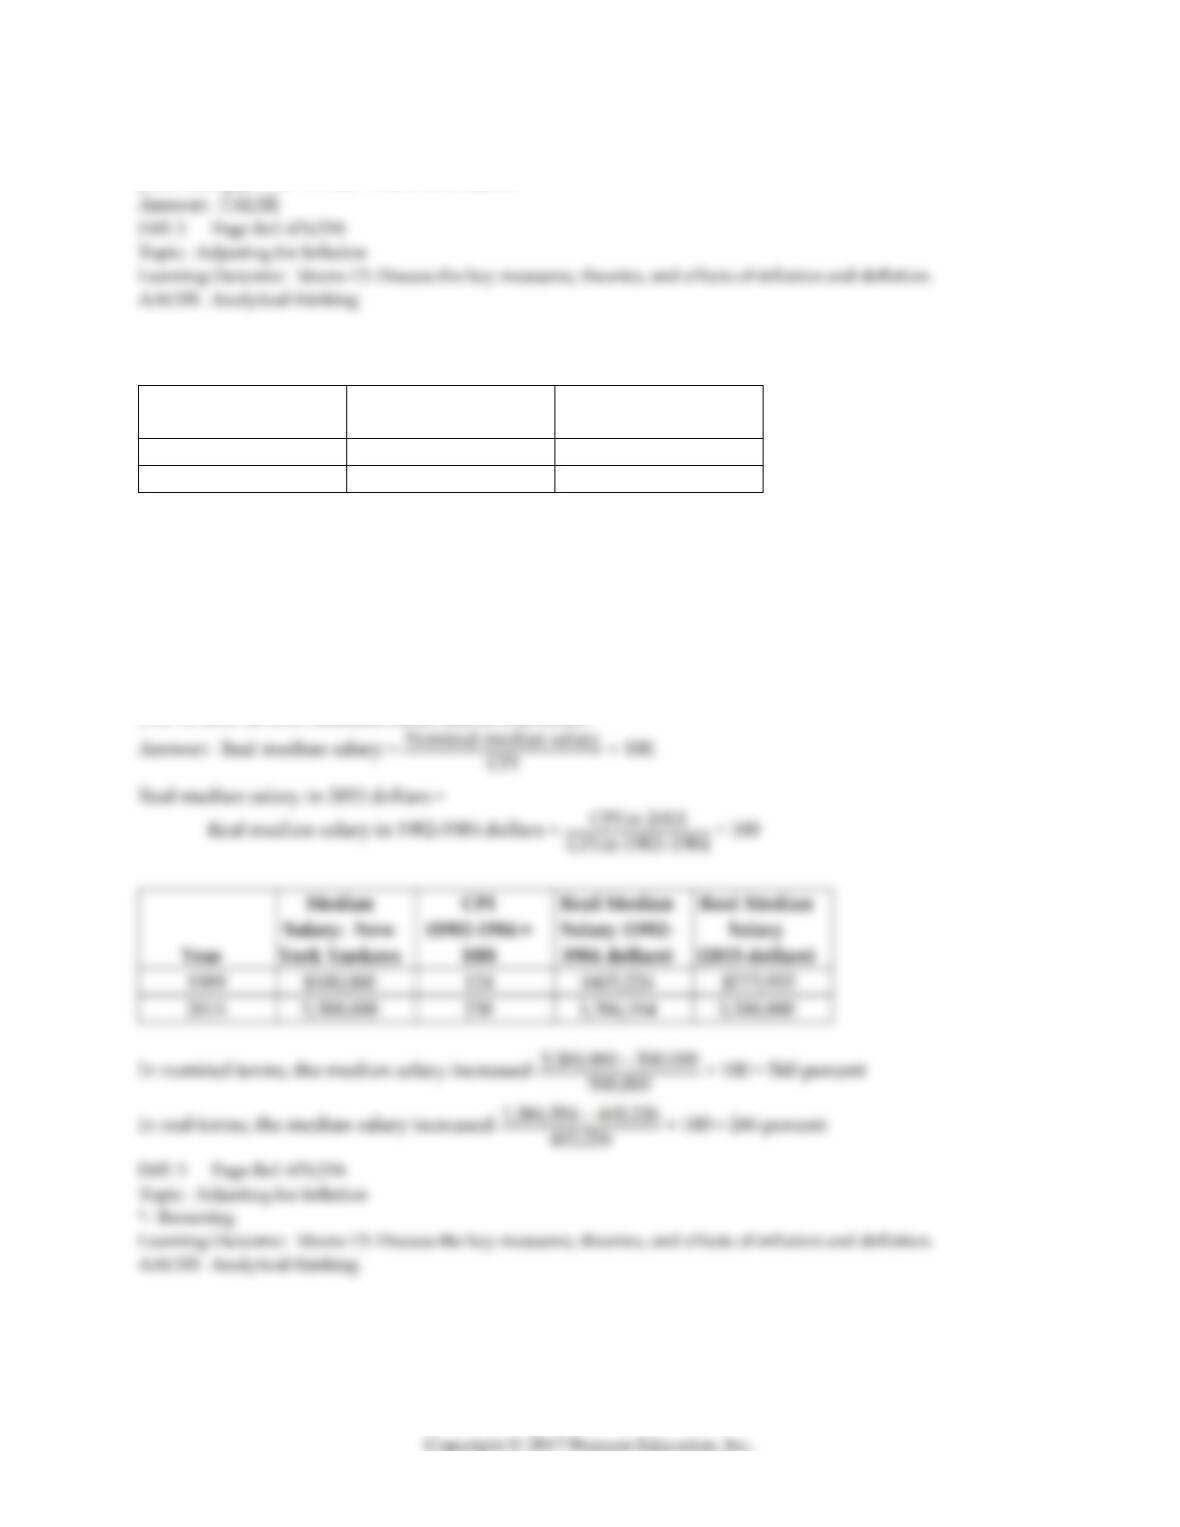
Salaries in major league baseball have soared over the last 30 to 40 years. Some of the salary increase is
due to inflation. The table above reports the consumer price index and the median nominal salary of
the New York Yankees for 1989 and 2015.
Source: USA Today Salaries Database, http://www.usatoday.com/sports/mlb/yankees/salaries/2015/team/all/
24) Refer to Table 9-20. Calculate the real median salary of the New York Yankees in both 1982-1984
dollars and 2015 dollars. Calculate the percentage increase in the median salary of the Yankees from
1989 to 2015 in both nominal terms and in real terms.
1989
2015
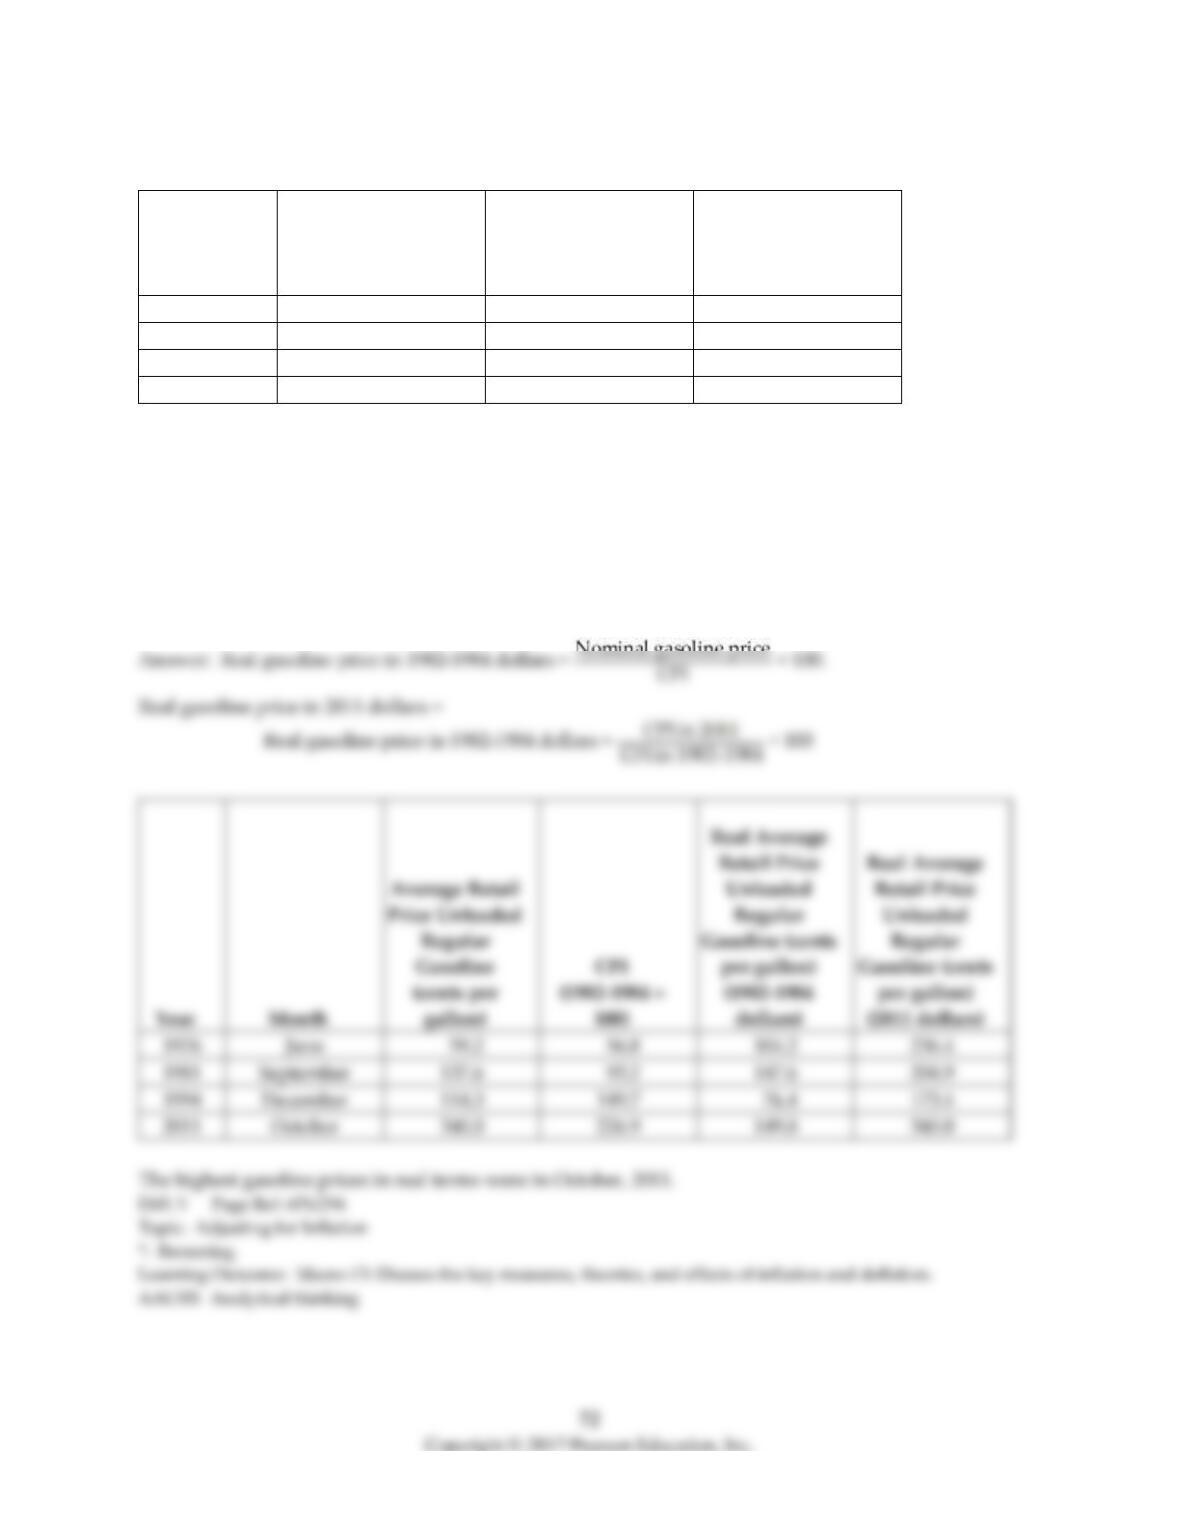
Table 9-21
Year
Month
Average Retail Price
Unleaded Regular
Gasoline
(cents per gallon)
CPI
(1982-1984 = 100)
1976
June
59.2
56.8
1981
September
137.6
93.2
1994
December
114.3
149.7
2011
October
340.0
226.9
Source: Energy Information Administration
25) Refer to Table 9-21. The table above reports the consumer price index and the average U.S. retail
price for unleaded regular gasoline for four different periods since 1976. Note that the gasoline prices
are in cents per gallon.
Calculate the real average retail price of unleaded regular gasoline in 1982-1984 dollars. In which
period were gasoline prices the highest in real terms? Also, calculate the real average retail price of
unleaded regular gasoline in 2011 dollars.
Month
236.4
334.9
149.7
173.4
226.9
340.0
73
Table 9-22
Year
Nominal Average Hourly
Earnings
CPI
(1982-1984 =100)
2014
$10
100
2015
11
105
2016
12
110
26) Refer to Table 9-22. Using the above table, calculate real average hourly earnings for 2014, 2015, and
2016. Calculate the rate of growth of real average hourly earnings from 2015 to 2016.
74
Table 9-23
Year
Nominal
Minimum
Wage
CPI
(1982-1984 =100)
1974
$2.00
49.3
2012
7.25
224.9
27) Refer to Table 9-23. The table above lists the actual minimum wage and CPI in 1974 and in 2012.
Using the above table, calculate the real minimum wage for 1974 and 2012. Calculate the rate of growth
of the real minimum wage from 1974 to 2012. Are workers better off in terms of the purchasing power
of a dollar in 1974 or 2012? Explain why.
9.6 Nominal Interest Rates versus Real Interest Rates
1) The nominal interest rate equals the real interest rate ________ the inflation rate.
A) times
B) divided by
C) plus
D) minus
2) The real interest rate equals the nominal interest rate ________ the inflation rate.
A) times
B) divided by
C) plus
D) minus
3) The stated interest rate on a loan is the
A) real interest rate.
B) nominal interest rate.
C) actual inflation rate.
D) expected inflation rate.
4) If the nominal rate of interest is 6.5% and the inflation rate is 3.0%, what is the real rate of interest?
A) -9.5%
B) -3.5%
C) 1.5%
D) 3.5%
E) 9.5%
5) Imagine that you borrow $5,000 for one year and at the end of the year you repay the $5,000 plus $600
of interest. If the inflation rate was 4%, what was the real interest rate you paid?
A) 16 percent
B) 12 percent
C) 8 percent
D) 6 percent
6) Imagine that you borrow $1,000 for one year and at the end of the year you repay the $1,000 plus $100
of interest. If the inflation rate was 7%, what was the real interest rate you paid?
A) 17 percent
B) 10 percent
C) 7 percent
D) 3 percent