19) On the graph above, the labeled point at which investment — planned plus unplanned — is
highest is point ________.
A) A
B) B
C) G
D) H
E) not inferable from the information given
20) On the graph above, assuming that G = 0 and NX = 0, the labeled point at which saving is
lowest is point ________.
A) A
B) B
C) G
D) H
E) not inferable from the information given
21) If planned expenditure is below output, as the economy approaches equilibrium, ________.
A) planned expenditure is falling
B) output is rising
C) saving is rising
D) all of the above
E) none of the above
22) If planned expenditure is below output, as the economy approaches equilibrium, ________.
A) planned expenditure is rising
B) output is rising
C) saving is rising
D) all of the above
E) none of the above
16
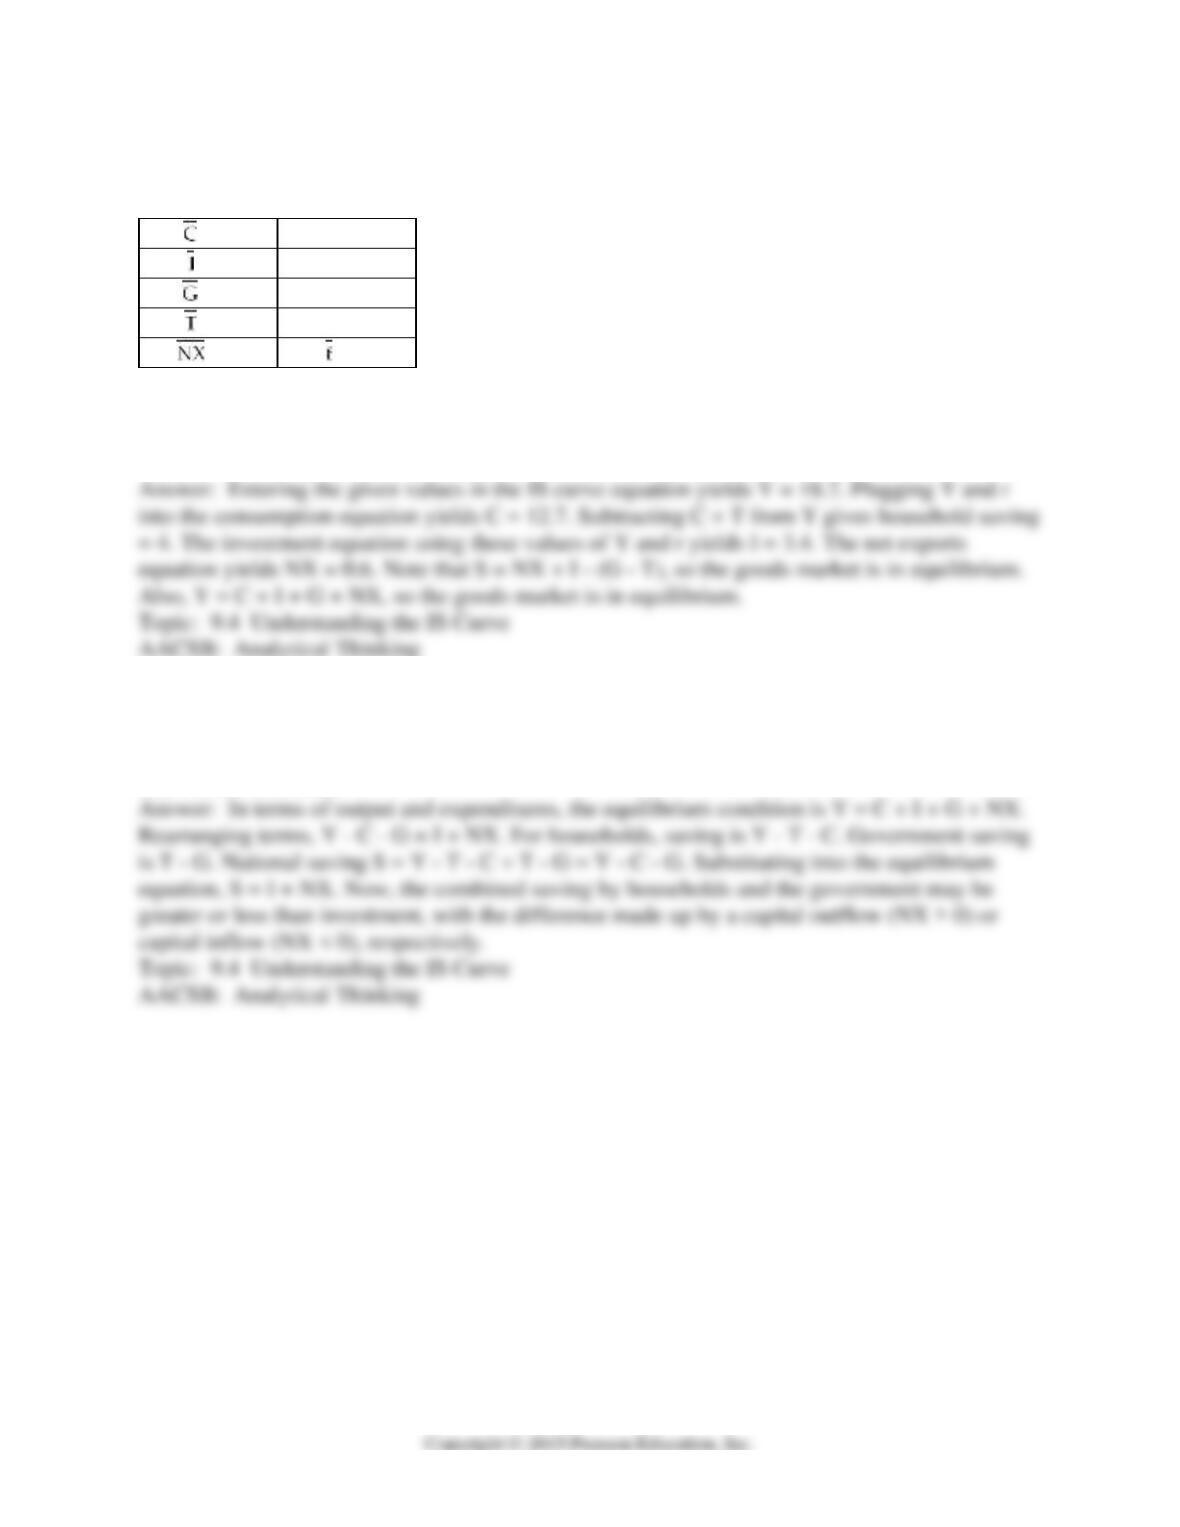
IS Curve Exogenous Variables and Parameters
Table 2
= 3
mpc = 0.6
= 5
c = 0.08
= 2
d = 0.4
= 2
x = 0.1
= 1
= 0
23) Using the values in the table above, and assuming that the real interest rate equals 4,
calculate equilibrium values for consumption, household saving, investment, and net exports.
Use these values to confirm that the goods market is in equilibrium.
24) In the text, the equivalence of the goods market equilibrium in the IS model to the
equilibrium in which desired investment equals desired saving is demonstrated, assuming that
both government purchases and net exports are zero. Demonstrate the equivalence when both G
and NX are non-zero.
9.5 Factors That Shift the IS Curve
1) The IS curve ________ when the real interest rate increases.
A) shifts to the right
B) shifts to the left
C) shifts up
D) all of the above
E) none of the above
2) The IS curve ________.
A) shifts to the right when autonomous consumption increases
B) shifts up when the real interest rate increases
C) shifts to the left when autonomous investment increases
D) all of the above
E) none of the above
3) The IS curve shifts to the left when ________.
A) autonomous consumption increases
B) taxes increase
C) autonomous investment increases
D) all of the above
E) none of the above
4) The IS curve shifts to the left when ________.
A) autonomous consumption increases
B) taxes decrease
C) autonomous investment decreases
D) all of the above
E) none of the above
5) The IS curve shifts to the right when ________.
A) autonomous consumption decreases
B) taxes increase
C) autonomous investment increases
D) all of the above
E) none of the above
6) If the government increases military spending ________.
A) the IS curve would shift to the left
B) output will decrease if interest rates remain fixed
C) the unemployment rate could fall
D) all of the above
E) none of the above
7) If the government reduces spending ________.
A) the IS curve will shift to the right
B) output will increase if interest rates remain fixed
C) consumption will increase
D) all of the above
E) none of the above
8) If the government raises taxes ________.
A) planned expenditures fall
B) equilibrium output falls
C) the IS curve shifts to the left
D) all of the above
E) none of the above
9) If the government cuts taxes ________.
A) disposable income falls
B) planned expenditures rise
C) the IS curve shifts to the left
D) all of the above
E) none of the above
10) The 2009 fiscal stimulus package was passed ________.
A) to prevent the real interest rate from rising
B) to shift the IS curve to the left
C) to raise aggregate output at any interest rate
D) all of the above
E) none of the above
11) The 2009 fiscal stimulus package did not work ________.
A) in that the IS curve did not shift to the right
B) because most of the intended increase in government spending took too long to kick in
C) because the increase in government spending was not enough to offset the decline in
autonomous expenditure
D) all of the above
E) none of the above
12) The 2009 fiscal stimulus package did not work ________.
A) because rising interest rates nullified increased expenditures
B) because government spending rose too quickly and too briefly
C) but it probably prevented the IS curve from shifting further to the left
D) all of the above
E) none of the above
13) Qualitatively, an increase in government purchases has the same impact as an increase in
autonomous ________.
A) consumption
B) investment
C) net exports
D) all of the above
E) none of the above
14) In the IS model, assuming that the real interest rate does not change, an increase in
autonomous ________ leads to an increase in the equilibrium level of ________.
A) investment; consumption
B) consumption; investment
C) net exports; investment
D) all of the above
E) none of the above
15) In the IS model, assuming that the real interest rate does not change, an increase in
autonomous ________ leads to an increase in the equilibrium level of ________.
A) investment; net exports
B) consumption; government purchases
C) net exports; taxes
D) all of the above
E) none of the above
16) In the IS model, assuming that the real interest rate does not change, an increase in
autonomous net exports causes total investment, planned plus unplanned, to ________.
A) fall, then rise back to its initial level
B) fall, then rise above its initial level
C) rise, then fall back to its initial level
D) all of the above
E) none of the above
17) In the IS model, assuming that the real interest rate does not change, an increase in ________
leads to an increase in equilibrium saving by households.
A) autonomous investment
B) government purchases
C) autonomous net exports
D) all of the above
E) none of the above
18) In the IS model, assuming that the real interest rate does not change, an increase in ________
leads to an increase in equilibrium saving by households.
A) autonomous consumption
B) taxes
C) financial frictions
D) all of the above
E) none of the above
19) In the IS model, assuming that the real interest rate does not change, an increase in
autonomous ________ leads to a decrease in equilibrium saving.
A) investment
B) consumption
C) net exports
D) all of the above
E) none of the above
20) An increase in autonomous consumption ________.
A) lowers planned expenditures
B) raises equilibrium output for any level of the interest rate
C) causes a movement down along the IS curve
D) all of the above
E) none of the above
22
21) A decrease in autonomous consumption ________.
A) lowers planned expenditures
B) raises equilibrium output for any level of the interest rate
C) causes a movement down along the IS curve
D) all of the above
E) none of the above
22) A decrease in autonomous consumption ________.
A) raises planned expenditures
B) lowers equilibrium output for any level of the interest rate
C) shifts the IS curve to the right
D) all of the above
E) none of the above
23) An increase in autonomous investment ________.
A) increases equilibrium output at any interest rate
B) causes a movement down along the IS curve
C) shifts the IS curve to the left
D) all of the above
E) none of the above
24) A decrease in autonomous investment ________.
A) increases equilibrium output at any interest rate
B) causes a movement down along the IS curve
C) shifts the IS curve to the left
D) all of the above
E) none of the above
25) A decrease in autonomous investment ________.
A) decreases equilibrium output at any interest rate
B) lowers planned expenditures
C) shifts the IS curve to the left
D) all of the above
E) none of the above
26) If people feel optimistic about the future of the economy ________.
A) autonomous consumption might increase
B) autonomous investment might increase
C) it might shift the IS curve to the right
D) all of the above
E) none of the above
27) In a stock market boom ________.
A) autonomous consumption might increase because stock holders might feel richer and
consume more
B) autonomous investment might increase because a higher stock value for a firm helps firms
raise funds for increased investment
C) the IS curve might shift to the right
D) all of the above
E) none of the above
28) In a stock market boom ________.
A) government spending will decrease
B) interest rates will decrease
C) saving is likely to decrease
D) all of the above
E) none of the above
24
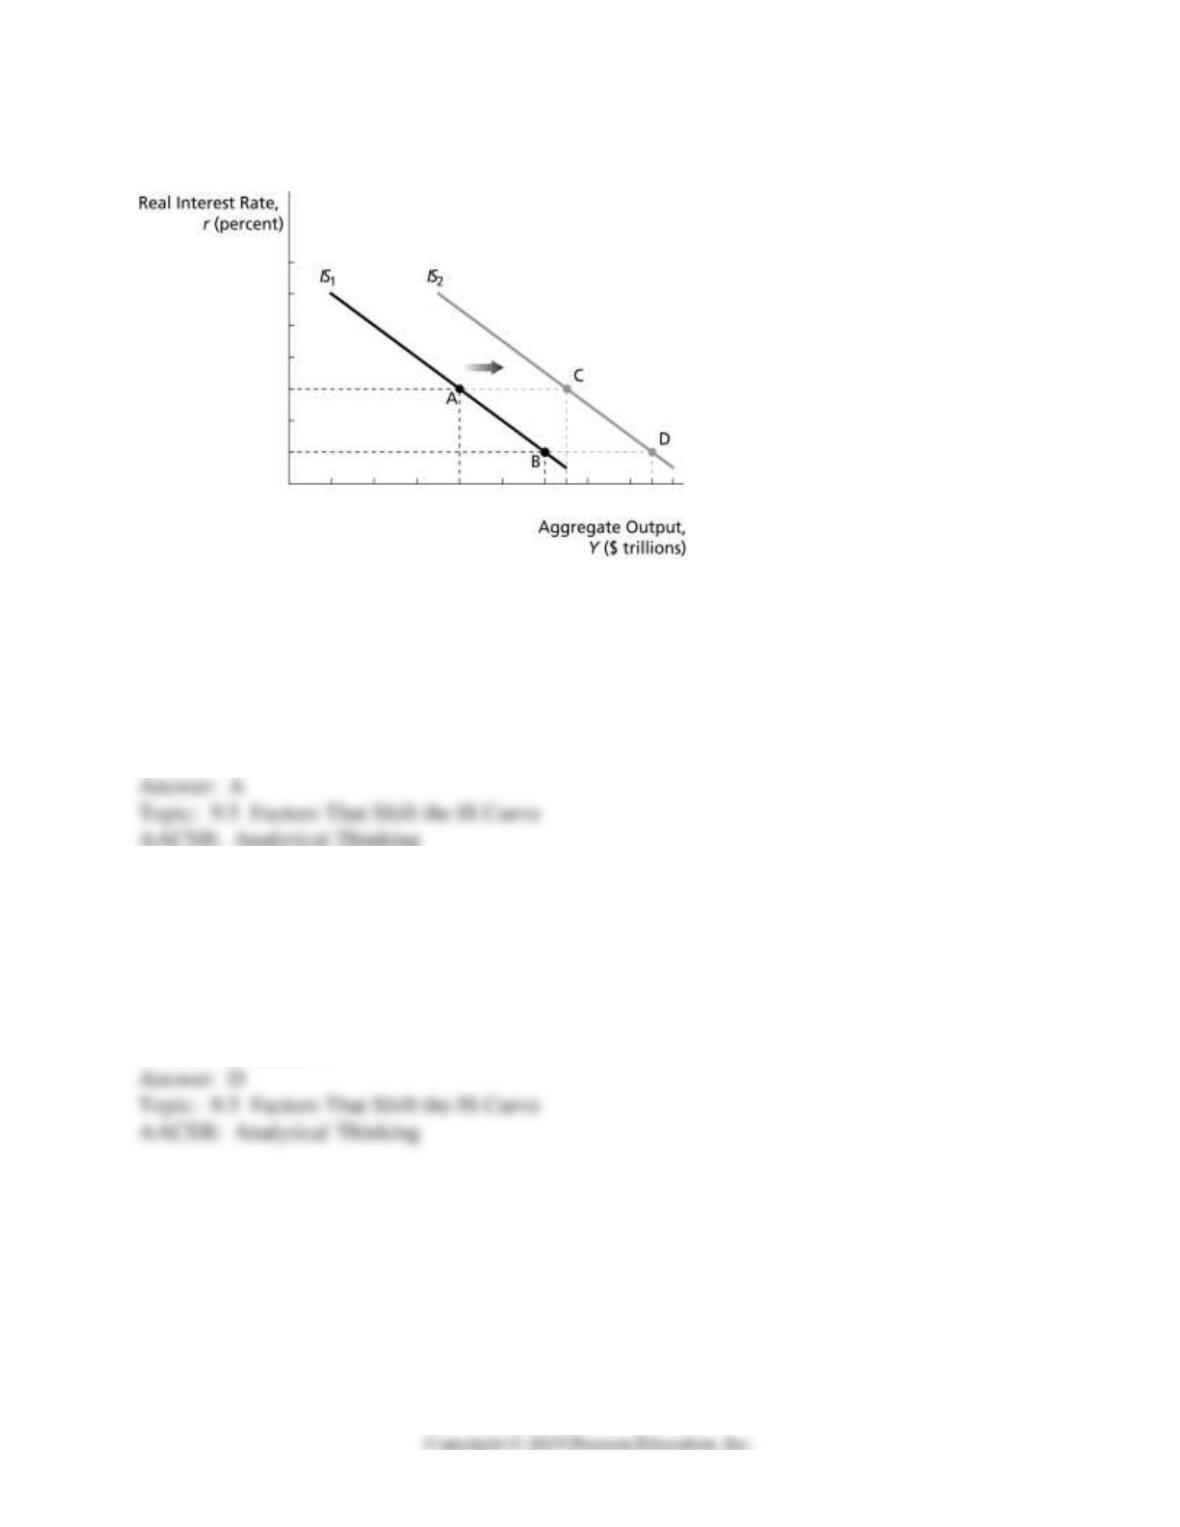
IS Graph 2
29) On the graph above, a possible cause of the rightward shift of the IS curve is an increase in
________.
A) foreign demand for domestic goods
B) taxes
C) domestic demand for foreign goods
D) the exchange rate
E) none of the above
30) On the graph above, unplanned inventory investment occurs if the economy is moving from
point ________ to point ________.
A) D; C
B) C; B
C) B; A
D) all of the above
E) none of the above
31) On the graph above, the amount of inventory depletion will be greatest if the economy is
moving from point ________ to point ________.
A) A; D
B) D; A
C) D; C
D) B; A
E) B; C
32) On the graph above, if the economy is at point A when the real interest rate falls, the
economy’s new situation might be indicated by point ________.
A) A
B) B
C) C
D) D
E) none of the above
33) On the graph above, if the U.S. economy is at point B in 2009, then the economy in 2010 is
best represented by point ________.
A) A
B) B
C) C
D) D
E) any of the labeled points is as good as the others
34) The credit spread is countercyclical and coincident, suggesting that a sudden increase in
financial frictions is most likely ________.
A) when the economy has been expanding for some time
B) after the economy has turned into a recession
C) during the recovery phase of the business cycle
D) when expected inflation is declining
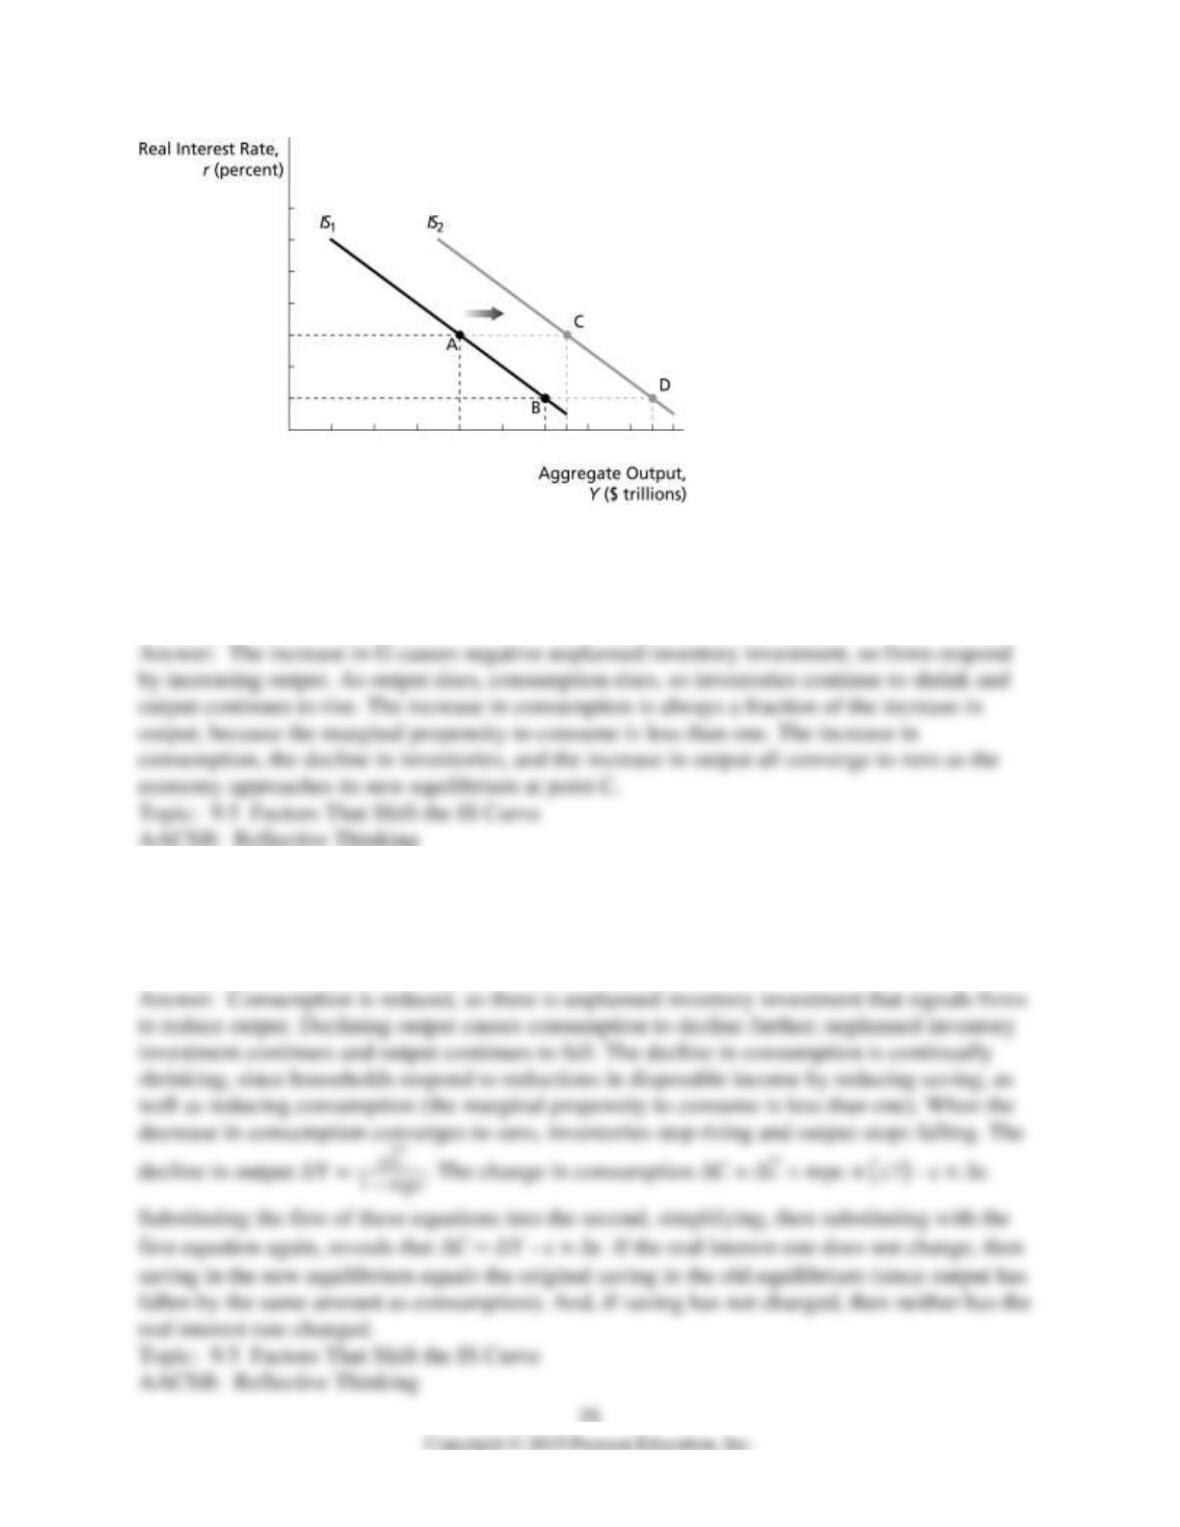
35) Referring to the graph above, assume that the economy is in equilibrium at point A, then an
increase in government purchases shifts the IS curve to the right, while the real interest rate
remains constant. Explain, step-by-step, how the components of expenditure adjust to bring the
economy to its new equilibrium.
36) Assume that households decide to save more, so autonomous consumption is reduced.
Explain, step-by-step, how the components of expenditure adjust to bring the economy to its new
equilibrium. Using the IS curve equation and the consumption function, compare the initial and
new equilibria with respect to saving and the real interest rate.
37) Assume that the economy is in equilibrium when the real interest rate rises. Explain, step-by-
step, how the components of expenditure adjust to bring the economy to its new equilibrium.
38) The IS model implies that a dollar of government spending has a larger impact on
equilibrium output than does a dollar of taxes. Explain.
39) For simplicity, the IS model assumes that neither net exports nor net taxes vary with income.
A more realistic (and complicated) model would drop such assumptions. How would the
behavior of the IS curve differ in the more realistic model?