28) Can the process of consumer choice as illustrated with a budget line/indifference curves
approach explain the downward sloping demand curves that consumers have for goods, such as
Pepsi?
29) “Every point on a demand curve represents a consumer equilibrium in the indifference curve
model.” Explain why the previous statement is correct or not.
30) What is the substitution effect?
31) What is the relationship between the income effect and the substitution effect for a normal
good and what is it for an inferior good?
6 Numeric and Graphing Questions
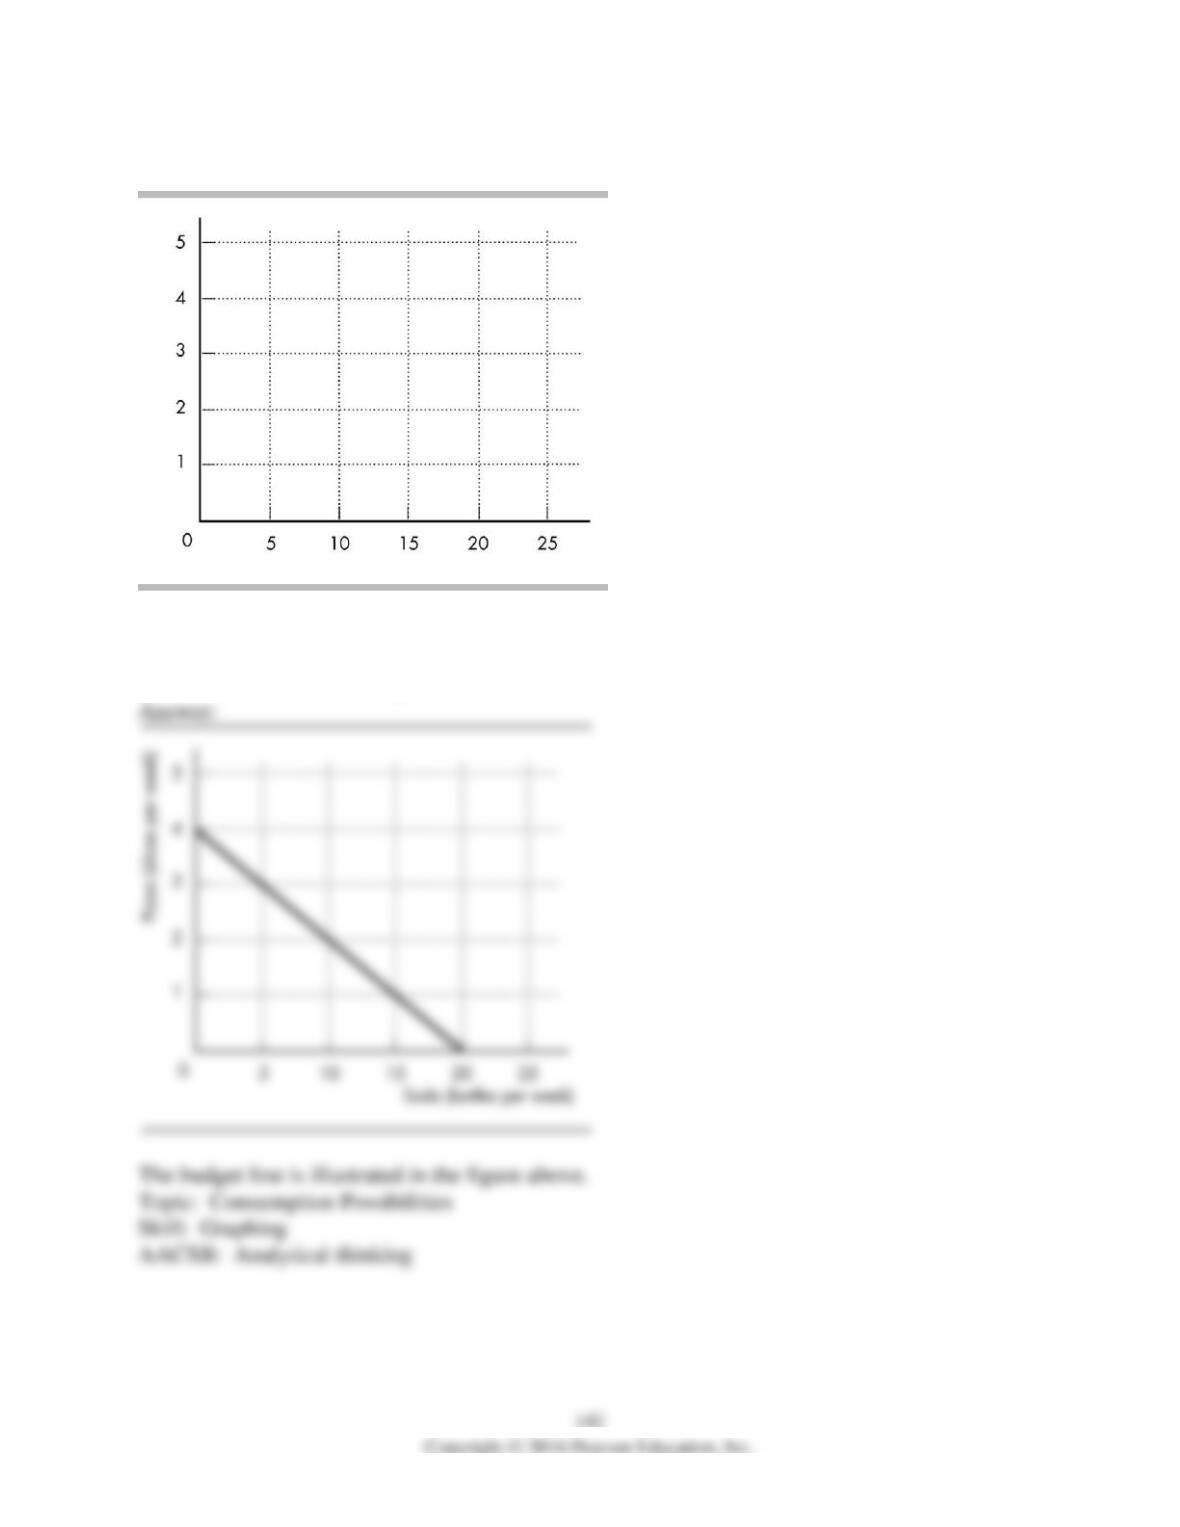
1) Suppose you have a $20 budget per week, the price of soda is $1 per bottle, and the price of
pizza is $4 per slice. In the above figure, draw a budget line for soda and pizza, placing soda on
the horizontal axis. Correctly label the axes.
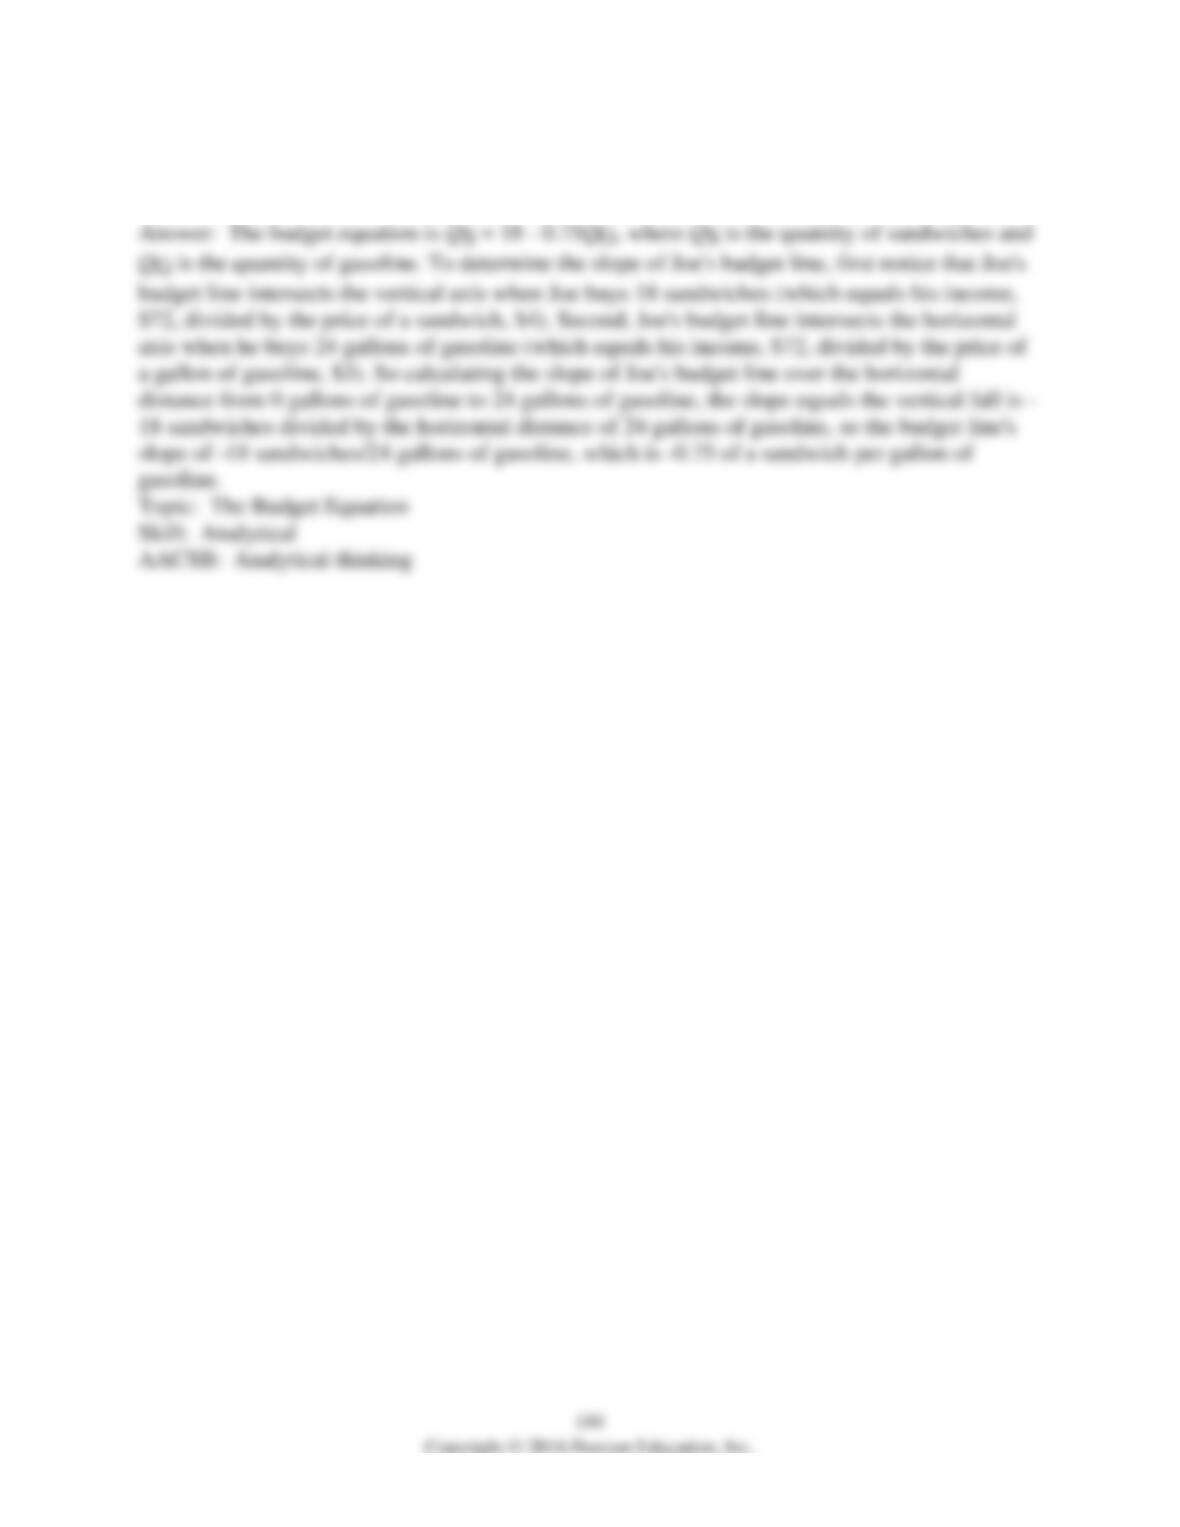
2) John likes to spend Thursday nights playing pool and drinking soda. John’s budget for
Thursday nights is $10, a soda costs $2, and one game of pool costs $1.
a) Draw a graph of John’s budget line in the figure above.
b) In your graph, label the affordable and unaffordable areas.
3) Joe spends $72 on gasoline and sandwiches. The price of a gallon of gasoline is $3 and a
sandwich is $4. Placing the quantity of sandwiches on the left side, what is Joe’s budget
equation? If sandwiches are measured on the vertical axis, what is the slope of Joe’s budget line?
Possibility
Hamburgers
(per day)
Hot dogs
(per day)
A
0
8
B
1
6
C
2
4
D
3
2
E
4
0
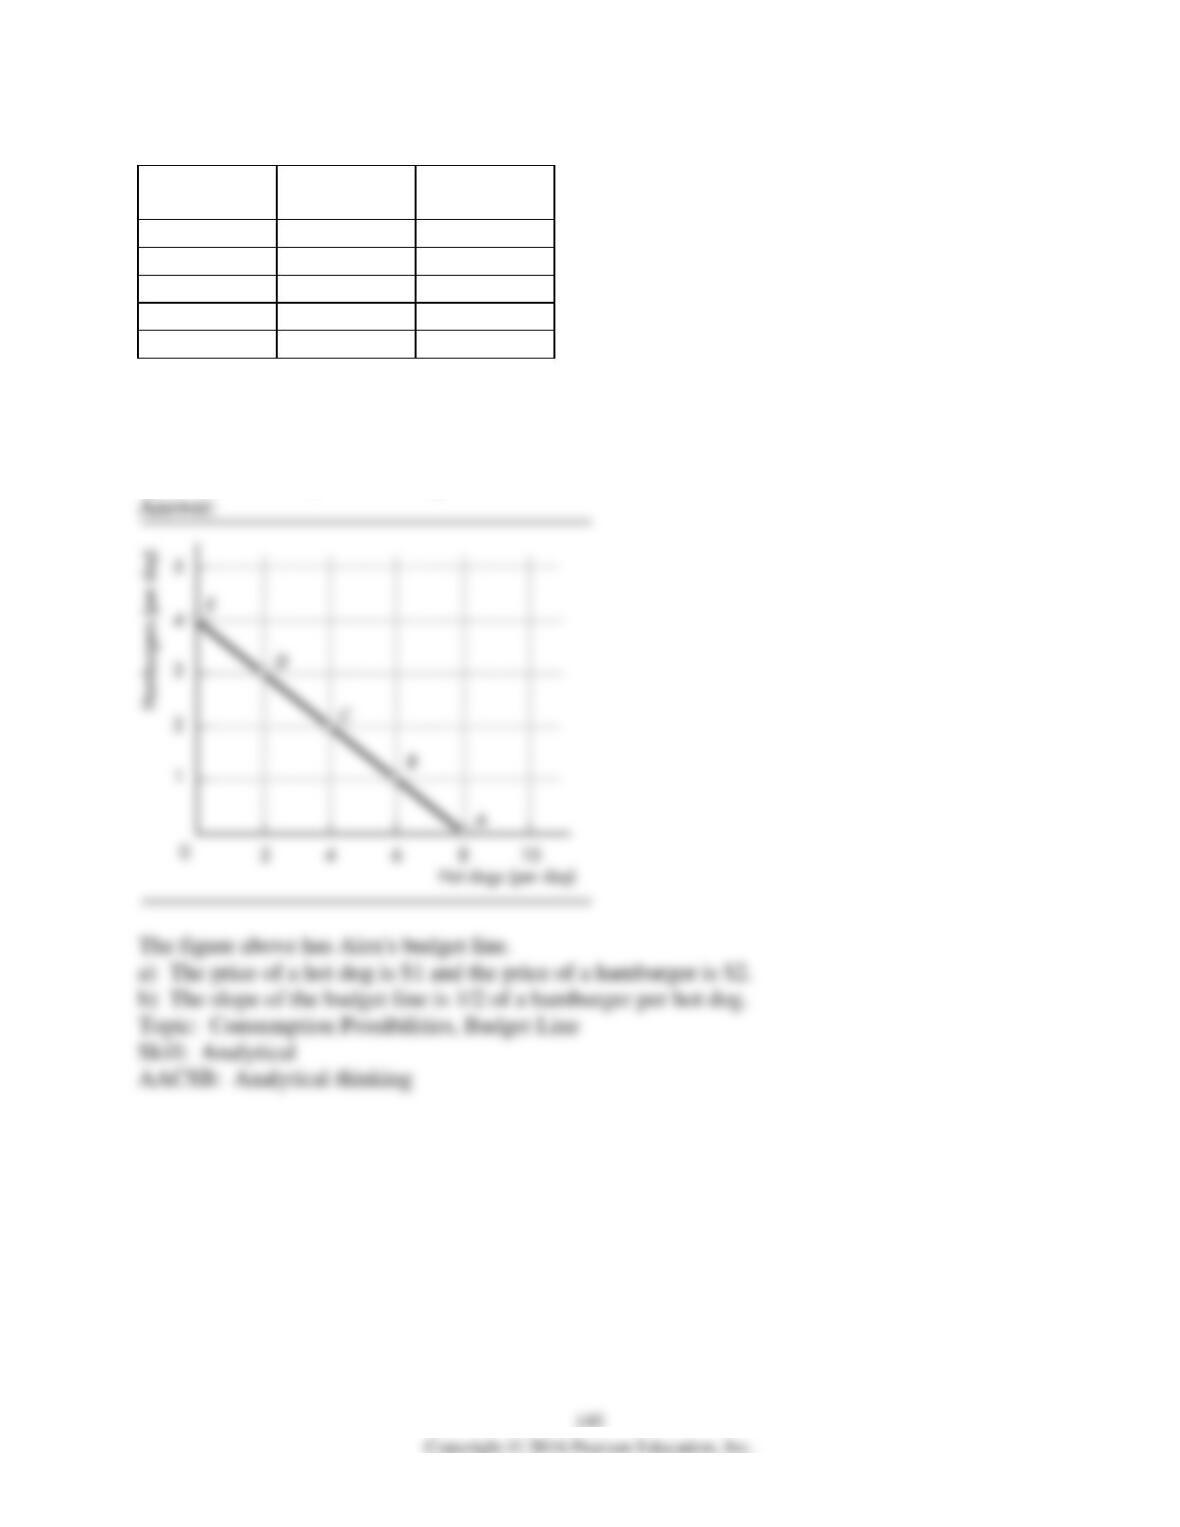
4) The table above has different combinations of hamburgers and hot dogs that Alex can buy.
After labeling the axes, graph Alex’s budget line in the figure, putting hot dogs on the x-axis.
a) Alex’s income is $8 per day. What is the price of a hot dog? Of a hamburger?
b) What is the slope of the budget line?
146
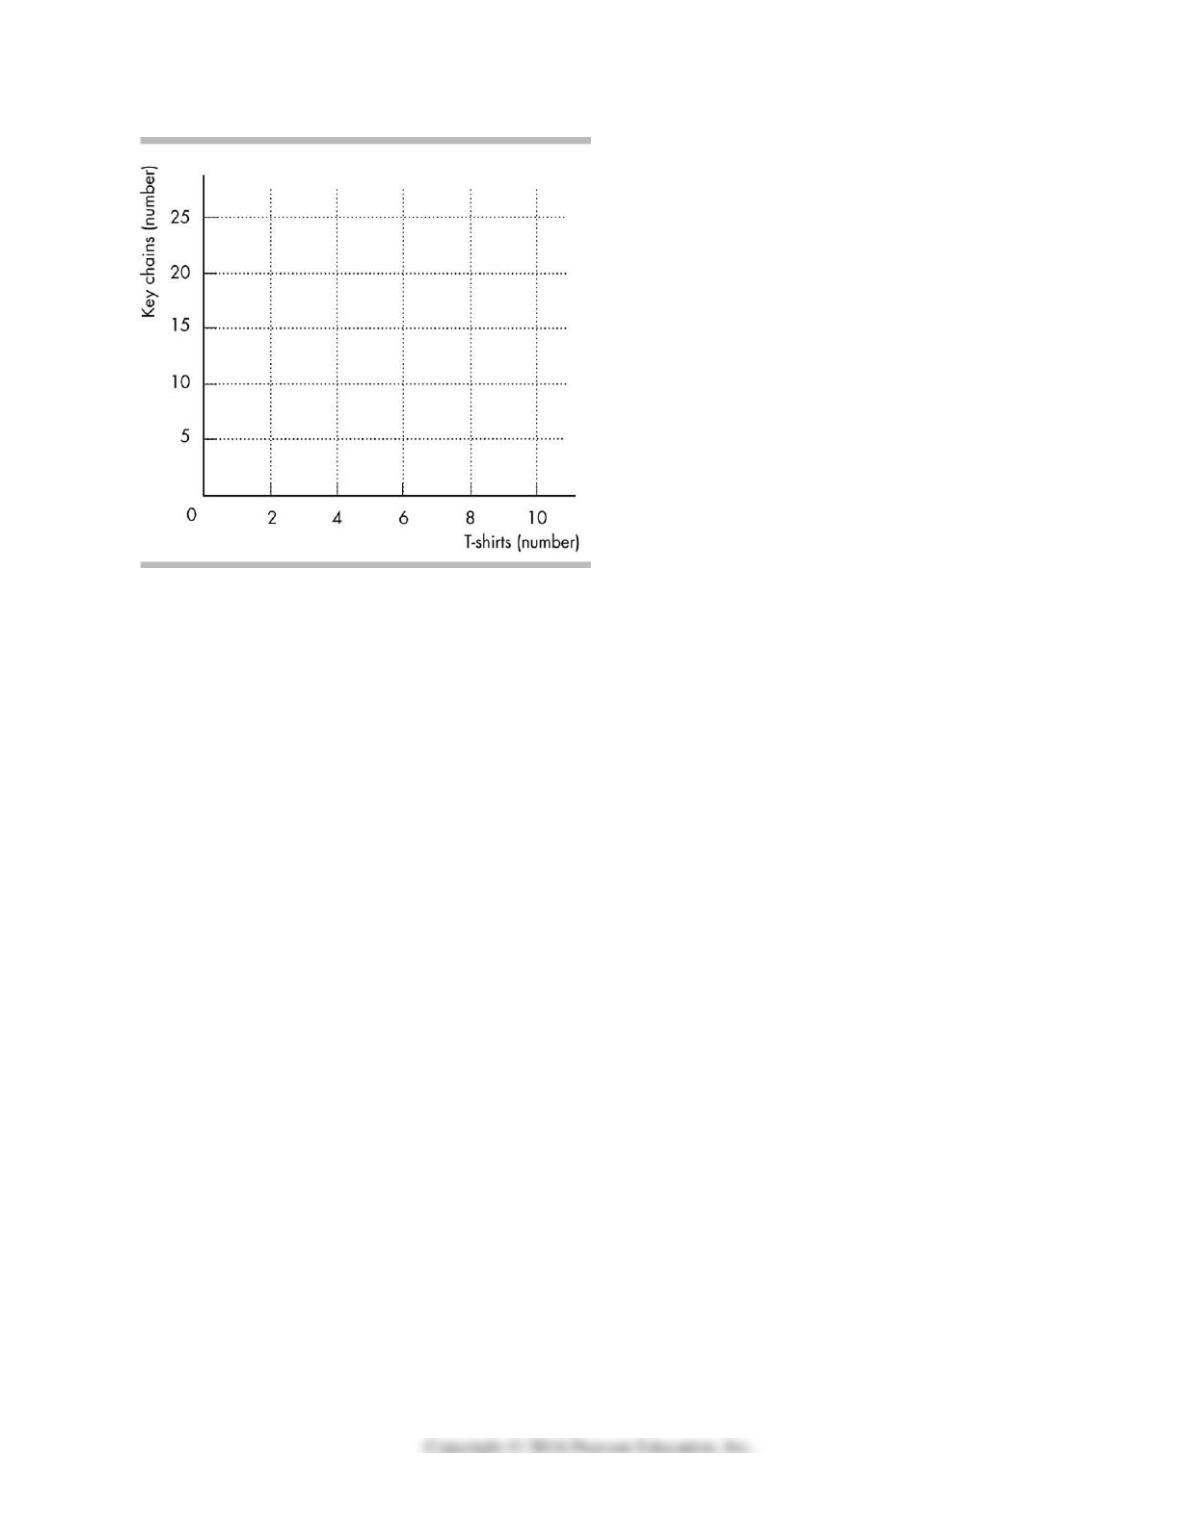
5) Sherry is on vacation and wants to bring souvenirs home to family and friends. Her souvenir
budget is $100, and she can choose between T-shirts, which cost $20 each, and key chains,
which cost $5 each.
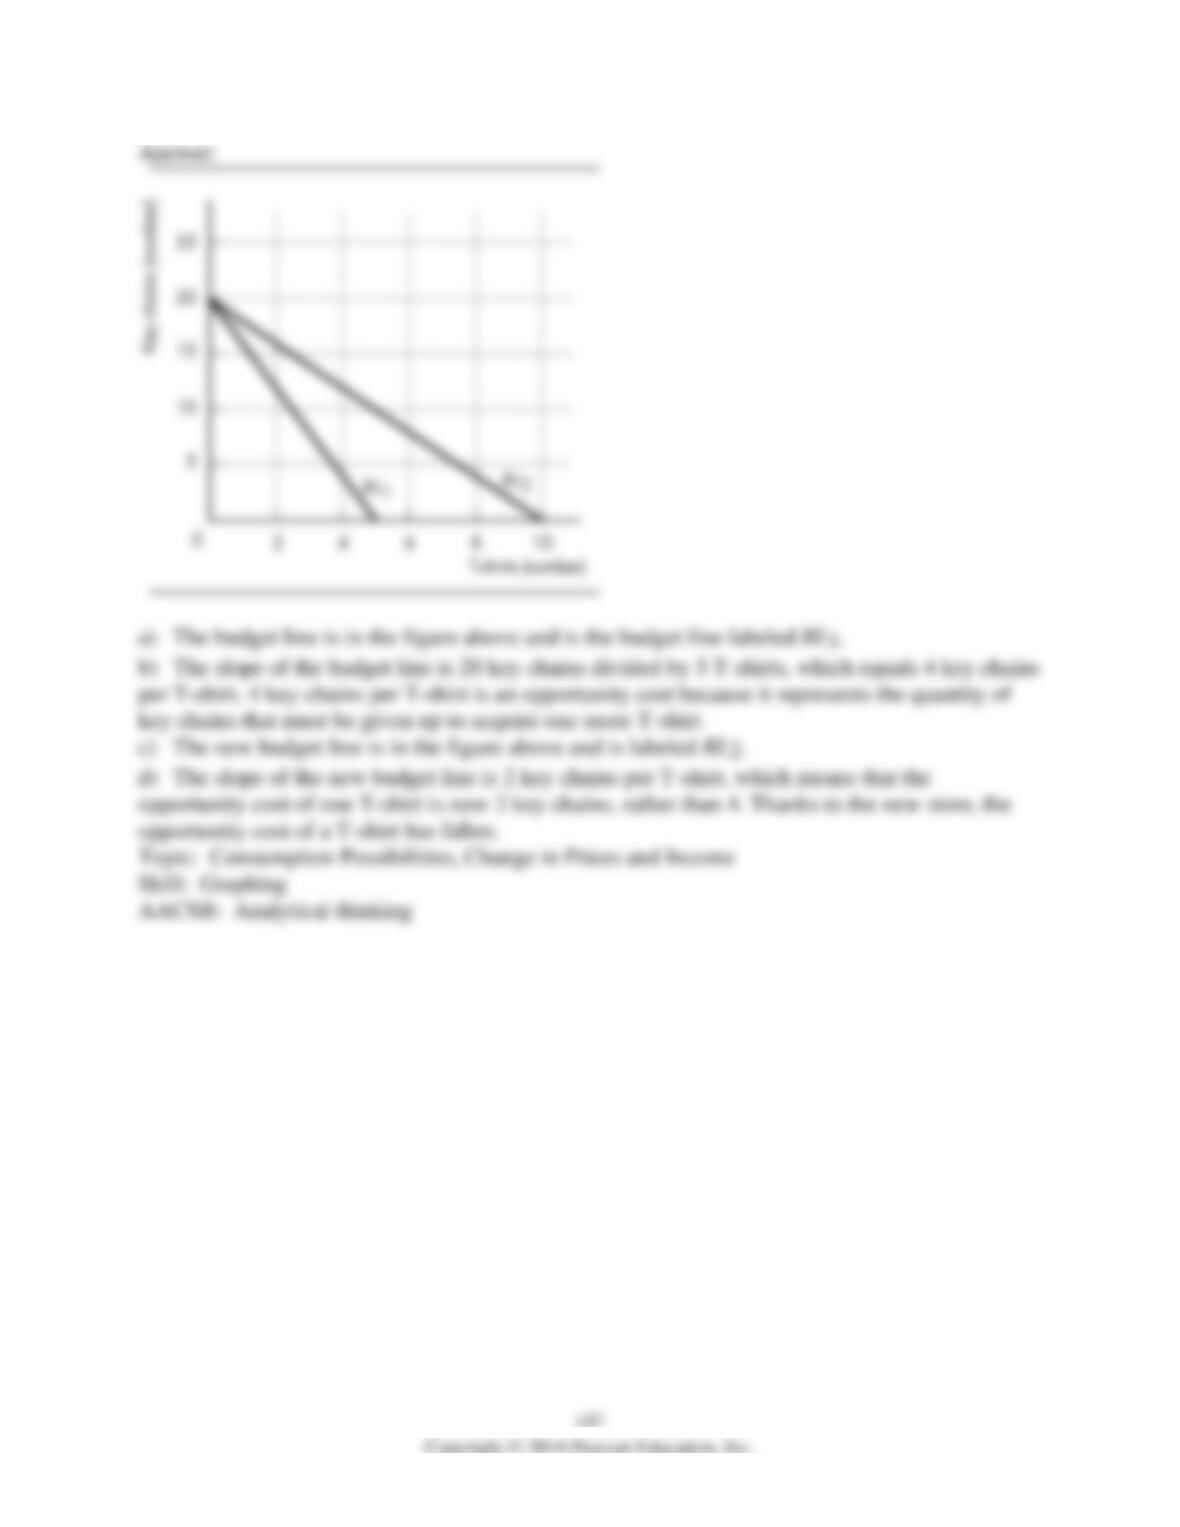
a) Draw a graph of Sherry’s budget line in the figure above.
b) What is the slope of Sherry’s budget line? How does that slope represent an opportunity cost?
Suppose that Sherry now finds a store where T-shirts are on sale for $10 each. (Key chains still
cost $5 each).
c) Draw the new budget line in the figure.
d) What is the slope of the new budget line? How has the opportunity cost changed?
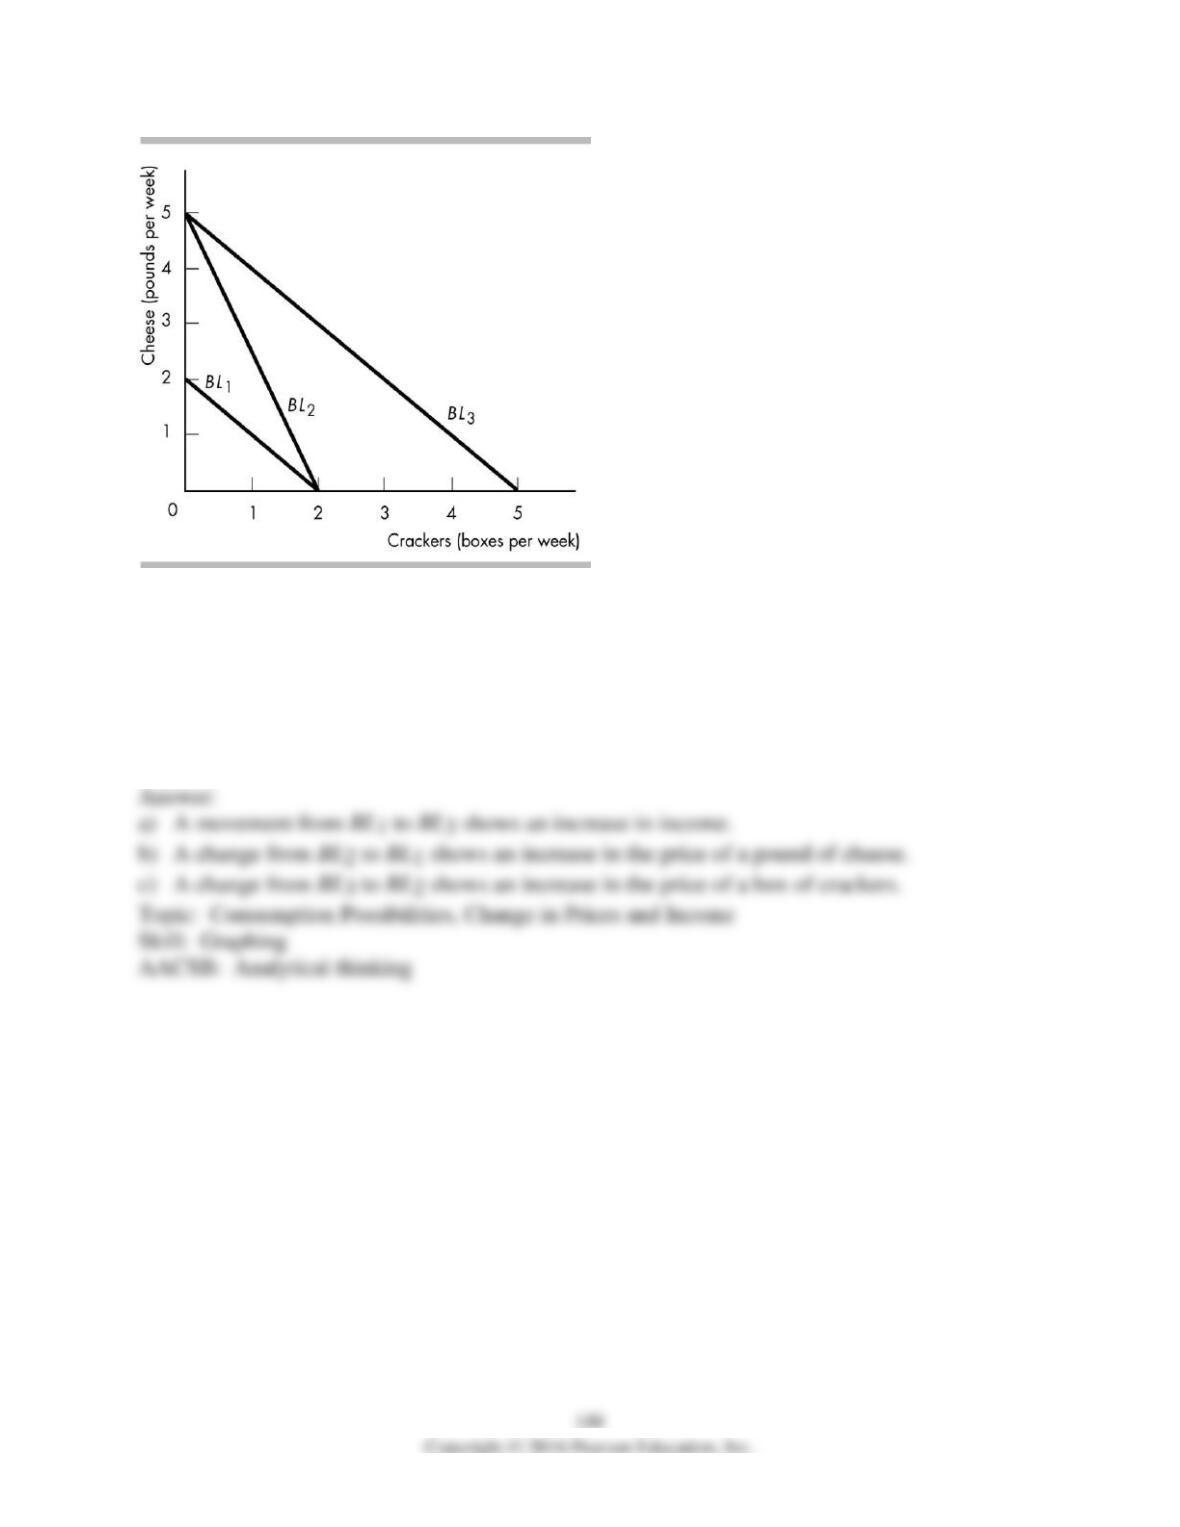
6) The figure above contains several budget lines for Sarah, who uses her income to purchase
two goods, cheese and crackers.
a) A movement between which two budget lines represents an increase in income?
b) A movement between which two budget lines represents an increase in the price of a pound
of cheese?
c) A movement between which two budget lines represents an increase in the price of a box of
crackers?
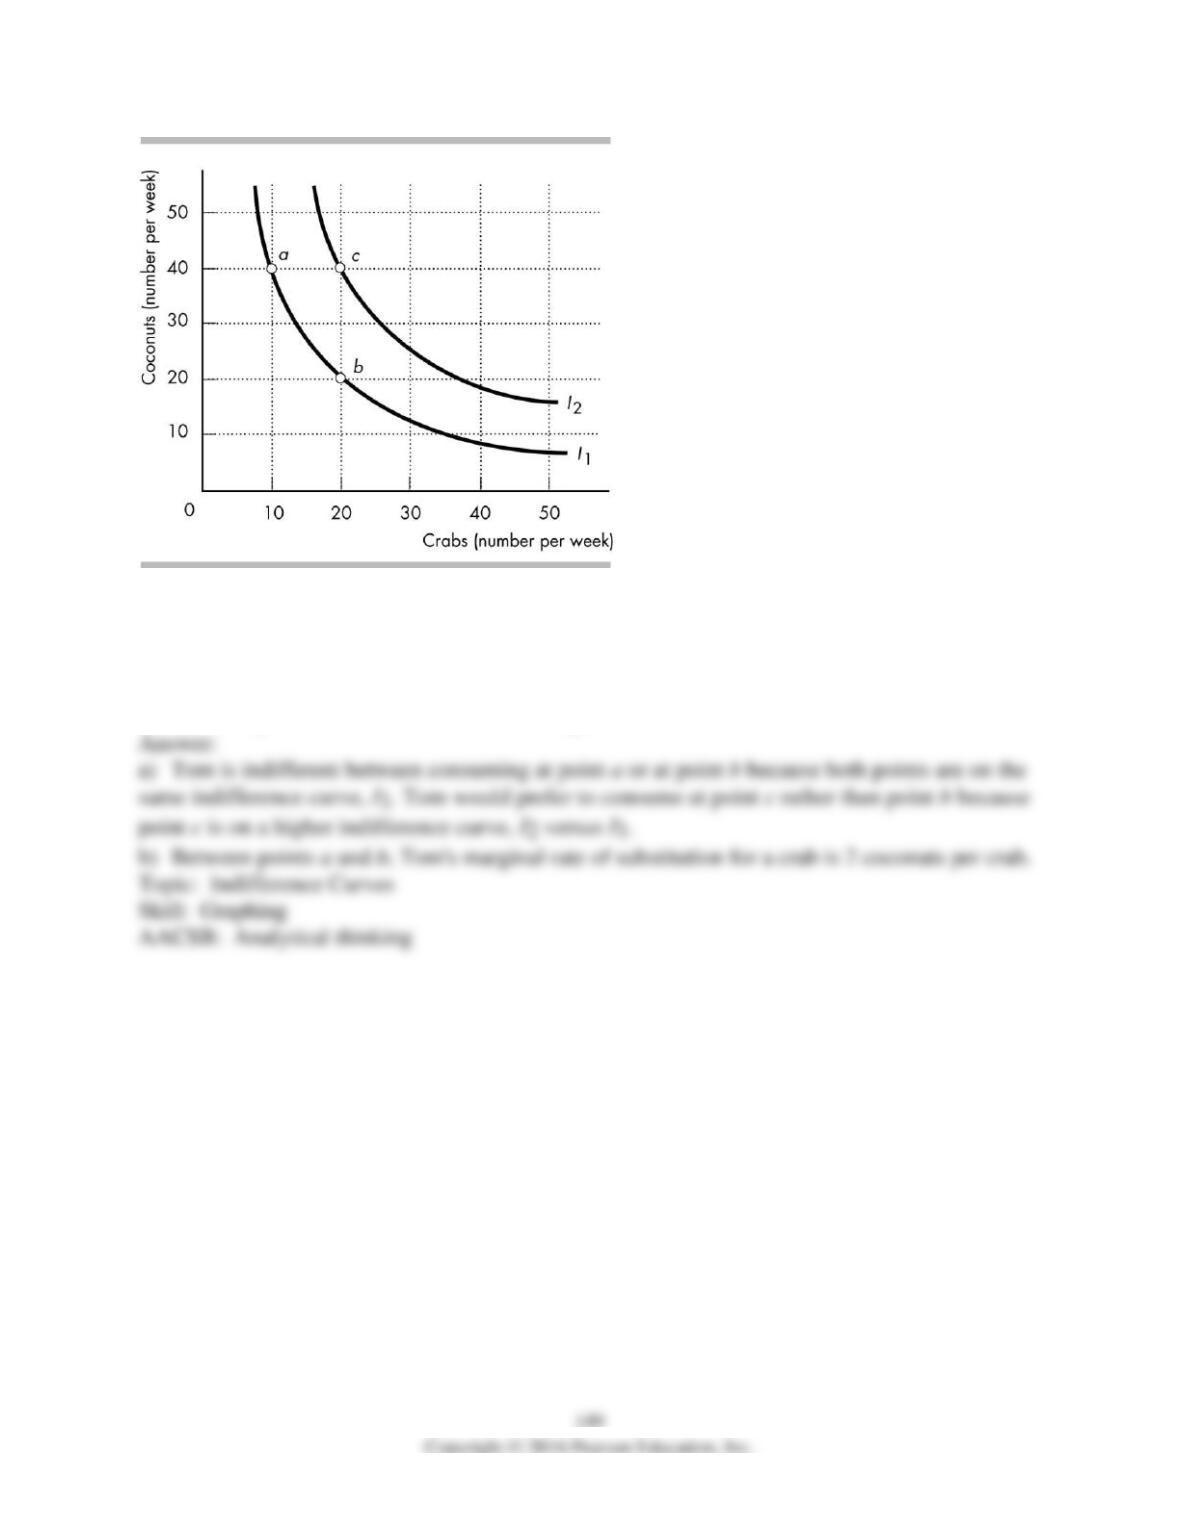
7) Tom is stranded on a deserted island where he can only consume coconuts and crabs. Two of
his indifference curves are in the figure above.
a) Would Tom prefer his consumption to be at point a or at point b? At point b or at point c?
Explain your answers.
b) Between points a and b, what is Tom’s marginal rate of substitution for a crab?
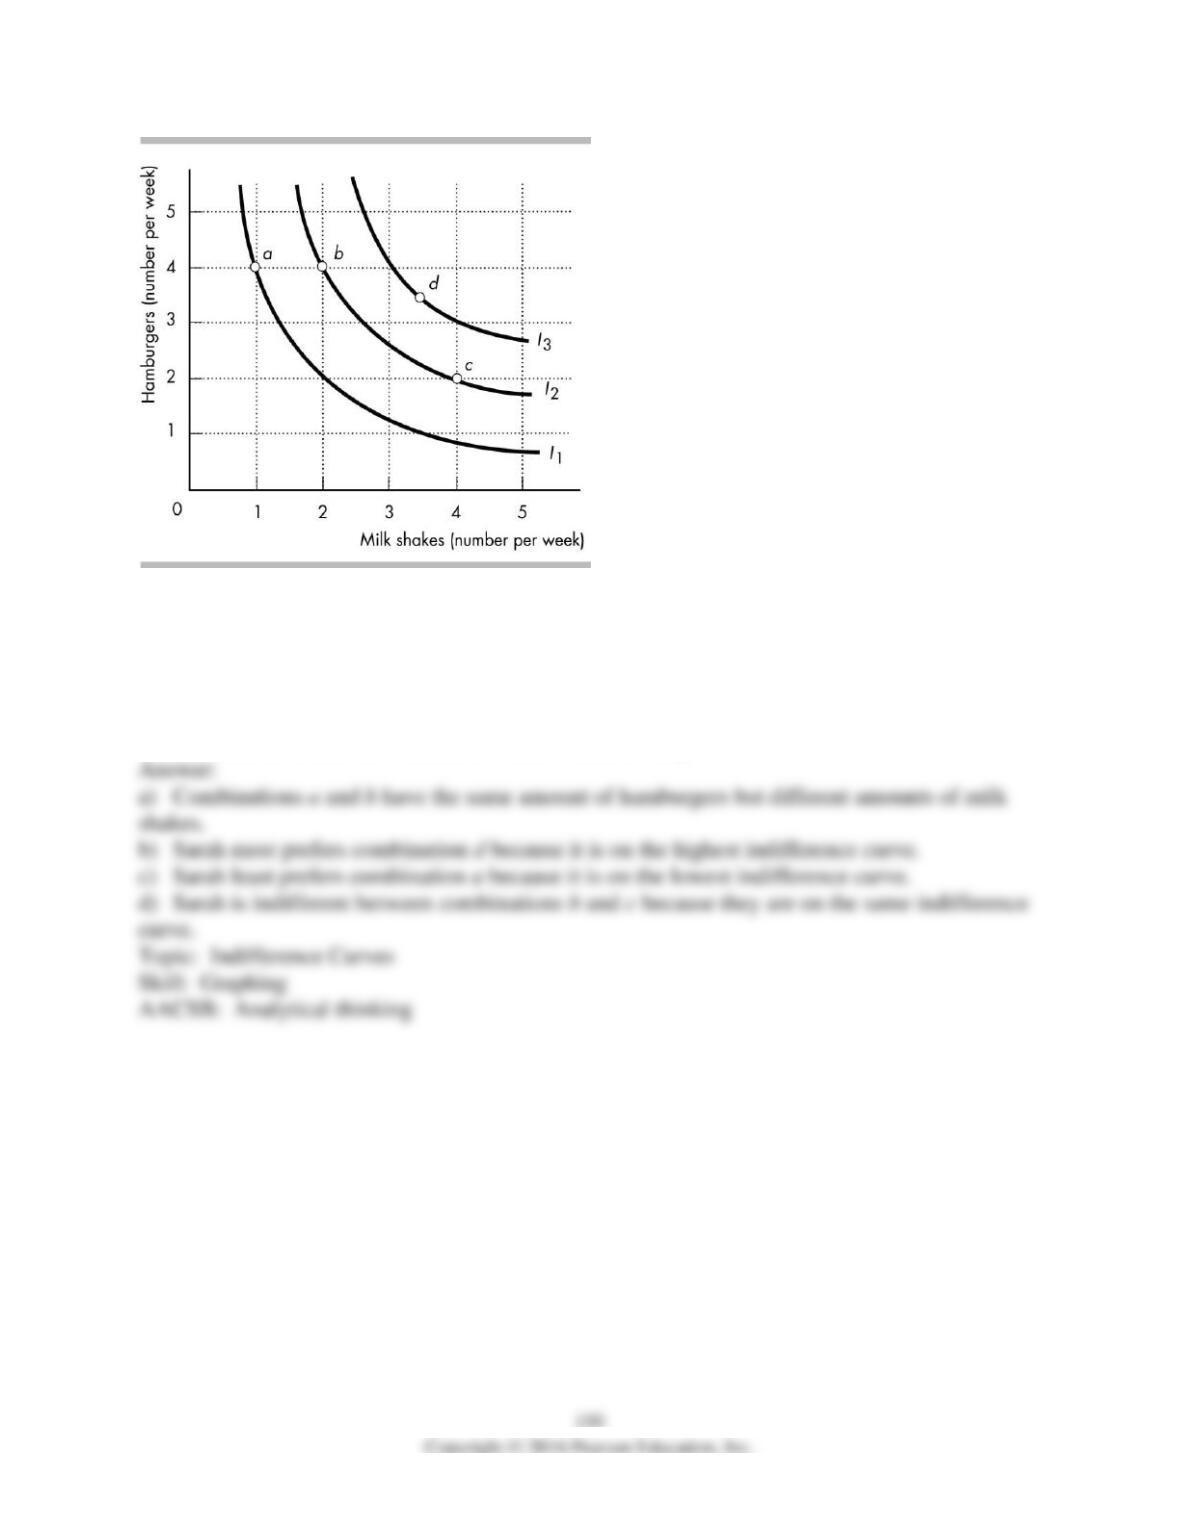
8) The figure above shows a preference map for Sarah, who likes hamburgers and milk shakes.
a) Which two combinations contain the same amount of hamburgers but different quantities of
shakes?
b) Which combination(s) does Sarah most prefer? Why?
c) Which combination(s) does Sarah least prefer? Why?
d) Between which combinations is Sarah indifferent? Why?
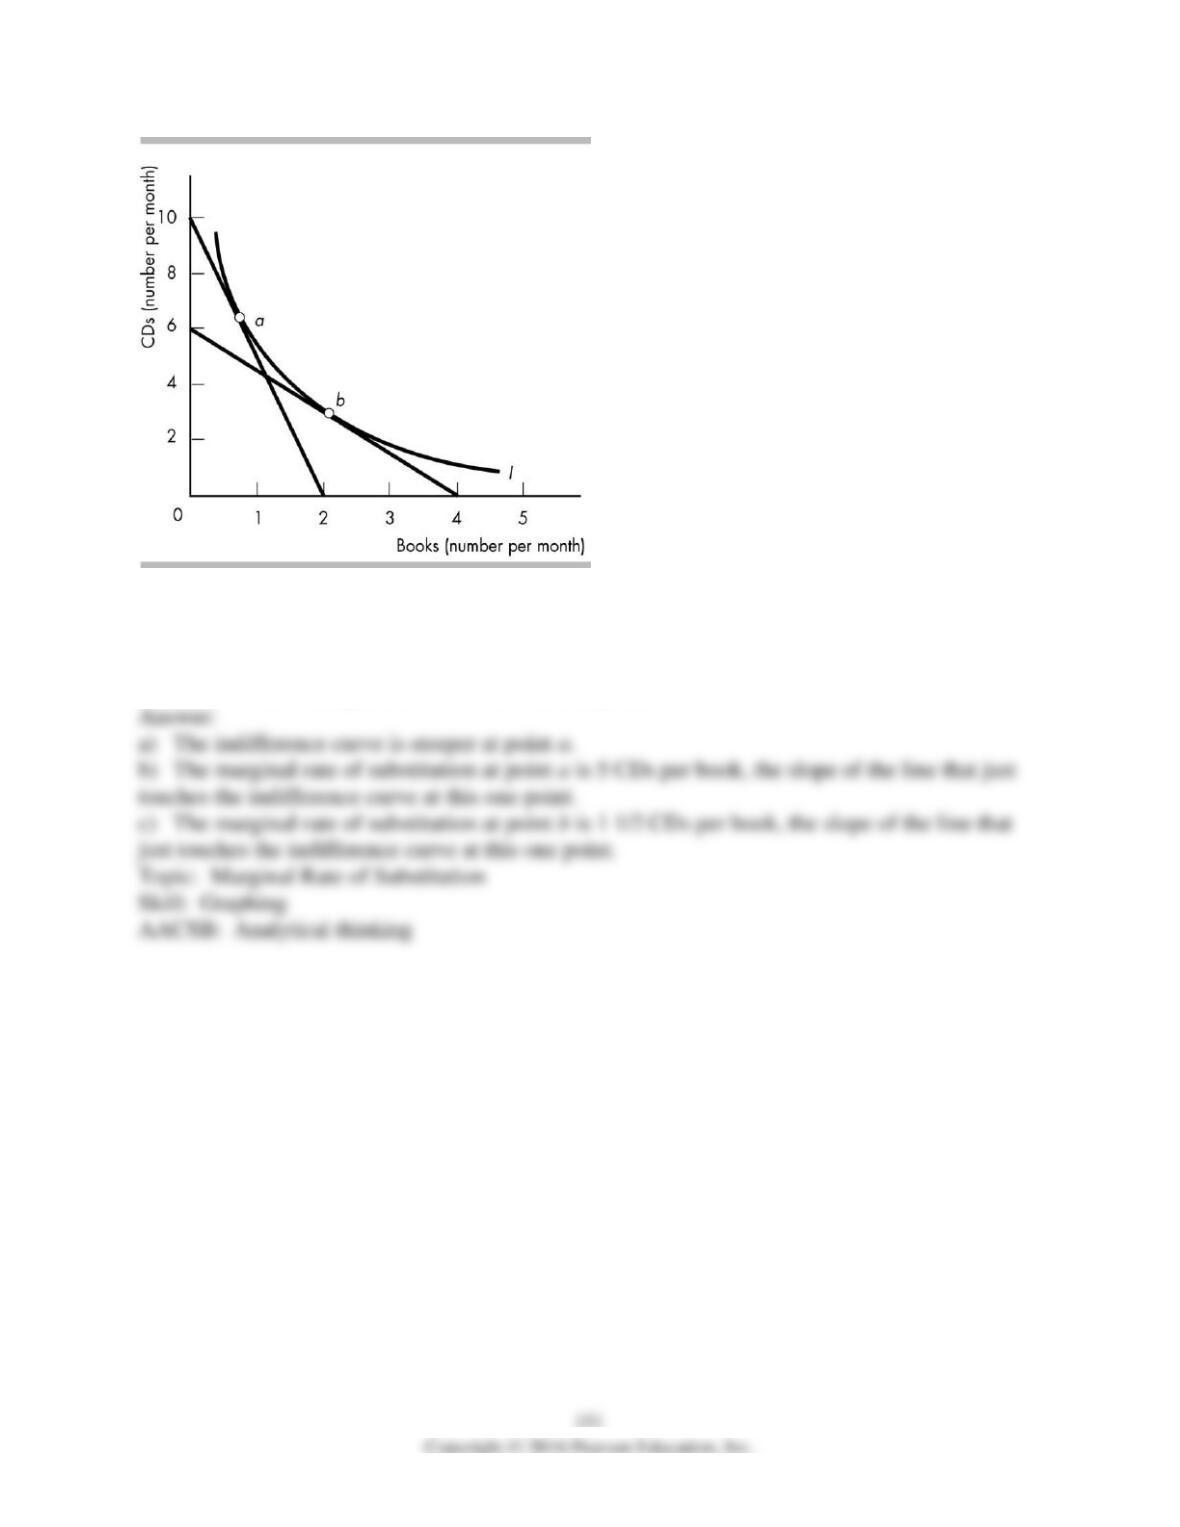
9) The figure above shows one of Bob’s indifference curves for CDs and books.
a) Is the indifference curve steeper at point a or point b?
b) What is Bob’s marginal rate of substitution at point a?
c) What is Bob’s marginal rate of substitution at point b?
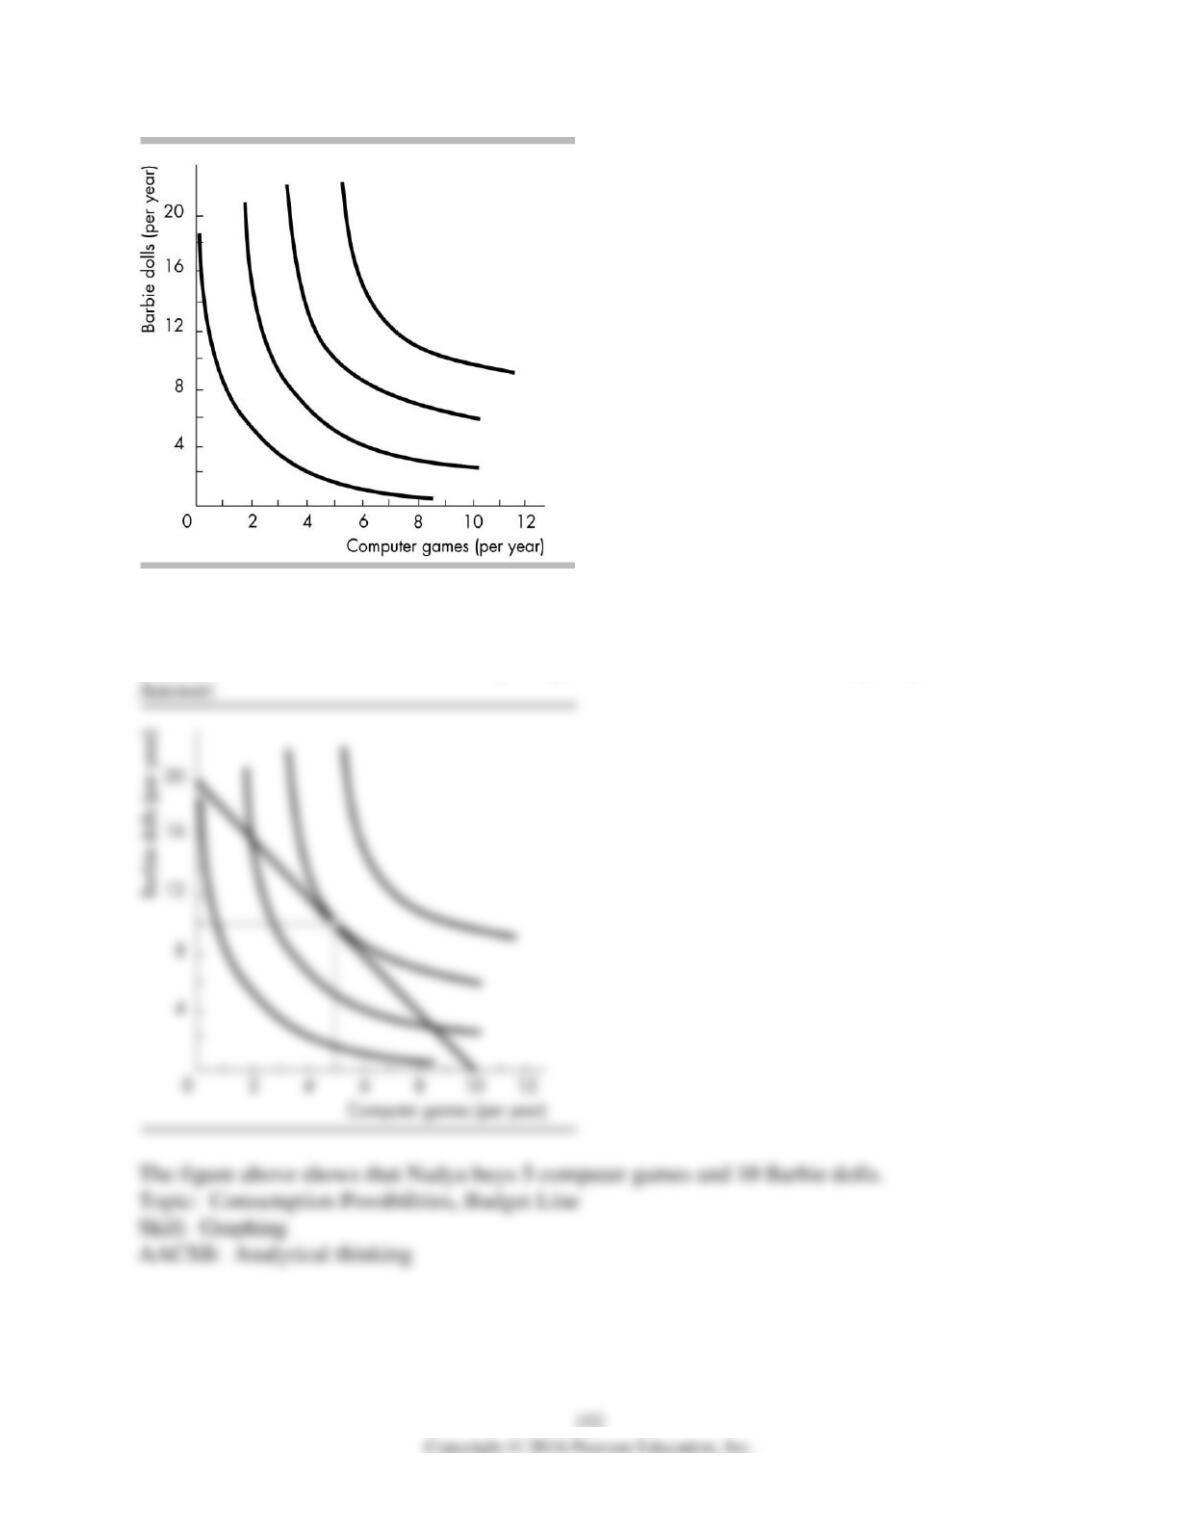
10) Nadya spends $200 a year to buy computer games and Barbie dolls. The price of a computer
game is $20 and the price of a Barbie doll is $10. The figure above illustrates Nadya’s
preferences. What combination of computer games and Barbie dolls does Nadya buy?
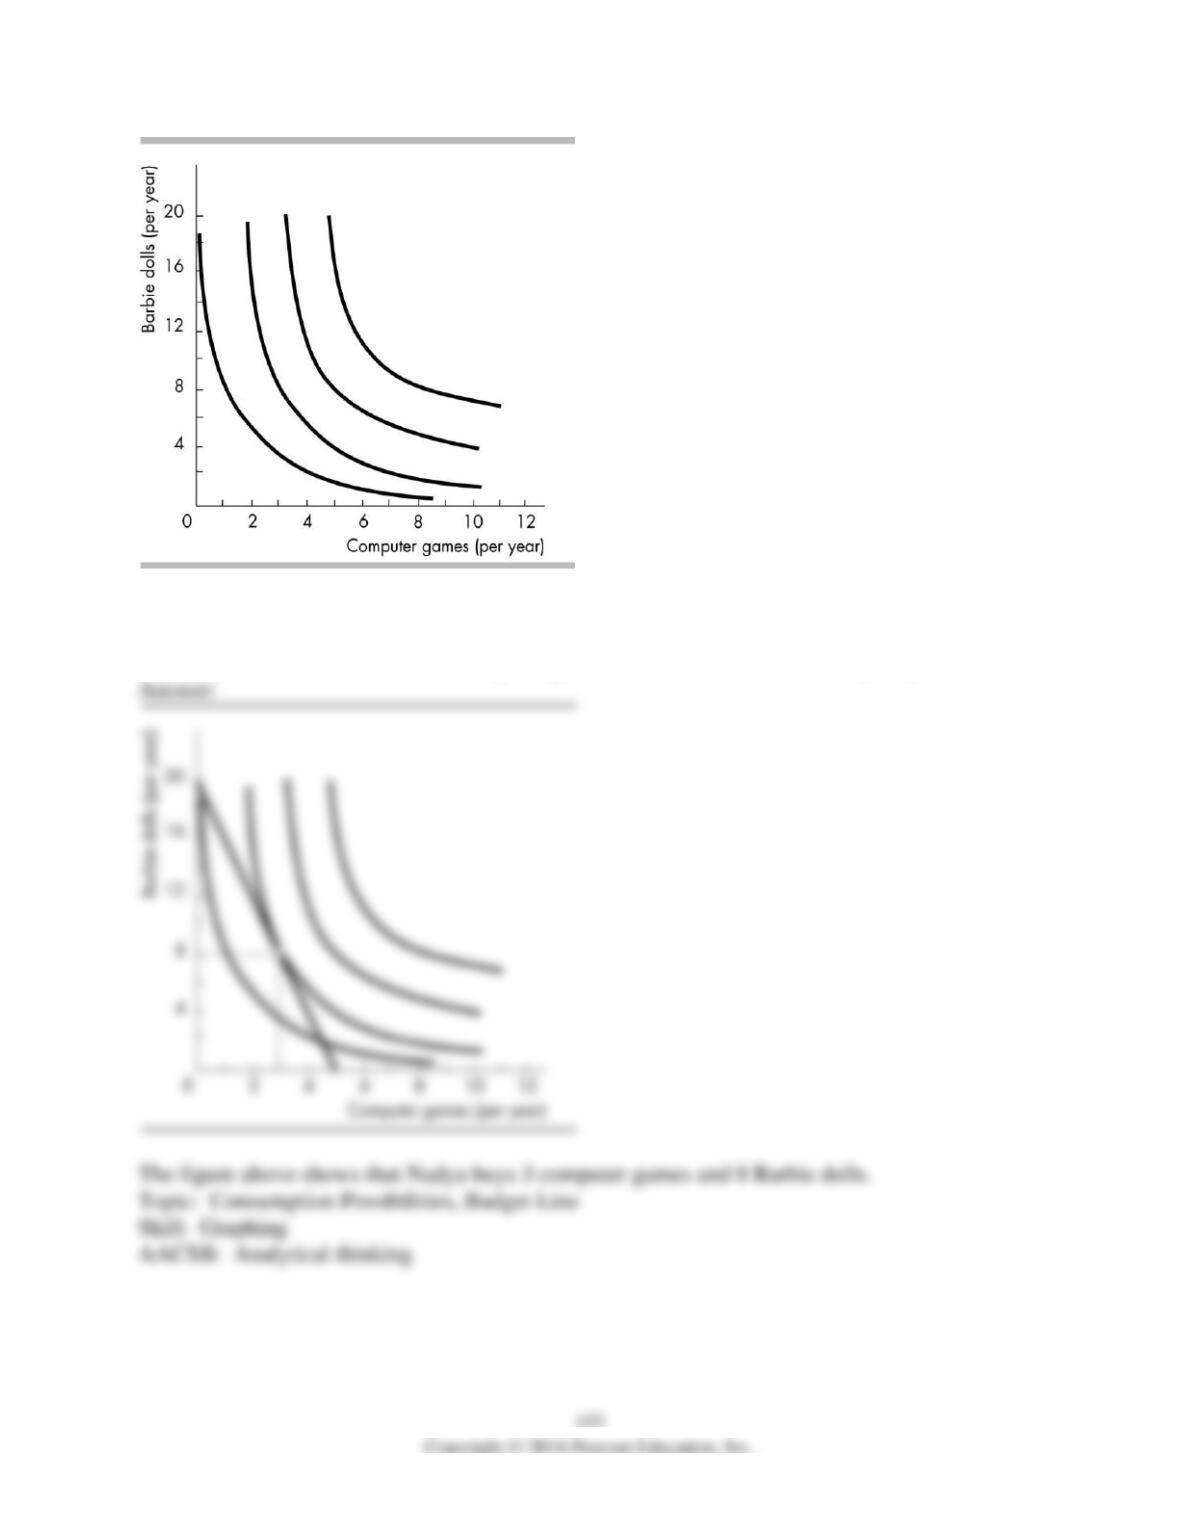
11) Nadya spends $200 a year to buy computer games and Barbie dolls. The price of a computer
game is $40 and the price of a Barbie doll is $10. The figure above illustrates Nadya’s
preferences. What combination of computer games and Barbie dolls does Nadya buy?
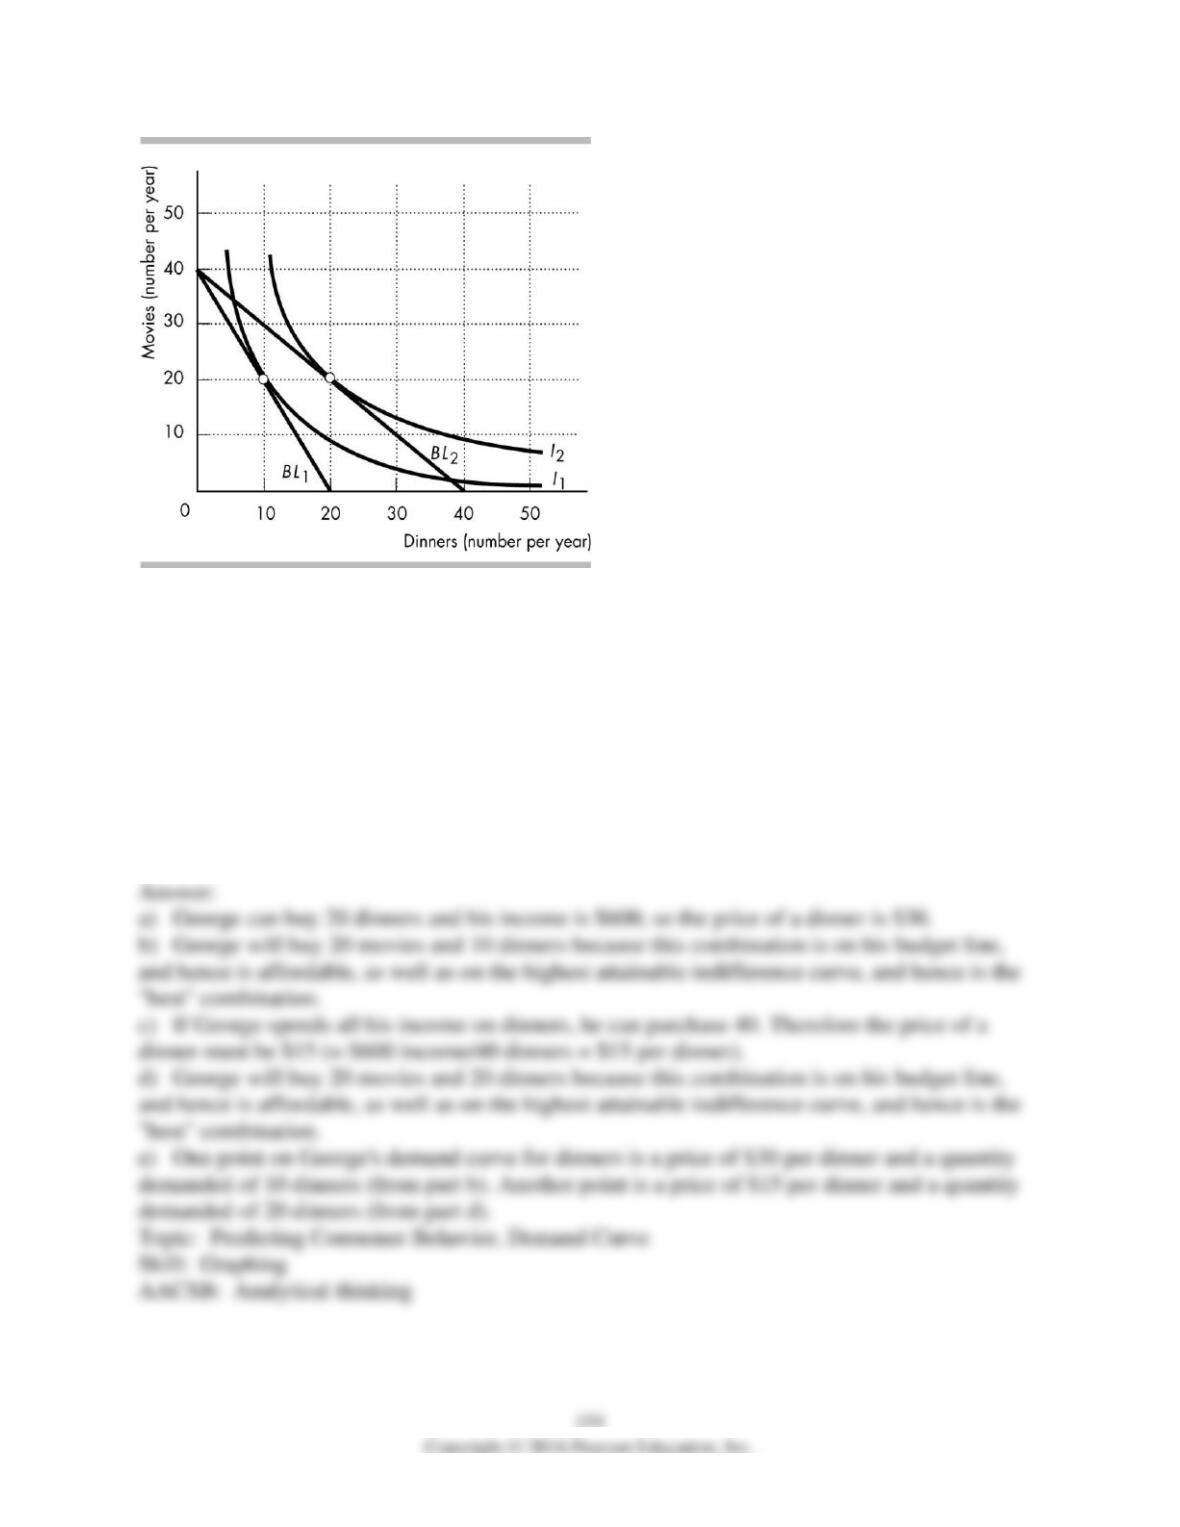
12) George has a $600 annual entertainment budget that he uses to buy trips to the movies and
dinners at local restaurants. The figure above shows indifference curves and budget lines for
these two goods. The price of a movie is $15.
a) Along budget line BL1, what is the price of a dinner?
b) What combination of dinners and movies will George select along budget line BL1?
c) Budget line BL2 represents a change in the price of dinners from that along BL1. What is the
new price of dinners along this budget line?
d) What combination of dinners and movies will George select along budget line BL2?
e) Use the information in this problem to give two points on George’s demand curve for
dinners.