16) ________ on an indifference curve that is farther from the origin ________ on an
indifference curve that is closer to the origin.
A) Some combinations; are preferred to some combinations
B) Any combination; is preferred to any combination
C) Most combinations; are preferred to all combinations
D) Combinations; are not as affordable as combinations
17) If two consumption points are not on the same indifference curve, then one point is
________.
A) a substitute for the other point
B) unaffordable and the other is affordable
C) preferred to the other
D) more expensive than the other
18) If the combination of goods consumed at point C is preferred to combination D then
A) point C is on a higher indifference curve.
B) point C is on the same indifference cure but at a point where the vertical axis value is greater
than point D’s vertical axis value.
C) point C is on a lower indifference curve.
D) point C is on the same indifference curve but at a point where the horizontal axis value is
greater than point D’s horizontal axis value.
19) Along an indifference curve
A) the marginal rate of substitution is constant but not equal to zero.
B) the consumer does not prefer one consumption point to another.
C) the marginal rate of substitution is equal to 0.
D) the consumer prefers some of the consumption points to others.
20) Except for perfect complements, an indifference curve has a ________ slope and becomes
________ moving to the right.
A) negative; flatter
B) negative; steeper
C) positive; flatter
D) positive; steeper
21) Except for perfect substitutes or perfect complements, indifference curves
A) are straight lines with a positive slope.
B) slope upward to the right.
C) are bowed in toward the origin.
D) are bowed out away from the origin.
22) All points above a given indifference curve are
A) inferior to any point on the indifference curve.
B) preferred to any point on the indifference curve.
C) definitely not affordable.
D) Both answers Band C are correct.
23) All points below a given indifference curve are
A) less preferred to any point on the indifference curve.
B) preferred to any point on the indifference curve.
C) definitely affordable.
D) Both answers A and C are correct.
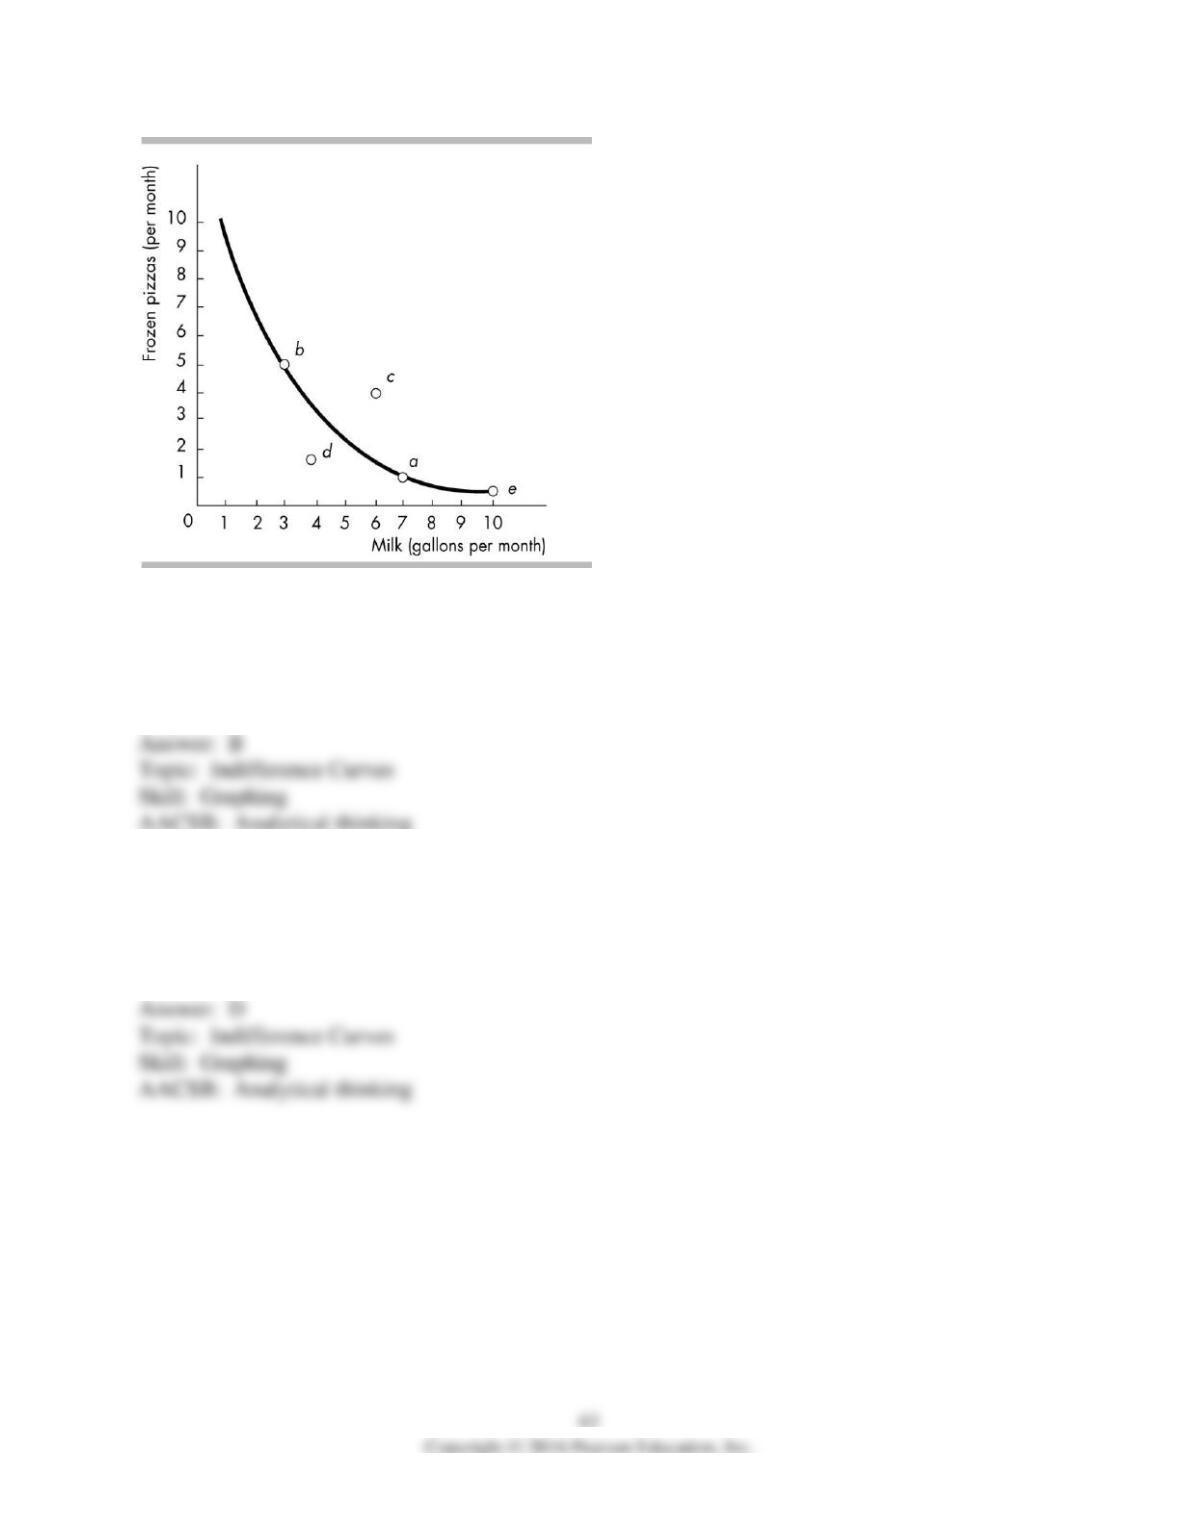
24) Given the indifference curve in the above figure, which point is preferred to point a?
A) point b
B) point c
C) point d
D) point e
25) The figure above shows a consumer is indifferent between points
A) d and c.
B) a, b, c, d, and e.
C) e and d.
D) b and a.
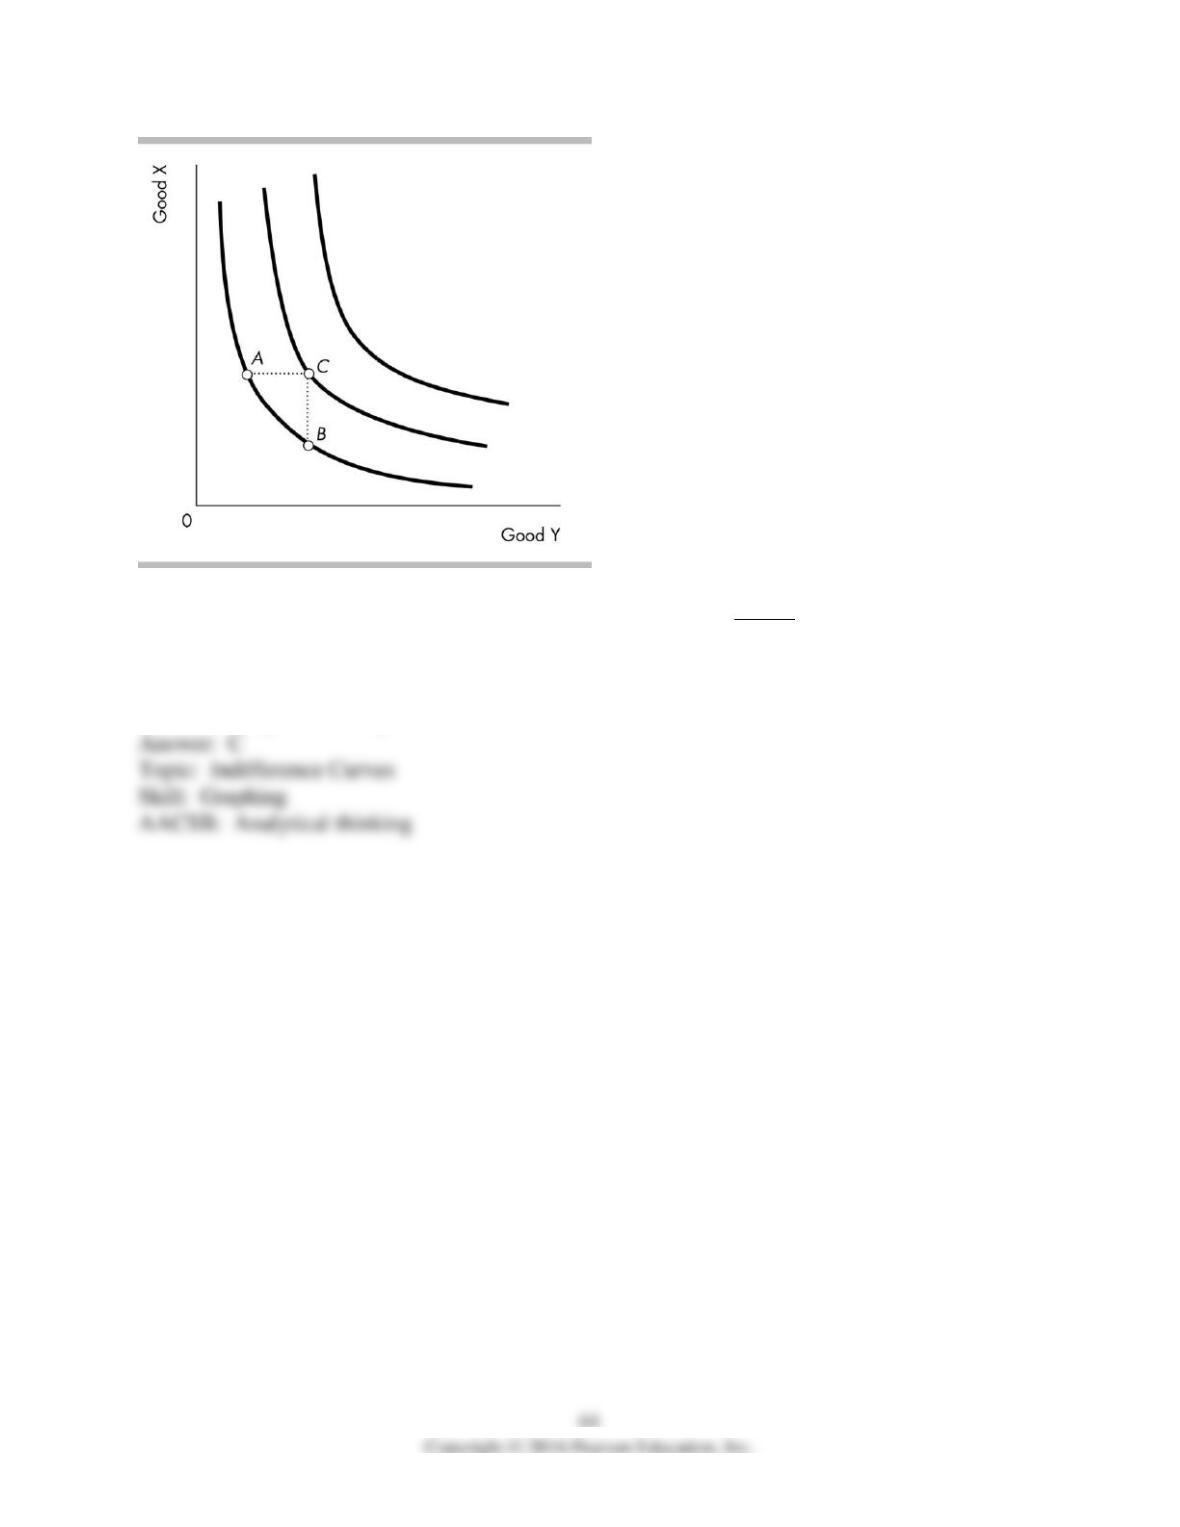
26) Which of the following statements about the above figure is TRUE?
A) Point A is equally preferred to point C.
B) Point B is equally preferred to point C.
C) Point C is preferred to point A.
D) Point A is preferred to point C.
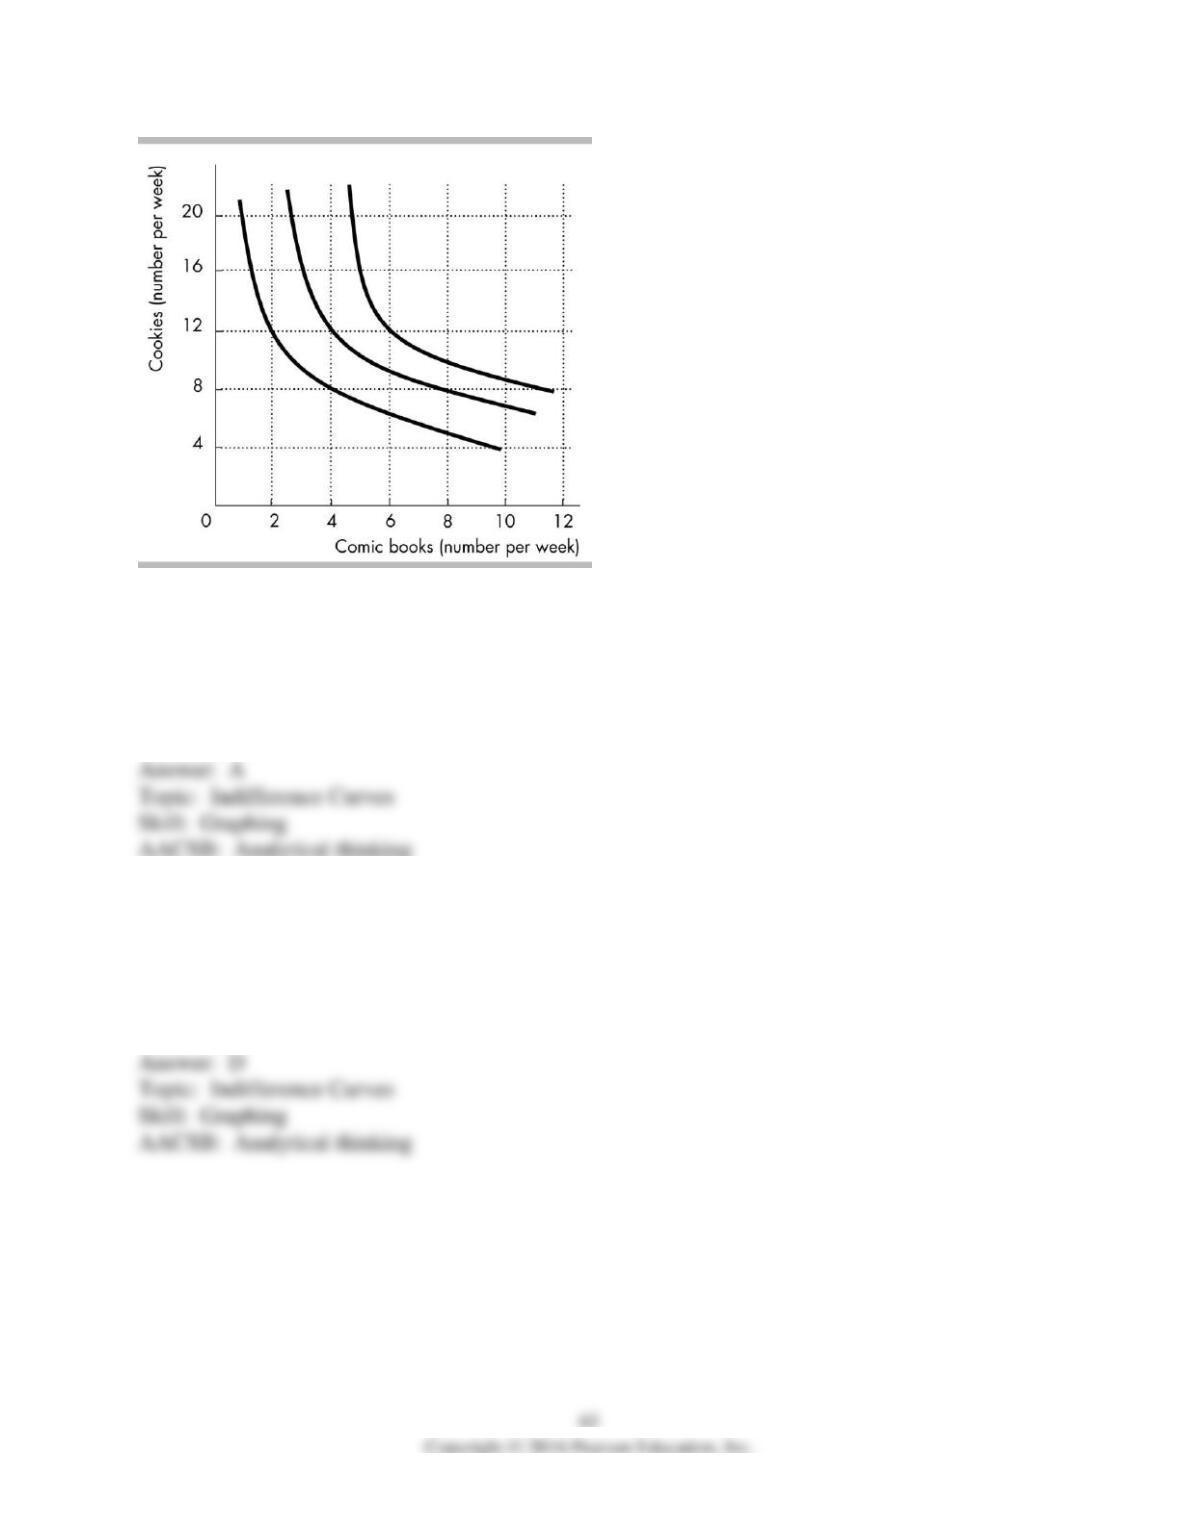
27) Lizzie’s preferences are shown in the figure above. Lizzie is just as happy to have ________
as she is to have ________.
A) 2 comic books and 12 cookies; 4 comic books and 8 cookies
B) 2 comic books and 12 cookies; 8 comic books and 8 cookies
C) 4 comic books and 8 cookies; 6 comic books and 12 cookies
D) 6 comic books and 6 cookies; 5 comic books and 13 cookies
28) Lizzie’s preferences are shown in the figure above. Lizzie is just as happy to have ________
as she is to have ________.
A) 4 comic books and 12 cookies; 6 comic books and 12 cookies
B) 2 comic books and 12 cookies; 11 comic books and 8 cookies
C) 2 comic books and 8 cookies; 3 comic books and 5 cookies
D) 4 comic books and 12 cookies; 8 comic books and 8 cookies
29) Lizzie’s preferences are shown in the figure above. Lizzie definitely prefers consuming
________ to consuming ________.
A) 1 comic book and 12 cookies; 4 comic books and 4 cookies
B) 2 comic books and 12 cookies; 4 comic books and 8 cookies
C) 4 comic books and 12 cookies; 2 comic books and 12 cookies
D) 6 comic books and 12 cookies; 8 comic books and 16 cookies
30) Lizzie’s preferences are shown in the figure above. Lizzie definitely prefers consuming
________ to consuming ________.
A) 2 comic books and 12 cookies; 8 comic books and 8 cookies
B) 8 comic books and 8 cookies; 10 comic books and 4 cookies
C) 2 comic books and 12 cookies; 4 comic books and 8 cookies
D) 8 comic books and 16 cookies; 10 comic books and 4 cookies
31) Lizzie’s preferences are shown in the figure above. Which of the following combinations of
goods does Lizzie prefer the most?
A) 6 comic books and 20 cookies
B) 8 comic books and 8 cookies
C) 12 comic books and 10 cookies
D) 4 comic books and 12 cookies
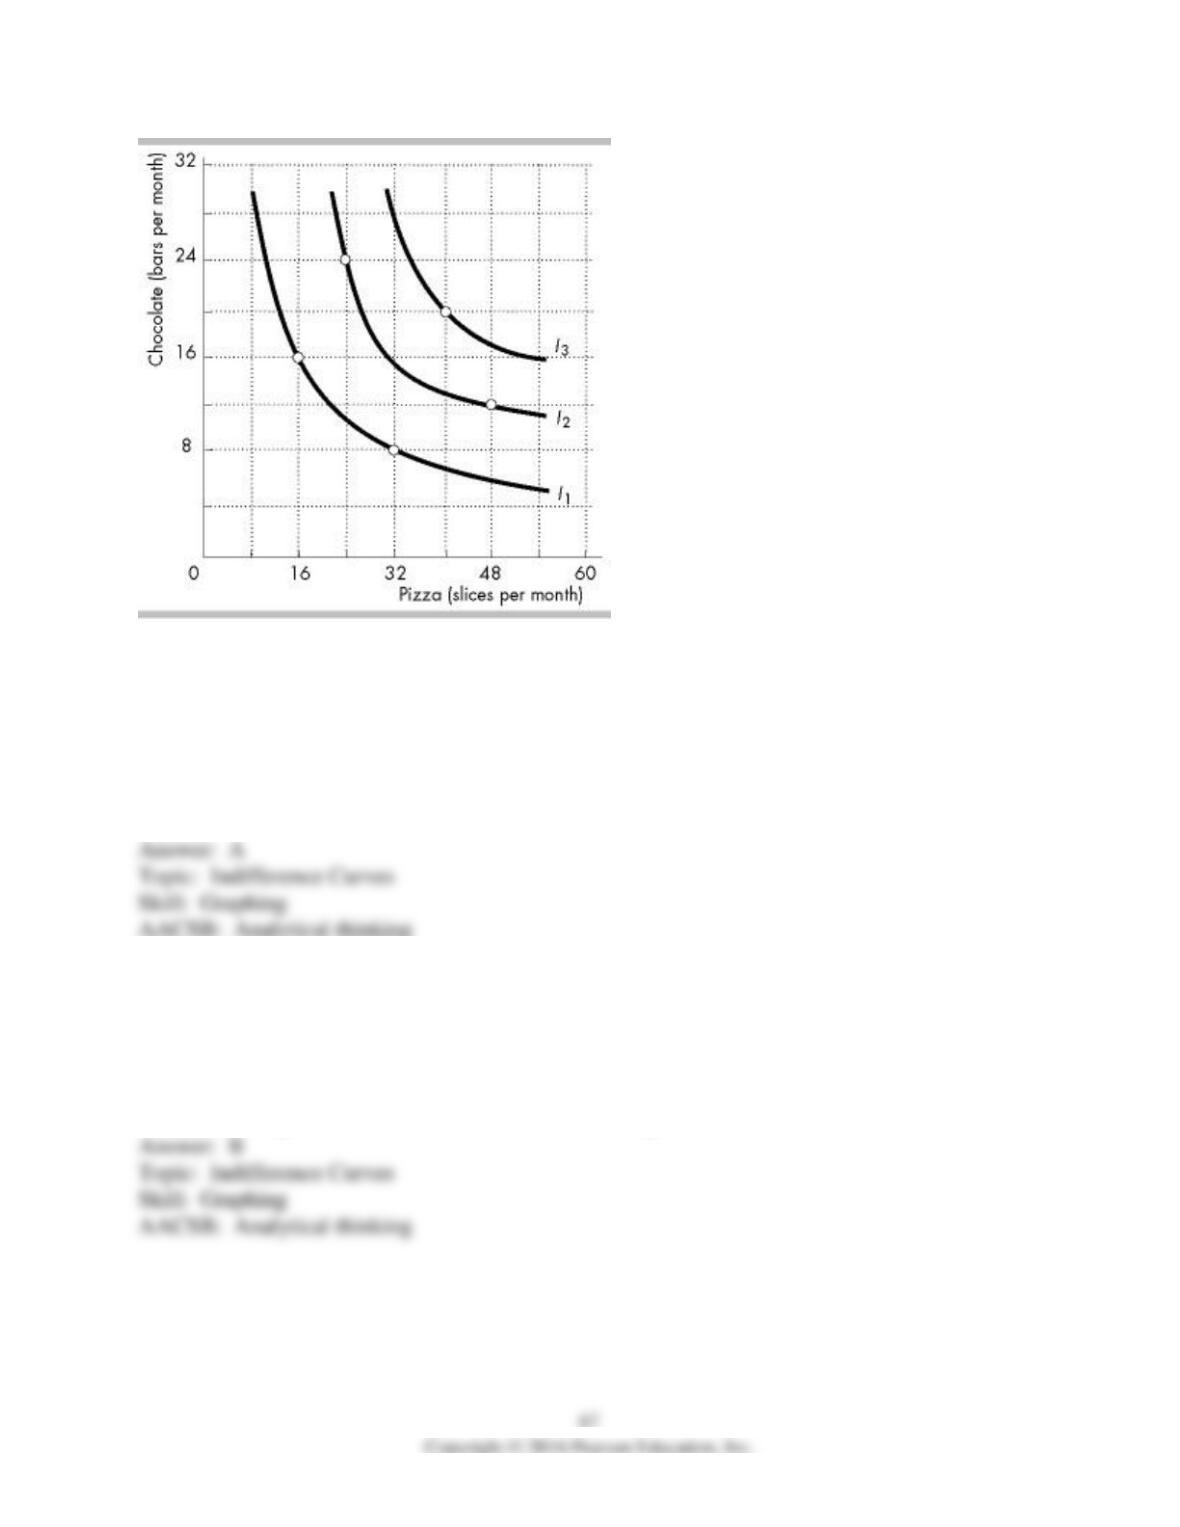
32) The indifference curves in the figure above (I1, I2, and I3) reflect Peter’s consumption
preferences. If Peter consumes 24 slices of pizza and 24 chocolate bars per month, he as satisfied
as he would be consuming ________ slices of pizza and ________ chocolate bars per month.
A) 48; 12
B) 40; 20
C) 32; 8
D) 16; 16
33) The indifference curves in the figure above (I1, I2, and I3) reflect Peter’s consumption
preferences. Peter prefers consuming ________ to consuming ________.
A) 48 slices of pizza and 12 chocolate bars; 24 slices of pizza and 24 chocolate bars
B) 40 slices of pizza and 20 chocolate bars; 48 slices of pizza and 12 chocolate bars
C) 24 slices of pizza and 24 chocolate bars; 40 slices of pizza and 20 chocolate bars
D) 32 slices of pizza and 8 chocolate bars; 16 slices of pizza and 16 chocolate bars
34) The indifference curves in the figure above (I1, I2, and I3) reflect Peter’s consumption
preferences. Which of the following combinations of goods does Peter prefer the most?
A) 48 slices of pizza and 12 chocolate bars
B) 24 slices of pizza and 24 chocolate bars
C) 40 slices of pizza and 20 chocolate bars
D) 32 slices of pizza and 8 chocolate bars
35) The rate at which Sam is willing to give up a gallon of gasoline to get one more pound of
coffee, and remain on the same indifference curve is called his
A) opportunity cost of coffee.
B) opportunity cost of gasoline.
C) personal price of coffee.
D) marginal rate of substitution.
36) The marginal rate of substitution is
A) the rate at which the consumer will give up one good to get an additional unit of another good
while remaining on the same indifference curve.
B) the rate at which utility increases as the consumer increases purchases of a good, holding
purchases of the other good constant.
C) the rate at which a consumer will exchange a good for income holding prices constant.
D) None of the above answers is correct.
37) The rate at which a person is willing to give up a gallon of gasoline to get one more pound of
coffee and remain on the same indifference curve is called his or her
A) relative cost of coffee in terms of gasoline.
B) indifference cost of coffee.
C) personal price of coffee.
D) marginal rate of substitution.
38) The marginal rate of substitution is equal to the ________.
A) marginal cost of each good
B) magnitude of the slope of the indifference curve
C) inverse of the slope of the budget line
D) relative price of the two goods
39) The magnitude of the slope of an indifference curve
A) is equal to the marginal rate of substitution.
B) always equals the relative price of the product measured along the horizontal axis.
C) increases as income increases.
D) decreases when income increases.
40) The magnitude of the slope of an indifference curve is the marginal
A) rate of substitution.
B) rate of relative prices.
C) utility of substitution.
D) rate of utility of income.
41) The marginal rate of substitution is equal to the
A) slope of the demand curve.
B) marginal cost of each good.
C) magnitude of the slope of the indifference curve.
D) relative prices of the two goods.
42) In an indifference curve diagram, the quantities of good Y are measured along the vertical
axis and the quantities of good X are measured along the horizontal axis. The marginal rate of
substitution is defined as
A) how much good Y you must give up to get one more unit of good X.
B) how much good Y you are willing to give up to get one more unit of good X.
C) the relative price of good Y in terms of good X.
D) how much you prefer to substitute good X for good Y.
43) An indifference diagram has movies on the vertical axis and sodas on the horizontal axis. As
the consumption of sodas increases, the marginal rate of substitution ________ and the
indifference curve becomes ________.
A) falls; flatter
B) falls; steeper
C) rises; flatter
D) rises; steeper
44) Jodie has indifference curves for CDs and colas, with CDs on the vertical axis. The flatter
her indifference curves are, the
A) smaller her average rate of substitution.
B) larger her average rate of substitution.
C) smaller her marginal rate of substitution.
D) larger her marginal rate of substitution.
45) Bobby moves along an indifference curve for shirts and pants by increasing consumption of
shirts and decreasing consumption of pants. As Bobby has more and more pants, the number of
shirts he is willing to trade for yet another pair of pants
A) decreases.
B) increases.
C) does not change.
D) initially decreases and then increases.
46) As Sam moves rightward along his indifference curve, his marginal rate of substitution
A) is diminishing.
B) is increasing.
C) remains constant.
D) shows the change in his income.
47) Which of the following statements about the marginal rate of substitution is NOT correct?
A) It measures the number of units of the good on the horizontal axis that a consumer must be
compensated with to give up a unit of the good on the vertical axis, while remaining on the same
indifference curve.
B) It is measured by the slope of the indifference curve.
C) It decreases in value when moving downward along a typical-shaped indifference curve.
D) It is constant for goods that are perfect substitutes.
48) The marginal rate of substitution is ________, the ________ is the ________.
A) greater; flatter; indifference curve
B) greater; steeper; budget line
C) smaller; steeper; indifference curve
D) smaller; flatter; indifference curve
49) As a consumer moves along an indifference curve and decreases consumption of the good on
the x-axis, the consumer needs ________ of the good on the y-axis to give up an additional unit
of the good on the x-axis.
A) less and less
B) more and more
C) none
D) a constant amount
50) The assumption that the magnitude of the slope of an indifference curve decreases moving to
the right along the indifference curve is known as the assumption of
A) the price effect.
B) a diminishing marginal rate of substitution.
C) an increasing marginal rate of substitution.
D) an indifference curve effect.
51) An indifference curve diagram has movies on the vertical axis and sodas on the horizontal.
As the consumption of sodas increases and movies decreases (moving southeast along an
indifference curve) the marginal rate of substitution of sodas for movies
A) rises.
B) falls.
C) does not change.
D) probably changes, but more information is needed to determine if it rises or falls.
52) The concept of diminishing marginal rate of substitution indicates that
A) as the consumption of good X increases, individuals are willing to give up an increasing
amount of good Y in order to obtain one more unit of good X.
B) as the consumption of good X increases, individuals are willing to give up a decreasing
amount of good Y in order to obtain one more unit of good X.
C) along an indifference curve, a consumer prefers the consumption combinations moving to the
northwest along the curve.
D) None of the above answers is correct.
53) Indifference curves are
A) bowed in toward the origin if there is diminishing marginal rate of substitution.
B) straight lines if the goods are perfect complements.
C) right angles if the goods are perfect substitutes.
D) always bowed out and away from the origin.
54) If an indifference curve is a straight line it will not show which of the following?
A) any marginal rate of substitution
B) diminishing marginal rate of substitution
C) combinations of goods among which a consumer is indifferent
D) None of the above answers is correct.
55) If your marginal rate of substitution between two goods diminishes continuously as you give
up one good for the other, that means the
A) price per unit of one good declines when you buy it in larger and larger quantities.
B) two goods are perfect substitutes.
C) two goods are perfect complements.
D) two goods are neither perfect substitutes nor perfect complements.
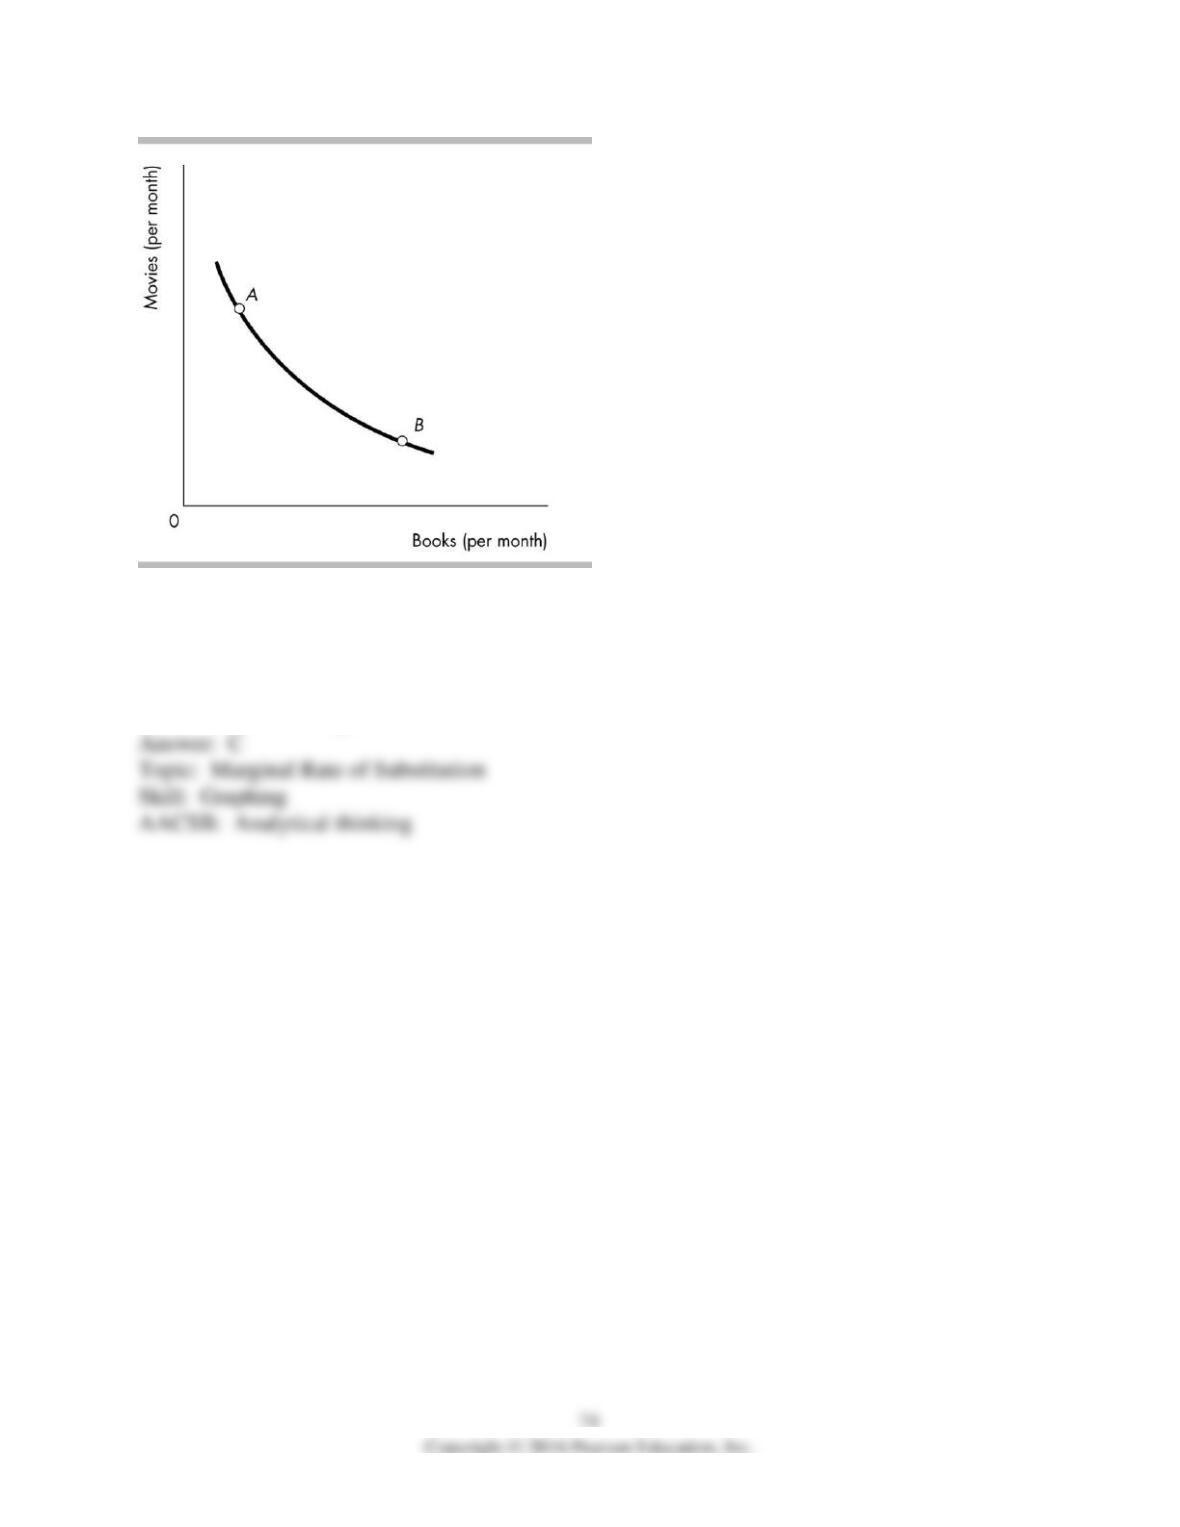
56) In the figure above, the MRS at point A is ________ the MRS at point B.
A) equal to
B) less than
C) greater than
D) not able to be compared to
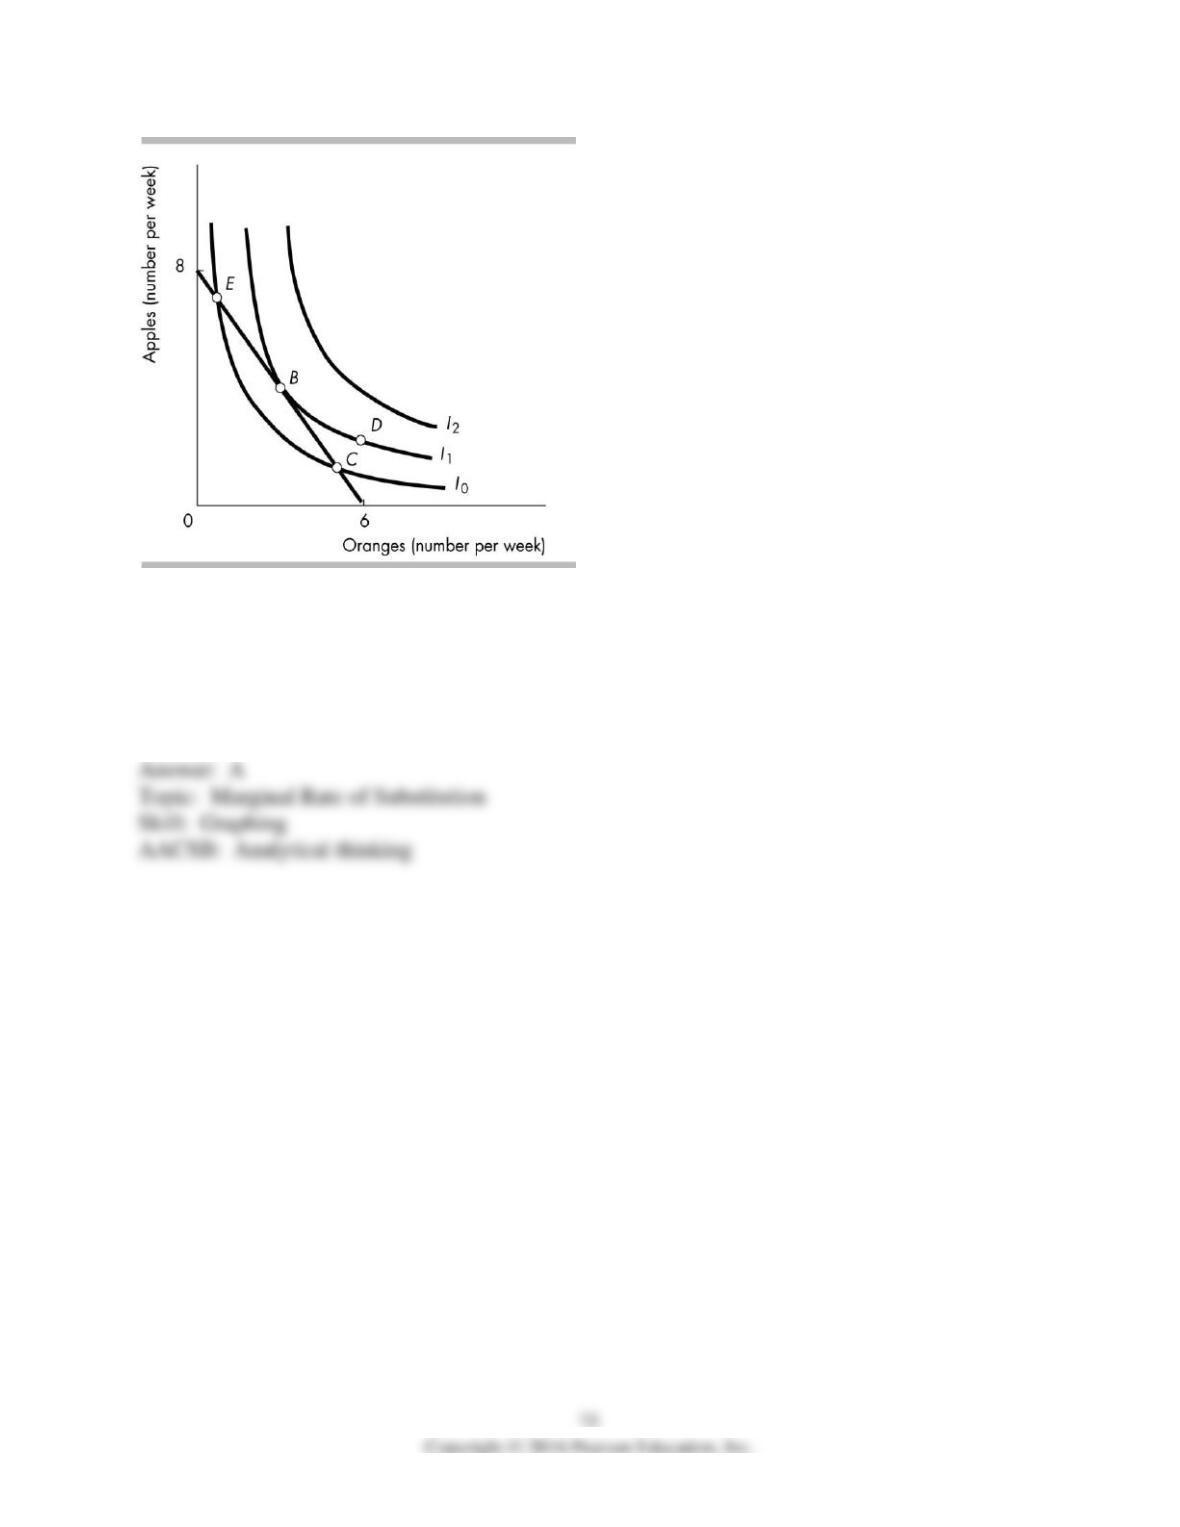
57) The figure illustrates Sally’s budget line and her preferences. At point(s) ________, the
marginal rate of substitution is equal to the relative price.
A) B
B) B, C, and E
C) D
D) E and C
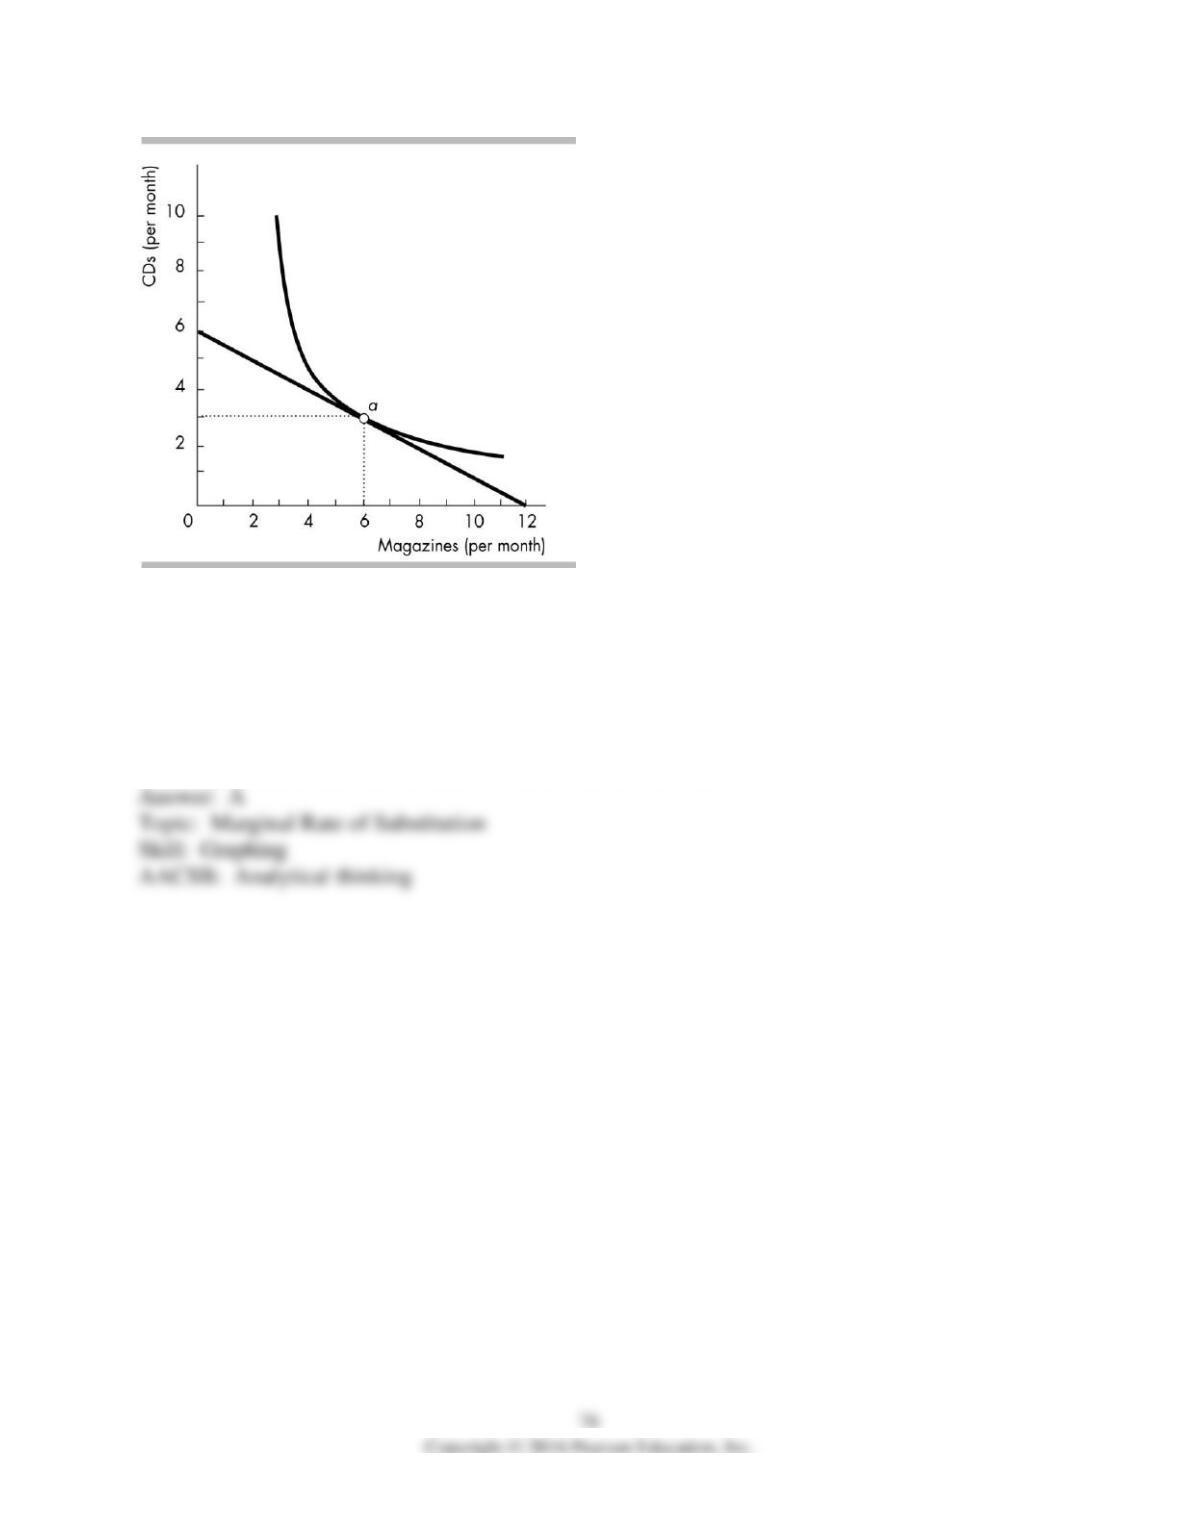
58) In the above figure, what is the magnitude of the marginal rate of substitution (MRS) at point
a?
A) 1/2
B) the rate at which the consumer will give up magazines to purchase more CDs while preferring
the new combination to the old
C) 2
D) The question cannot be answered without more information.
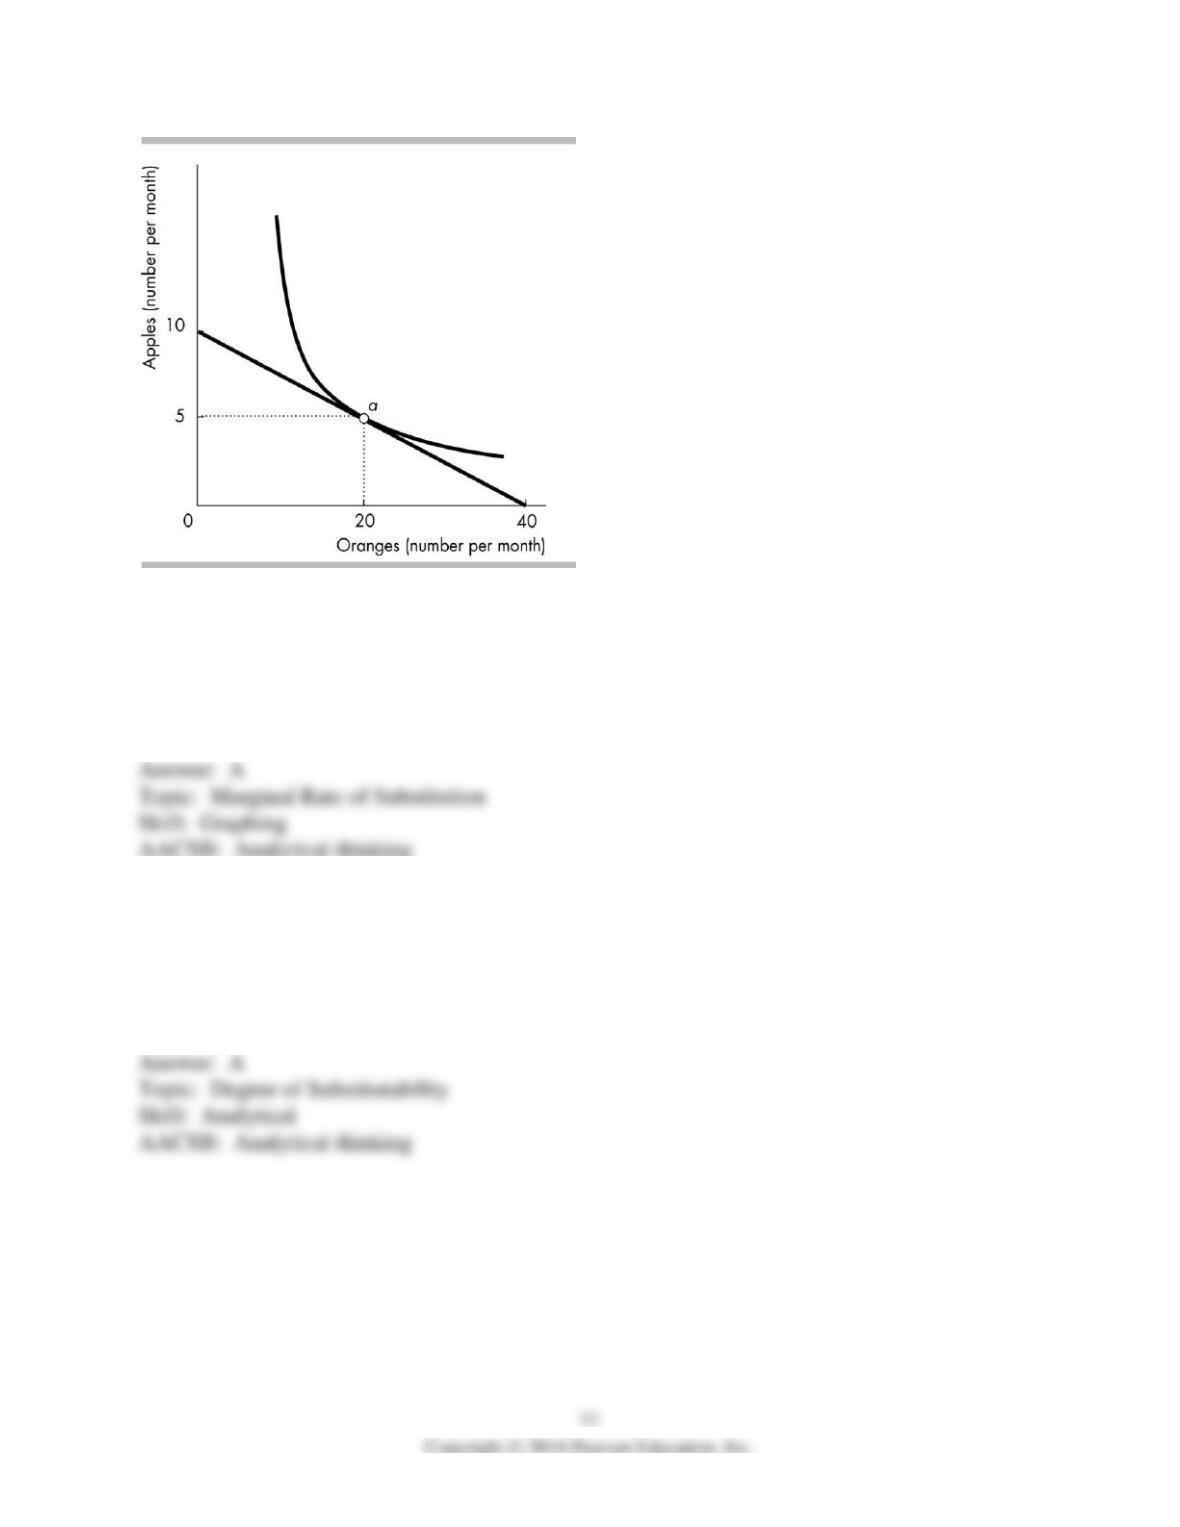
59) The figure above shows Sally’s budget line and one of her indifference curves. At point a,
Sally’s marginal rate of substitution is ________.
A) 1/4
B) 4
C) 10
D) 40
60) If an indifference map for a consumer is made up of straight, negatively sloped lines, the
marginal rate of substitution ________ as more of the good on the horizontal axis is consumed.
A) does not diminish
B) diminishes
C) increases
D) More information is needed to answer the question.
61) The more closely substitutable are two goods, the
A) more normal looking is the indifference curve for the two items.
B) more closely the indifference curve for these two items approximates a straight line.
C) more tightly curved is the indifference curve for these items.
D) None of the above answers is correct.
62) If green bikes and brown bikes are perfect substitutes, the corresponding indifference curves
A) are horizontal.
B) intersect each other.
C) are vertical.
D) have constant slope.
63) For goods and services that are perfect substitutes, the consumer’s indifference curves are
________ lines.
A) straight, negatively sloped
B) L-shaped
C) negatively sloped, bowed-outward
D) negatively sloped, bowed-inward
64) An indifference curve will become ________ the origin the more that the consumer
considers the two goods as substitutes.
A) less bowed-in towards
B) more bowed-in towards
C) less bowed-out from
D) more bowed-out from
65) An indifference curve will become ________ the origin the more that the consumer
considers the two goods as complements.
A) more bowed-in towards
B) less bowed-in towards
C) less bowed-out from
D) more bowed-out from
66) A constant marginal rate of substitution between two goods implies that they are
A) perfect complements.
B) perfect substitutes.
C) independent goods.
D) unattainable.
67) If two goods are perfect complements, the shapes of the indifference curves are
A) bowed toward the origin.
B) bowed away from the origin.
C) straight lines.
D) right-angled lines.
68) If an indifference map for a consumer is made up of straight, negatively sloped lines, the
goods are
A) perfect complements.
B) unrelated.
C) perfect substitutes.
D) not desirable.
69) If Bill thinks tacos and turkey sandwiches are perfect substitutes, then his indifference curves
for these two goods
A) are L-shaped.
B) are negatively sloped and linear.
C) are positively sloped and linear.
D) have slopes equal to 1.
70) Which two goods will most likely have indifference curves that are straight lines?
A) blue and red balloons
B) left and right shoes
C) pizza and hair spray
D) beef and chicken
71) Left shoes and right shoes are perfect complements. An indifference curve for left and right
shoes is a line with
A) constant slope.
B) a 30-degree angle.
C) a 45-degree angle.
D) a 90-degree angle.
72) A recent article suggests that the introduction of the new iPhone 6 increased the demand for
iPhone protective cases. The article suggests that these two goods are
A) substitutes and their indifference curves are close to being straight lines.
B) complements and their indifference curves are close to being straight lines.
C) substitutes and their indifference curves are close to being L shaped.
D) complements and their indifference curves are close to being L shaped.