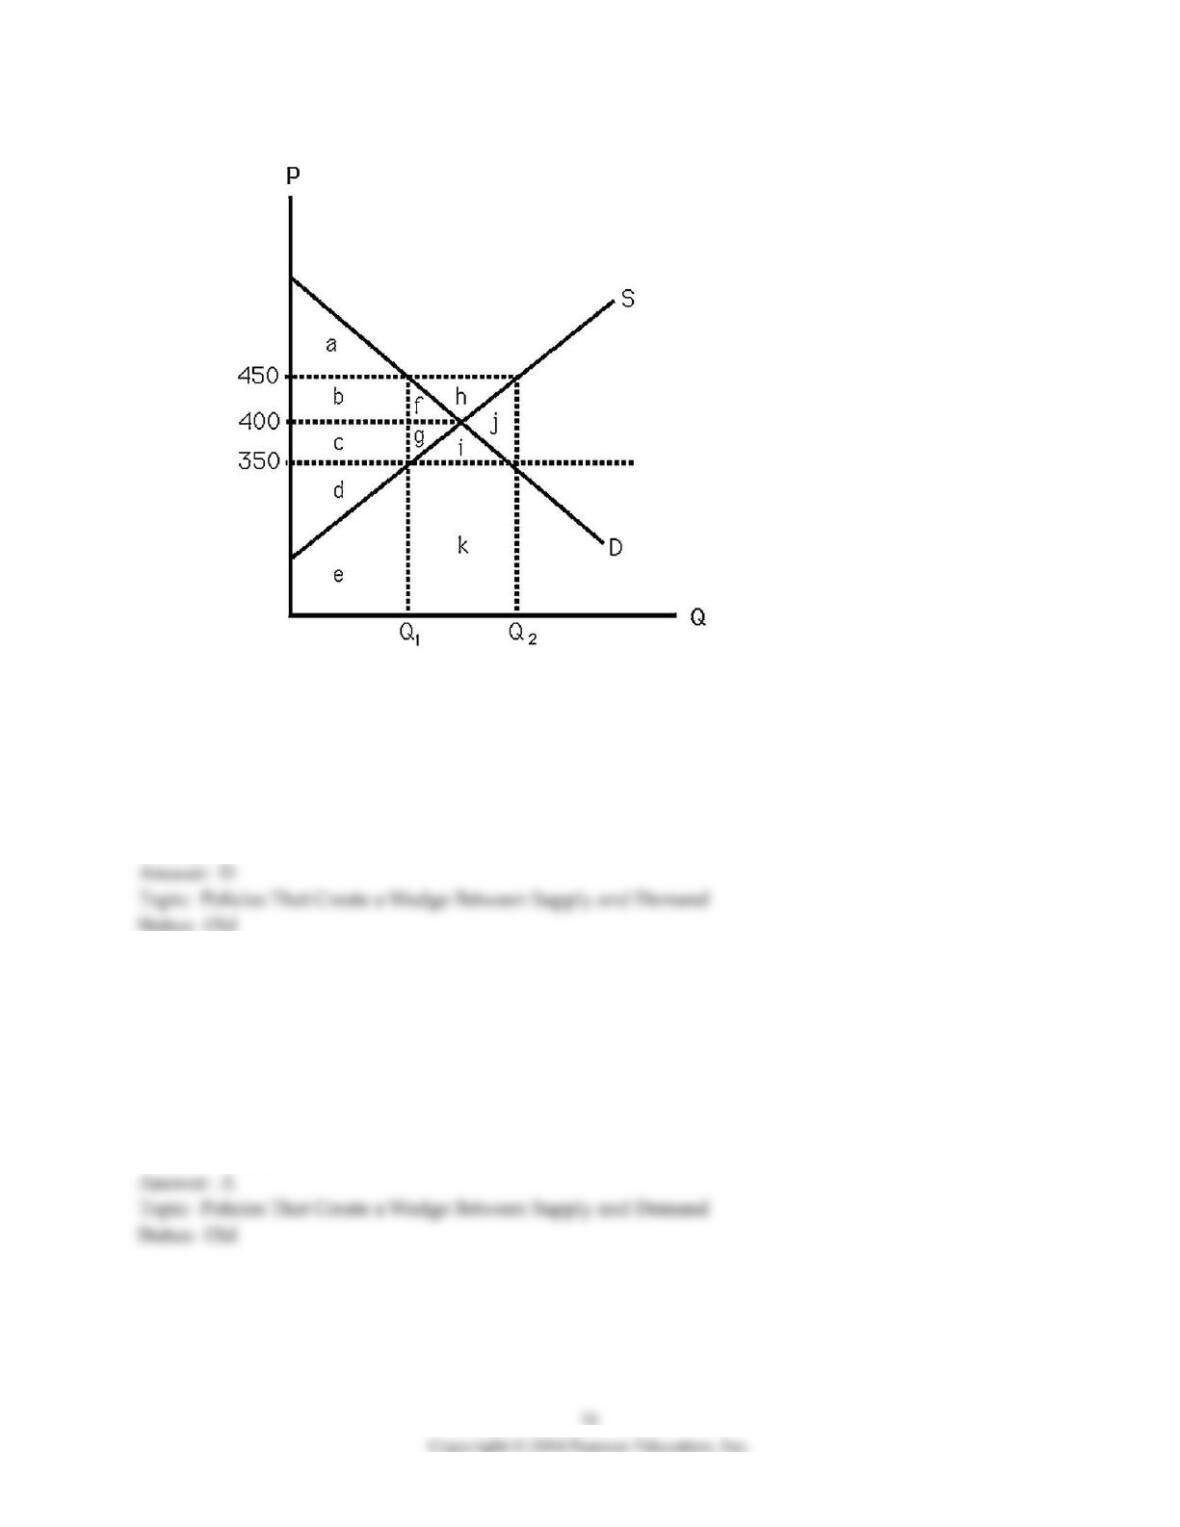
3) The above figure shows supply and demand curves for apartment units in a large city. If the city
government passes a law that establishes $350 per month as the legal maximum rent, the loss in social
welfare equals
A) b + c.
B) f.
C) a.
D) f + g.
4) The above figure shows supply and demand curves for apartment units in a large city. If the city
government passes a law that establishes $350 per month as the legal maximum rent, deadweight loss
occurs because
A) consumers place a greater value on the last apartment unit than the cost to supply it.
B) the supplier of the last apartment unit receives a rental price that is less than the marginal cost of
supplying it.
C) the quantity of apartments supplied has decreased.
D) All of the above.
5) The above figure shows supply and demand curves for apartment units in a large city. If the city
government passes a law that establishes $350 per month as the legal maximum rent, the consumer’s net
gain in surplus equals
A) c – f.
B) b – f.
C) d – f.
D) The answer cannot be determined from the information given.
6) The above figure shows supply and demand curves for apartment units in a large city. If the city
government passes a law that establishes $350 per month as the legal maximum rent, producer surplus
A) increases.
B) decreases.
C) stays the same.
D) changes in a direction that cannot be determined from the information given.
7) The above figure shows supply and demand curves for apartment units in a large city. If the city
government passes a law that establishes $350 per month as the legal maximum rent, producer surplus
decreases by
A) d.
B) b + f.
C) c + g.
D) i.
8) The above figure shows supply and demand curves for apartment units in a large city. If the city
government passes a law that establishes $350 per month as the legal maximum rent, producer surplus
will be
A) d.
B) d + e.
C) d + g.
D) d + c + g.
9) The above figure shows supply and demand curves for apartment units in a large city. If the city
government passes a law that establishes $350 per month as the legal maximum rent, consumer surplus
will be
A) a.
B) a + b + f.
C) a + b + c.
D) a + b + c + f + g.
10) The above figure shows supply and demand curves for apartment units in a large city. If the city
government passes a law that establishes $450 per month as the legal maximum rent, consumer surplus
will be
A) a.
B) a + b + f.
C) a + b + c.
D) a + b + c + f + g.
11) The above figure shows supply and demand curves for apartment units in a large city. At the
unregulated equilibrium, producer surplus will be
A) d.
B) d + e.
C) d + g.
D) d + c + g.
12) The above figure shows supply and demand curves for apartment units in a large city. The area “e”
represents
A) the loss in producer surplus if a rent ceiling of $350 is imposed.
B) the total variable cost of supplying Q1 units.
C) the marginal cost of supplying Q1 units.
D) the total revenue received by supplying Q1 units.
13) The above figure shows supply and demand curves for apartment units in a large city. The area “c”
represents
A) the loss in consumer surplus if a rent ceiling of $350 is imposed.
B) a transfer from producers to consumers if a rent ceiling of $350 is imposed.
C) a transfer from consumers to producers if a rent ceiling of $350 is imposed.
D) the total revenue received by supplying Q1 units.
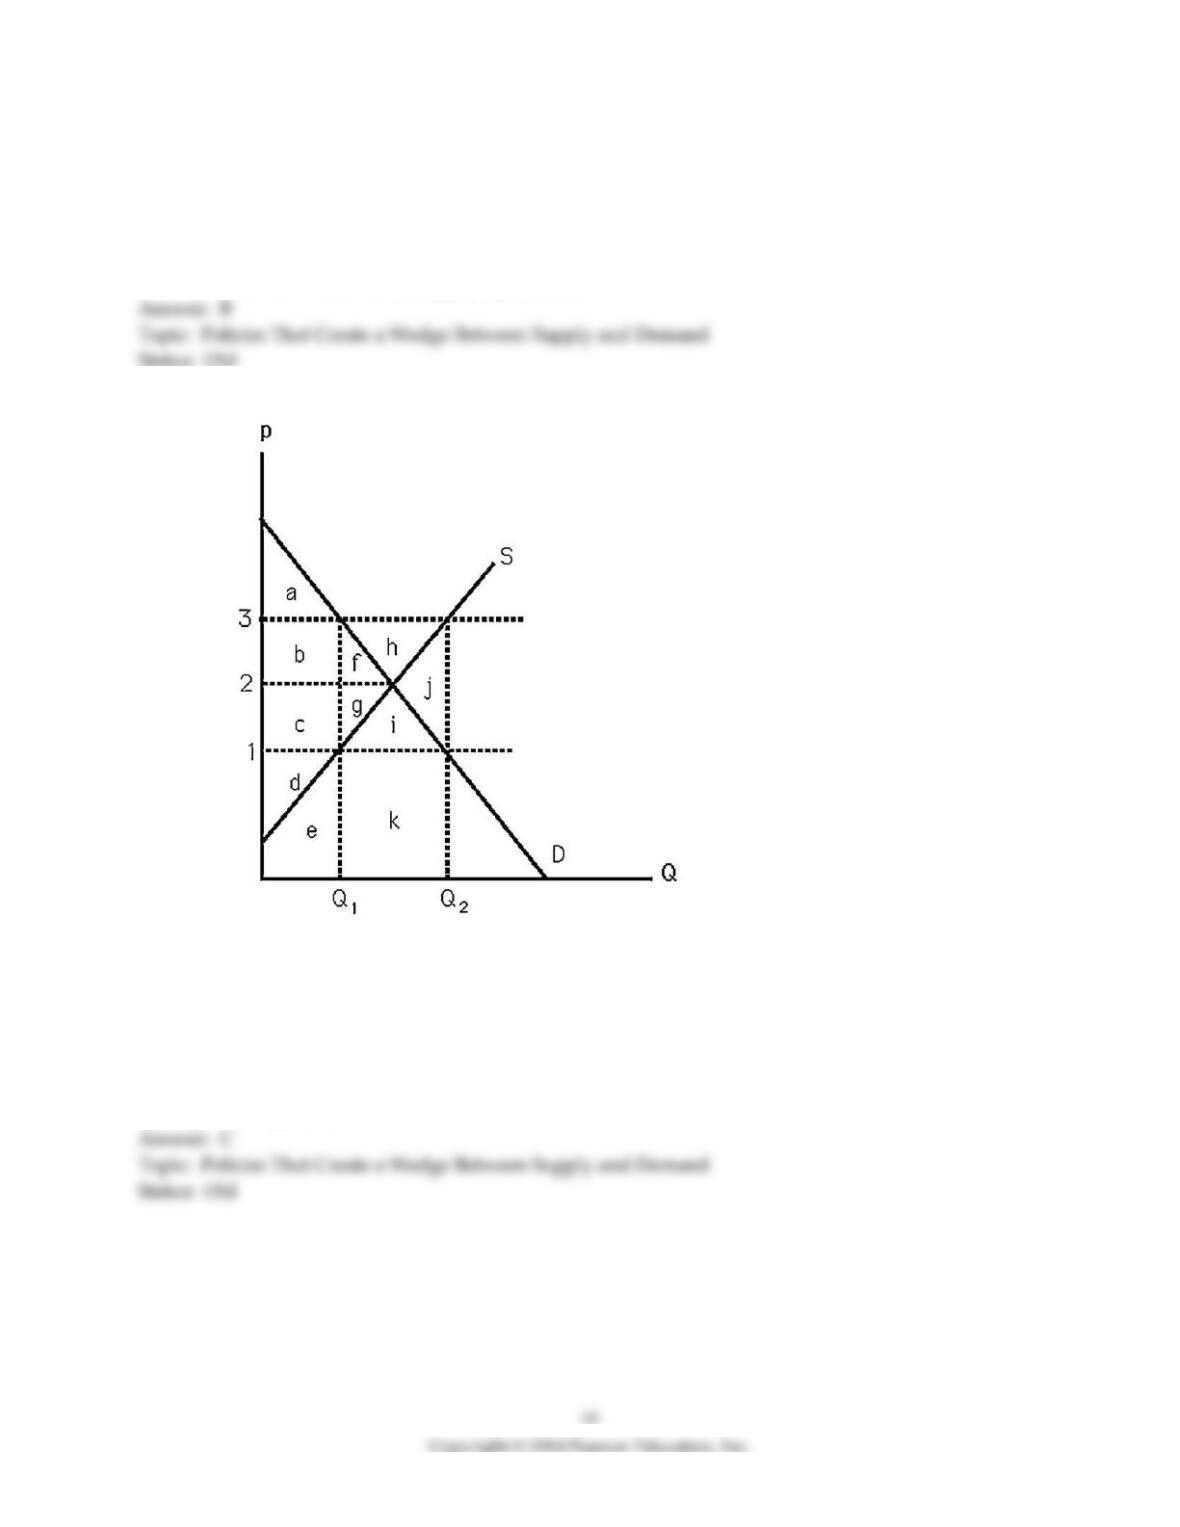
14) The above figure shows supply and demand curves for milk. In an effort to help farmers, the
government passes a law that establishes a $3 per gallon price support. To maintain the price support,
government expenditures must equal
A) k + i.
B) f + g + h + i + j.
C) f + g + h + i + j + k.
D) f + g + h + i + j + k + e.
15) The above figure shows supply and demand curves for milk. If amount Q2 is produced in the market
A) producer surplus is maximized.
B) consumer surplus is minimized.
C) a deadweight loss is generated.
D) All of the above.
16) The above figure shows supply and demand curves for milk. In an effort to help farmers, the
government passes a law that establishes a $3 per gallon price support. To maintain the price support,
government must purchase
A) Q1 gallons.
B) Q2 gallons.
C) Q1 – Q2 gallons.
D) Q2 – Q1 gallons.
17) The above figure shows supply and demand curves for milk. In an effort to help farmers, the
government passes a law that establishes a $3 per gallon price support. As a result, consumer surplus
falls by
A) a.
B) b + f.
C) f + g.
D) b + f – c.
18) The above figure shows supply and demand curves for milk. In an effort to help farmers, the
government passes a law that establishes a $3 per gallon price support. The loss in social welfare
resulting from this price support equals
A) k + i.
B) j.
C) [$3 ∗ (Q2 – Q1)] – h.
D) $3 ∗ k.
19) The above figure shows supply and demand curves for milk. If the government passes a law that
establishes $3 per month as the legal minimum per gallon price, consumer surplus will be
A) a.
B) a + b + f.
C) a + b + c.
D) c + d + g.
20) The above figure shows supply and demand curves for milk. If the government passes a law that
establishes $3 per month as the legal minimum per gallon price, change in producer surplus will be
A) b + c + d.
B) b – f – g.
C) c + d + g.
D) b – g.
21) The above figure shows supply and demand curves for milk. If the government passes a $2 per gallon
specific tax, the loss in social welfare will equal
A) b + c + f + g.
B) f + g.
C) b + f.
D) c + g.
22) The above figure shows supply and demand curves for milk. If the government passes a $2 per gallon
specific tax, the loss in consumer surplus will equal
A) b + c + f + g.
B) f + g.
C) b + f.
D) c + g.
23) The above figure shows supply and demand curves for milk. If the government passes a $2 per gallon
specific tax, the loss in producer surplus will equal
A) b + c + f + g.
B) f + g.
C) b + f.
D) c + g.
24) The above figure shows supply and demand curves for milk. If the government passes a $2 per gallon
specific tax, the tax revenue is
A) $2 ∗ Q1.
B) $2 ∗ Q2.
C) $2 ∗ (Q2 – Q1).
D) $2.
For the following, please answer “True” or “False” and explain why.
25) A per unit subsidy increases both consumer and producer surplus, but results in a deadweight loss.
26) The tax revenue that is generated by a government tax is counted towards total welfare.
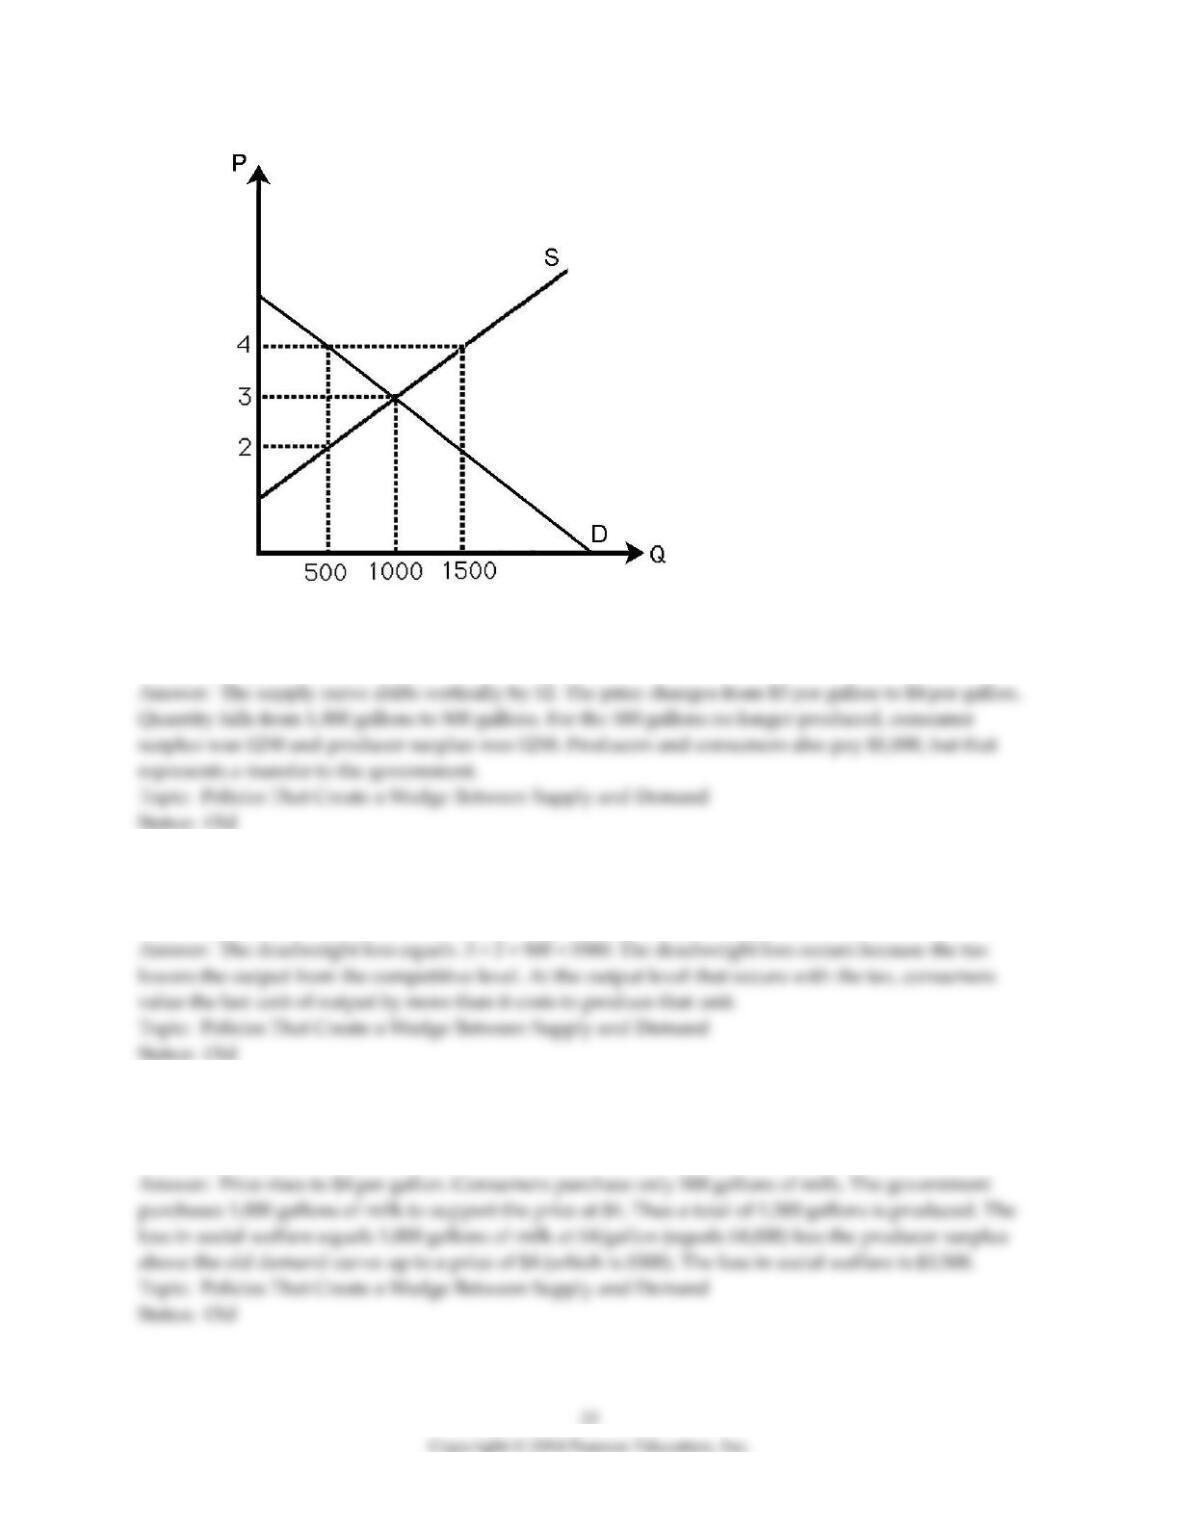
27) The above figure shows the demand and supply curves in the market for milk. Currently the market
is in equilibrium. If the government imposes a $2 per gallon tax to be collected from sellers, estimate the
change in p, Q, and social welfare.
28) The above figure shows the demand and supply curves in the market for milk. Currently, the market
is in equilibrium. If the government imposes a $2 per gallon tax to be collected from sellers, calculate the
dead weight loss associated with the tax, and explain why the dead weight loss occurs.
29) The above figure shows the demand and supply curves in the market for milk. Currently the market
is in equilibrium. If the government establishes a $4 per gallon price support, estimate the change in p, Q,
and social welfare.
30) The above figure shows the demand and supply curves in the market for milk. Currently the market
is in equilibrium. If the government establishes a $2 per gallon price ceiling to ensure that children are
nourished, estimate the change in p, Q, and social welfare.
9.6 Comparing Both Types of Policies: Trade
1) The larger the U.S. imposed per unit import tariff on a good imported and produced in the U.S.,
A) the smaller the U.S. consumer surplus.
B) the larger the U.S. producer surplus.
C) the larger the government revenue.
D) All of the above.
2) A ban on imports, a tariff, or a quota raises the price to domestic consumers. This means that
consumers will buy less of the product at a higher price. The loss associated with this is called
A) production associated loss.
B) productive consumption loss.
C) consumption distortion loss.
D) consumer misperception loss.
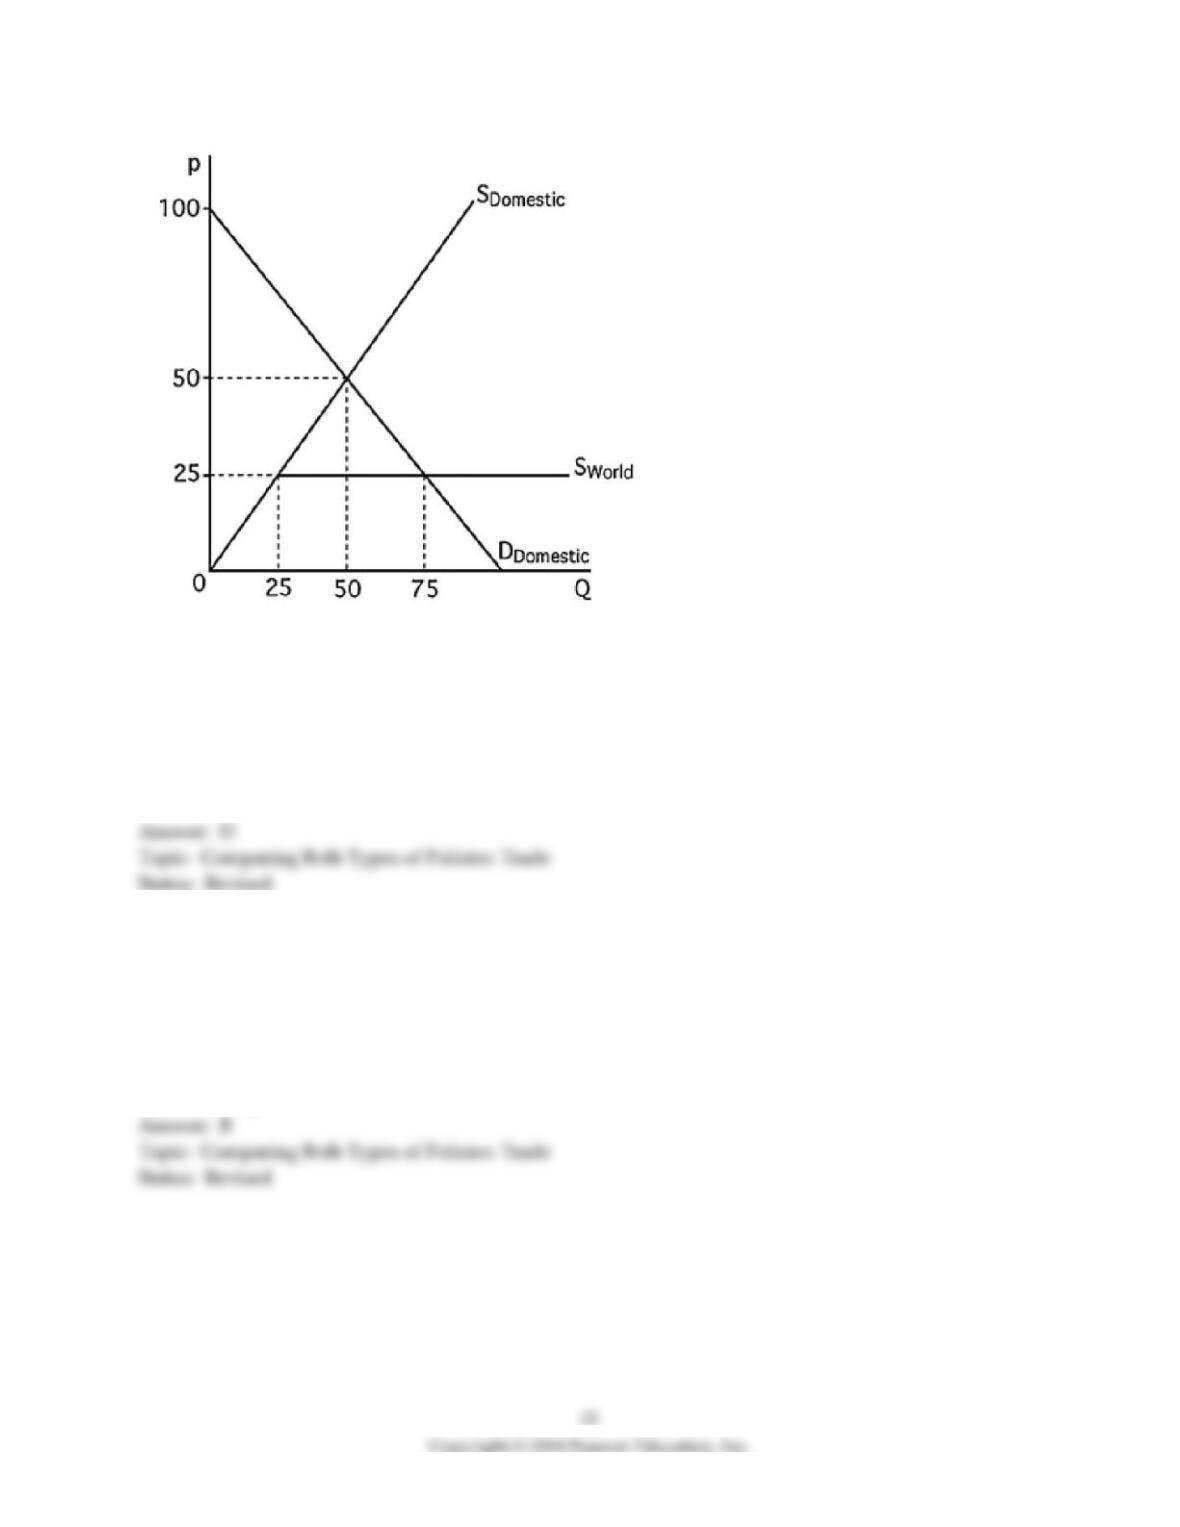
3) The above figure shows the market for rice in Japan. SDomestic represents the domestic supply curve,
and Sworld represents the world supply curve. If imported rice is banned, the loss in social welfare is
A) a + b + c + d + i + j.
B) a.
C) c + e.
D) a + b + c + d.
4) The above figure shows the market for rice in Japan. SDomestic represents the domestic supply curve,
and Sworld represents the world supply curve. If imported rice is banned, the consumption distortion
loss is equal to
A) a + b + c + d.
B) a + b + c + d + f + g.
C) f + g.
D) a + c + f + g.
5) The above figure shows the market for rice in Japan. SDomestic represents the domestic supply curve,
and Sworld represents the world supply curve. If imported rice is banned, the change in domestic
producer surplus equals
A) f.
B) f + g.
C) f + g + h.
D) h.
6) The above figure shows the market for rice in Japan. SDomestic represents the domestic supply curve,
and Sworld represents the world supply curve. If a $1 tariff is imposed on imported rice, the change in
consumer surplus is
A) c + d.
B) c + d +g.
C) a + b + c + d.
D) f + g.
7) The above figure shows the market for rice in Japan. SDomestic represents the domestic supply curve,
and Sworld represents the world supply curve. If a $1 per unit tariff is imposed on imported rice, the
quantity of imported rice will decrease by
A) 15 units.
B) 25 units.
C) 35 units.
D) 50 units.
8) The above figure shows the market for rice in Japan. SDomestic represents the domestic supply curve,
and Sworld represents the world supply curve. An import quota of 35 units would
A) cause consumer surplus to fall by “g.”
B) cause social welfare to fall by $35.
C) increase domestic producer surplus by “g.”
D) have no effect.
9) The above figure shows the market for rice in Japan. SDomestic represents the domestic supply curve,
and Sworld represents the world supply curve. The smallest tariff necessary to completely eliminate
imported rice is
A) $1 per unit.
B) $25 per unit.
C) $50 per unit.
D) Not enough information.
10) The above figure shows the market for rice in Japan. SDomestic represents the domestic supply curve,
and Sworld represents the world supply curve. A $1 per unit tariff has the same effect on producer and
consumer surplus as a quota of
A) 25 units.
B) 30 units.
C) 35 units.
D) 65 units.
11) Tariffs and quotas create a loss in social welfare because
A) producer surplus declines.
B) revenues from tariffs are misspent.
C) consumer surplus declines.
D) All of the above.
12) The welfare loss from an import quota is greater than that of an equivalent tariff because
A) tariff revenues can be used to society’s benefit.
B) the loss in consumer surplus is not as large.
C) domestic producers gain more from a quota than from a tariff.
D) tariff revenues represent an additional deadweight loss.
13) The cost of lobbying for an import quota in a perfectly competitive market
A) increases the welfare loss of the quota.
B) decreases the deadweight loss of the quota.
C) shifts the supply curve of the good to the left.
D) increases the consumer surplus.
14) Rent seeking in the form of lobbying for an increase in import tariffs by domestic producers
A) increases consumer surplus.
B) increases total welfare.
C) increases the deadweight loss.
D) None of the above.
For the following, please answer “True” or “False” and explain why.
15) The welfare loss of a tariff equals that of a import quota that leads to the same level of imports.
16) “Supporters of import restrictions and protectionist policies place greater weight on producer welfare
than on consumer welfare.” Comment.
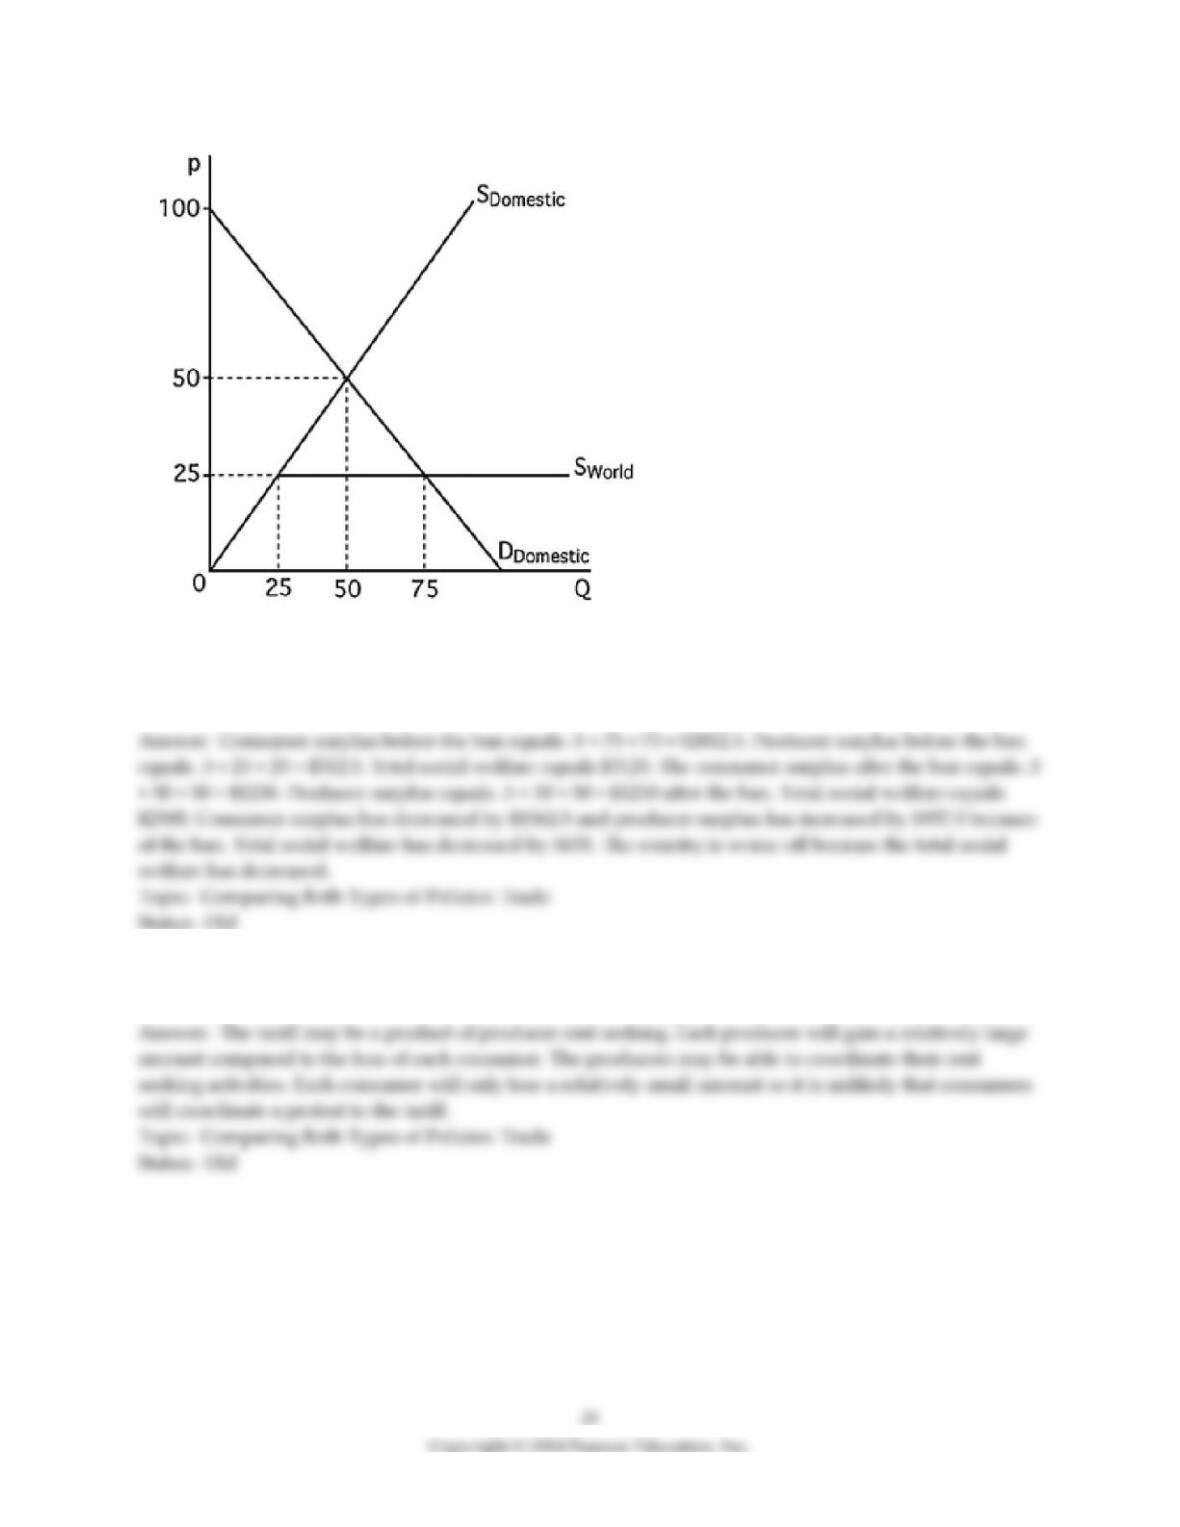
17) The domestic demand curve, domestic supply curve, and world supply curves for a good are given in
the above figure. All the curves are linear. Initially, the country allows imports. Then imports are banned.
Calculate how consumer and producer surplus change because of the ban. Is the country better off with
the ban on imports? Why?
18) Explain why a government would impose an import tariff when domestic consumers suffer more
than producers gain. Q2