Chapter 09 – Pure Competition in the Long Run
9-1
CHAPTER 9
Pure Competition in the Long Run
A. Short-Answer, Essays, and Problems
1. What is the major difference between the long run and the short run in pure competition? Explain in terms
of the number of firms and the flexibility of firms.
2. Is there a specific amount of time that distinguishes the long run from the short run? Is the amount of time
important? Explain.
3. What three assumptions are used in the chapter to keep the analysis relatively simple?
4. What is the basic conclusion that is to be drawn from the chapter? On what two facts is this conclusion
based? What are the implications?
5. Explain why the long-run product price for a perfectly competitive firm will equal its minimum average
total cost.
6. Assume that in a purely competitive industry: (1) the entry and exodus of firms are the only long-run
adjustments; (2) firms in the industry have identical cost curves; and (3) the industry is a constant-cost
industry. Explain how long-run equilibrium is eventually achieved in the industry when there are initially
economic profits and losses.
7. An airline is flying between two cities. The airline has the following costs associated with the flight:
Crew $4000 Plane daily depreciation $2000
Fuel 1000 Plane daily insurance 2000
Landing fee 1000
The airline has an average of 40 passengers paying an average of $200 for this flight. Do you think the
airline should be flying between the two cities? Evaluate from a long-run perspective.
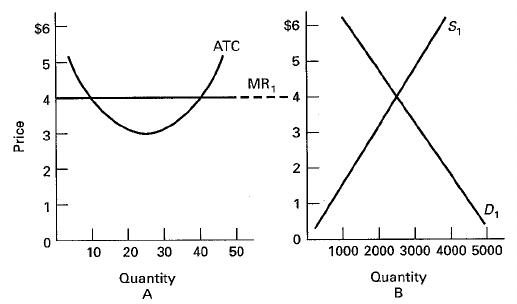
8. Consider the two graphs below. Graph A represents a typical firm in a purely competitive industry. Graph
B represents the supply and demand conditions in that industry.
(a) Describe the price, output, and profit situation for the individual firm in the short run.
(b) Describe what will happen to the individual firm and the industry in the long run. Show the changes
on graphs A and B.
Chapter 09 – Pure Competition in the Long Run
9-2
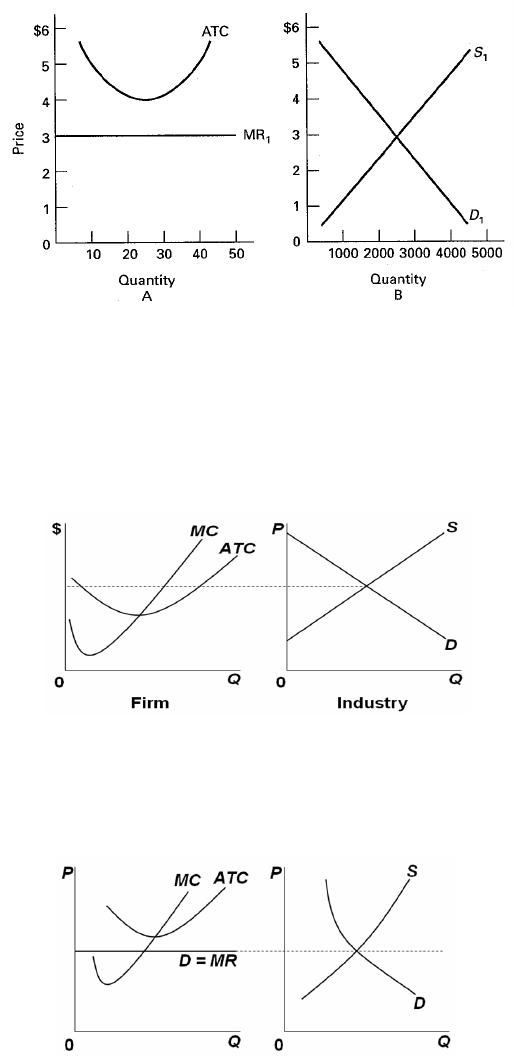
9. Consider the two graphs below. Graph A represents a typical firm in a purely competitive industry. Graph
B represents the supply and demand conditions in that industry.
(a) Describe the price, output, and profit situation for the individual firm in the short run.
(b) Describe what will happen to the individual firm and the industry in the long run. Show the changes
on graphs A and B.
10. Consider the two graphs below. Graph A represents a typical firm in a purely competitive industry. Graph
B represents the supply and demand conditions in that industry. The dashed horizontal line represents the
current market price for firms and for the industry. In the long run, what will happen to price, profit, the
supply curve, and the number of firms in the industry?
11. Consider the two graphs below. Graph A represents a typical firm in a purely competitive industry. Graph
B represents the supply and demand conditions in that industry. The dashed horizontal line represents the
current market price for firms and for the industry. In the long run, what will happen to price, profit, the
supply curve, and the number of firms in the industry?
12. “The long-run industry supply curve in a constant–cost industry graphs as a horizontal line.” Explain.
13. What is the relationship between the long-run supply curve in a constant-cost industry and elasticity?
14. Describe the graph for a long-run supply curve in an increasing-cost industry. Why does it have this slope?
Chapter 09 – Pure Competition in the Long Run
9-3
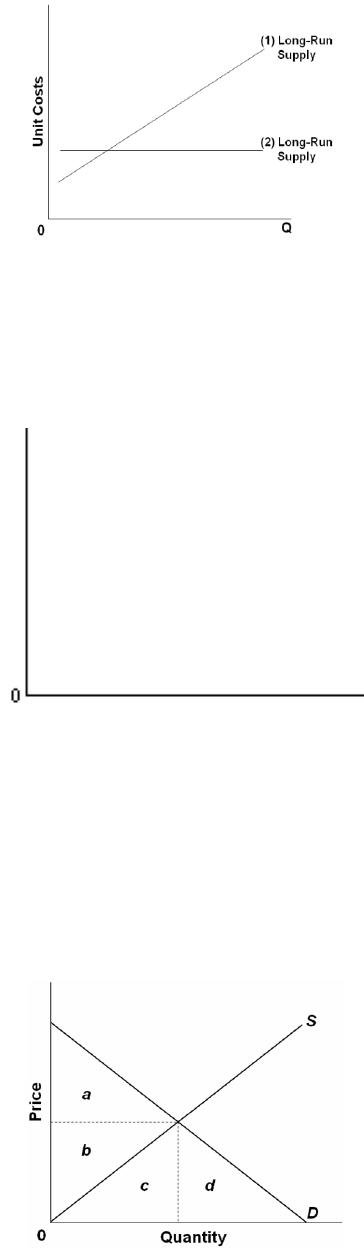
15. Below is a graph of two possible long-run industry supply curves for a purely competitive industry.
Explain why (1) is upsloping and (2) is horizontal.
16. Describe the graph for a long-run supply curve in a decreasing-cost industry. Why does it have this slope?
17. What economic conditions are necessary to achieve productive and allocative efficiency under pure
competition?
18. Draw a graph on the diagraph below showing the long-run equilibrium position of a competitive firm.
Write a formula to express the equalities in the graph.
19. What economic conditions are necessary to achieve allocative efficiency under pure competition?
20. Explain what allocative efficiency is and how it is achieved in pure competition.
21. Why does pure competition provide consumers with the largest consumer and producer surpluses?
22. Consider the supply and demand graph below to answer three questions: (a) Use a letter to identify the area
of maximum consumer surplus; (b) Use a letter to identify the area of maximum producer surplus; (c) Why
is the output level shown by the vertical dashed line one that is allocatively efficient from a marginal cost
and marginal benefit perspective?
Chapter 09 – Pure Competition in the Long Run
9-4
23. How are producer and consumer surpluses maximized in a competitive market?
24. How would a purely competitive industry adjust and restore allocative efficiency when there is an increase
in the demand for a product?
25. How does the “invisible hand” work in a competitive market system?
26. What are the differences between competition in a purely competitive industry and competition in an
industry with technological advance and innovation?
27. What are two strategies that entrepreneurs use to earn more than the normal profit? Will these strategies
earn economic profits that normally persist over time? Explain.
28. What is the concept of creative destruction? Describe two industry examples and how it has worked over
time.
29. (Last Word) Use the features of the competitive model to explain why the entry of generic drugs can reduce
the price of a medication by 30 to 40 percent.
Chapter 09 – Pure Competition in the Long Run
9-5
B. Answers to Short-Answer, Essays, and Problems
1. What is the major difference between the long run and the short run in pure competition? Explain in terms
of the number of firms and the flexibility of firms.
2. Is there a specific amount of time that distinguishes the long run from the short run? Is the amount of time
important? Explain.
3. What three assumptions are used in the chapter to keep the analysis relatively simple?
4. What is the basic conclusion that is to be drawn from the chapter? On what two facts is this conclusion
based? What are the implications?
5. Explain why the long-run product price for a perfectly competitive firm will equal its minimum average
total cost.
6. Assume that in a purely competitive industry: (1) the entry and exodus of firms are the only long-run
adjustments; (2) firms in the industry have identical cost curves; and (3) the industry is a constant-cost
Chapter 09 – Pure Competition in the Long Run
9-6
industry. Explain how long-run equilibrium is eventually achieved in the industry when there are initially
economic profits and losses.
7. An airline is flying between two cities. The airline has the following costs associated with the flight:
Crew $4000 Plane daily depreciation $2000
Fuel 1000 Plane daily insurance 2000
Landing fee 1000
The airline has an average of 40 passengers paying an average of $200 for this flight. Do you think the
airline should be flying between the two cities? Evaluate from a long-run perspective.
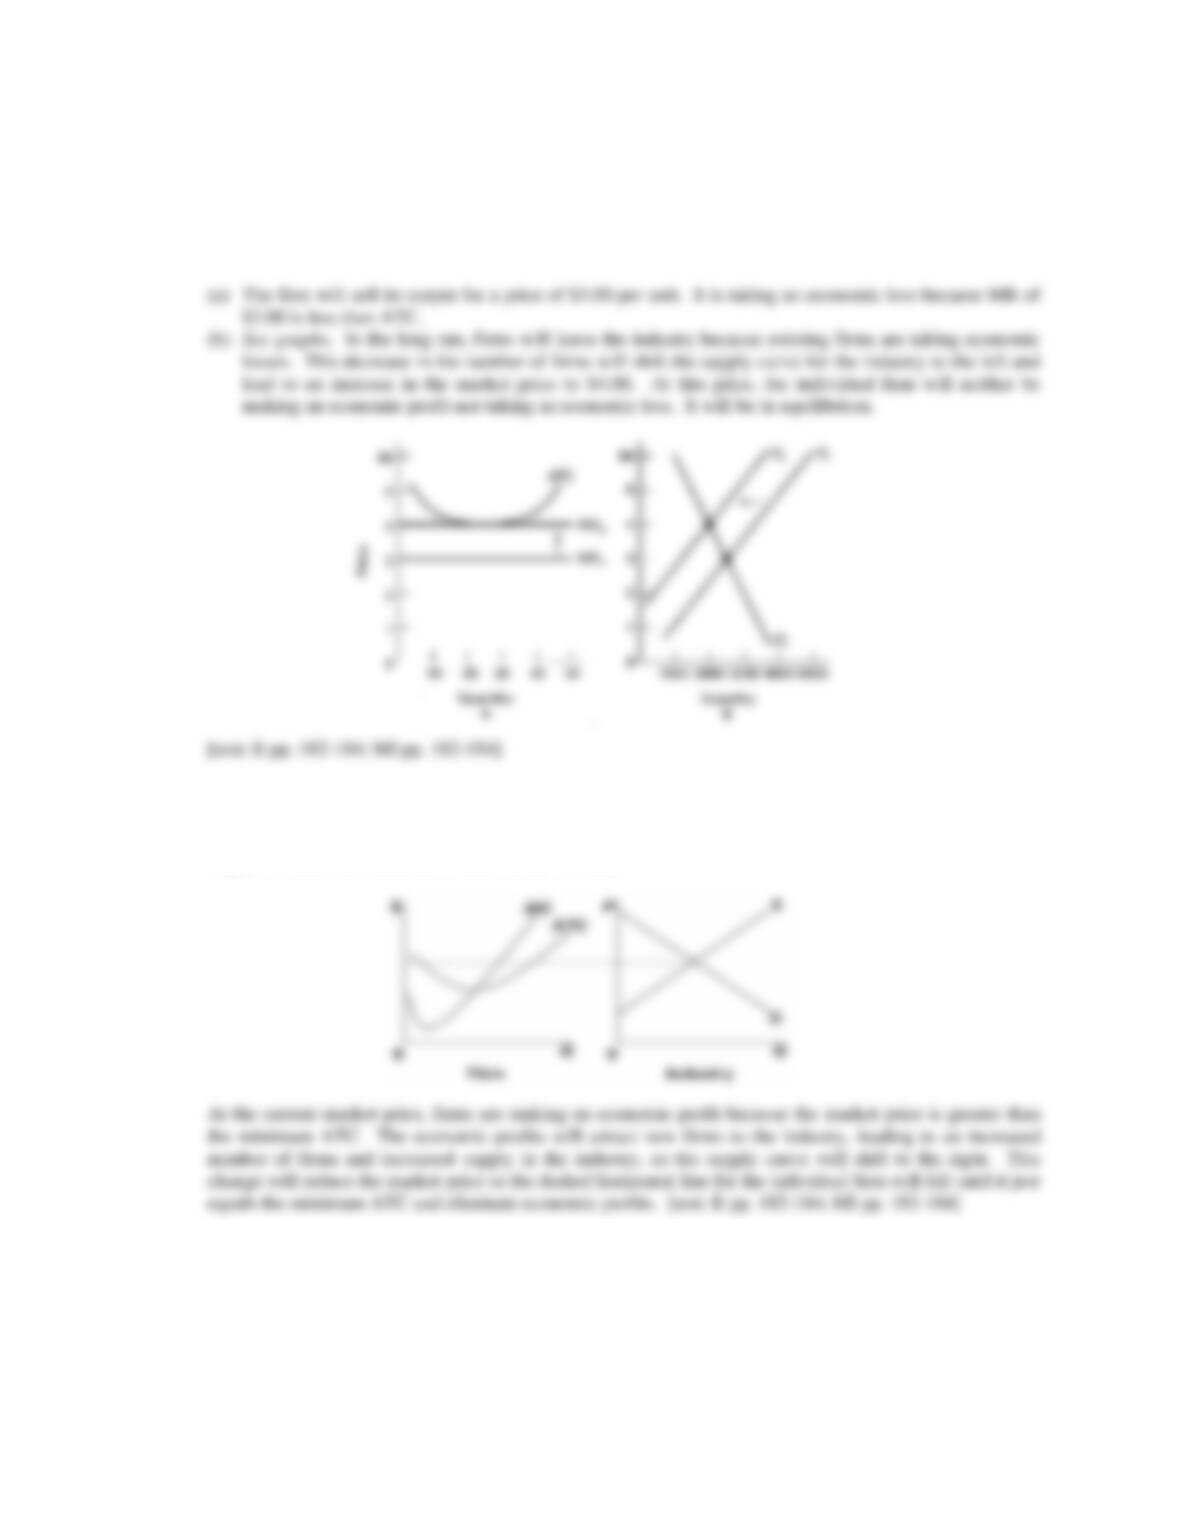
8. Consider the two graphs below. Graph A represents a typical firm in a purely competitive industry. Graph
B represents the supply and demand conditions in that industry.
(a) Describe the price, output, and profit situation for the individual firm in the short run.
(b) Describe what will happen to the individual firm and the industry in the long run. Show the changes
on graphs A and B.
Chapter 09 – Pure Competition in the Long Run
9-7
9. Consider the two graphs below. Graph A represents a typical firm in a purely competitive industry. Graph
B represents the supply and demand conditions in that industry.
(a) Describe the price, output, and profit situation for the individual firm in the short run.
(b) Describe what will happen to the individual firm and the industry in the long run. Show the changes
on graphs A and B.
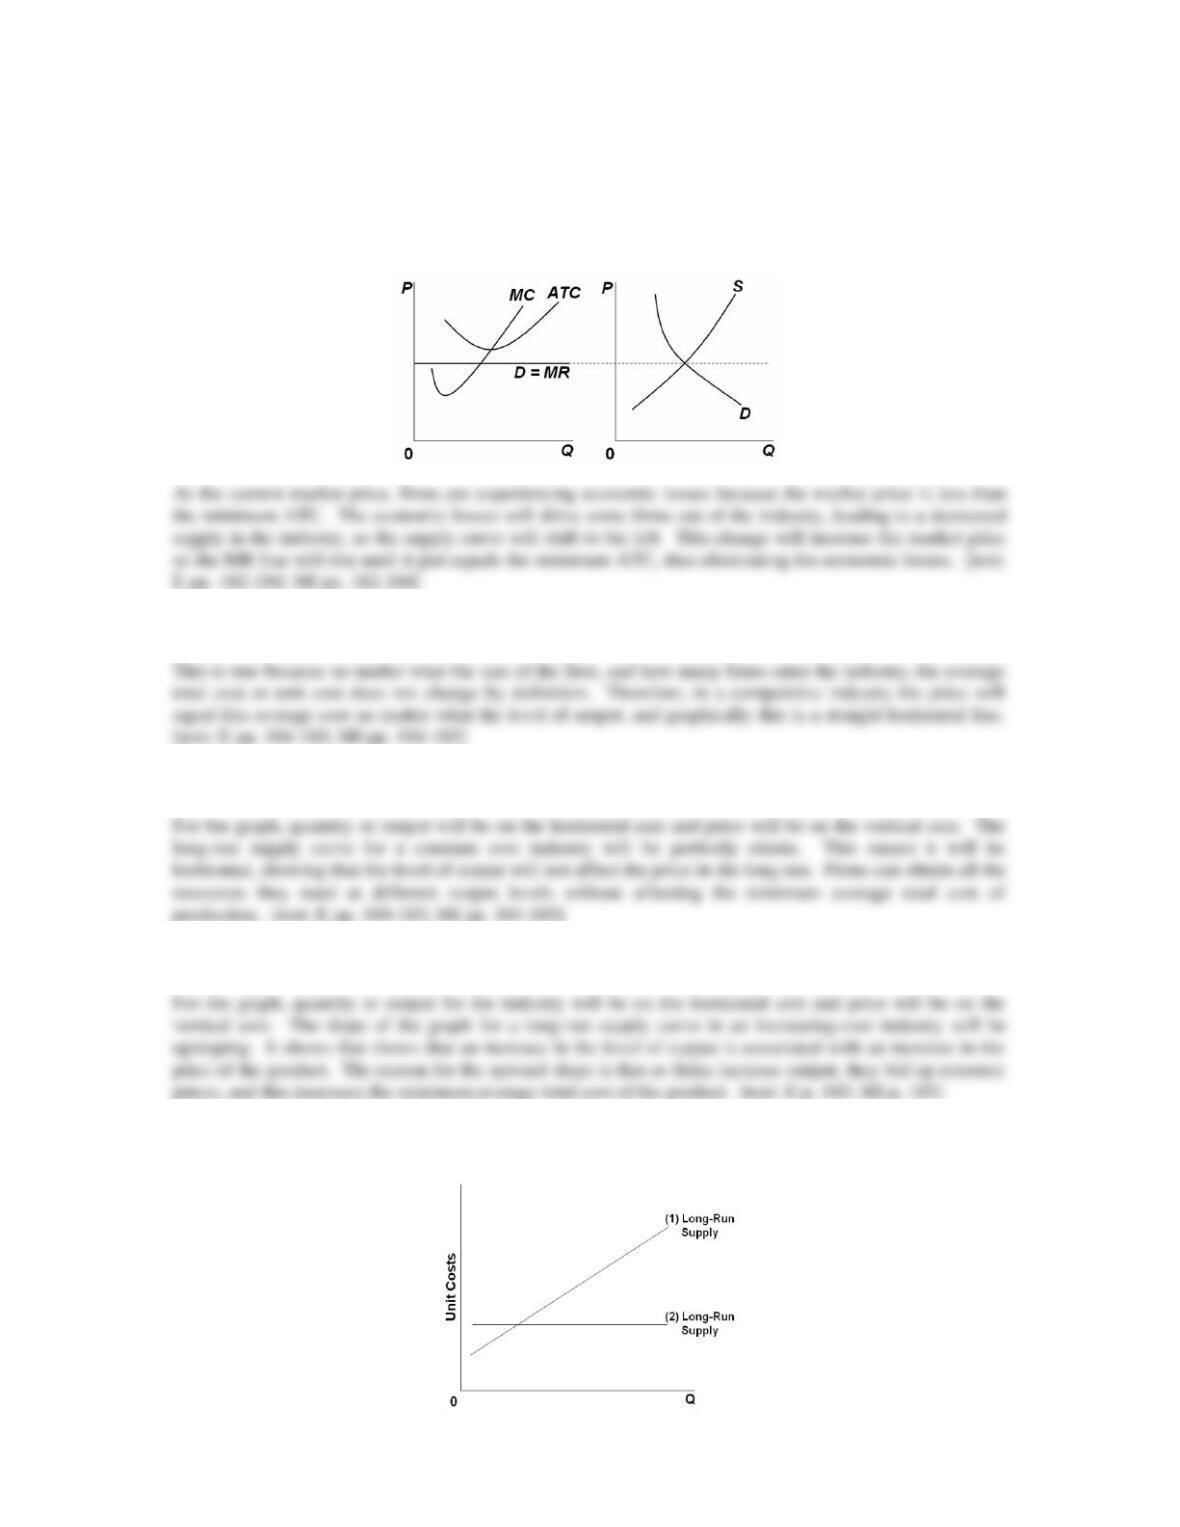
10. Consider the two graphs below. Graph A represents a typical firm in a purely competitive industry. Graph
B represents the supply and demand conditions in that industry. The dashed horizontal line represents the
current market price for firms and for the industry. In the long run, what will happen to price, profit, the
supply curve, and the number of firms in the industry?
Chapter 09 – Pure Competition in the Long Run
9-8
11. Consider the two graphs below. Graph A represents a typical firm in a purely competitive industry. Graph
B represents the supply and demand conditions in that industry. The dashed horizontal line represents the
current market price for firms and for the industry. In the long run, what will happen to price, profit, the
supply curve, and the number of firms in the industry?
12. “The long-run industry supply curve in a constant–cost industry graphs as a horizontal line.” Explain.
13. What is the relationship between the long-run supply curve in a constant-cost industry and elasticity?
14. Describe the graph for a long-run supply curve in an increasing-cost industry. Why does it have this slope?
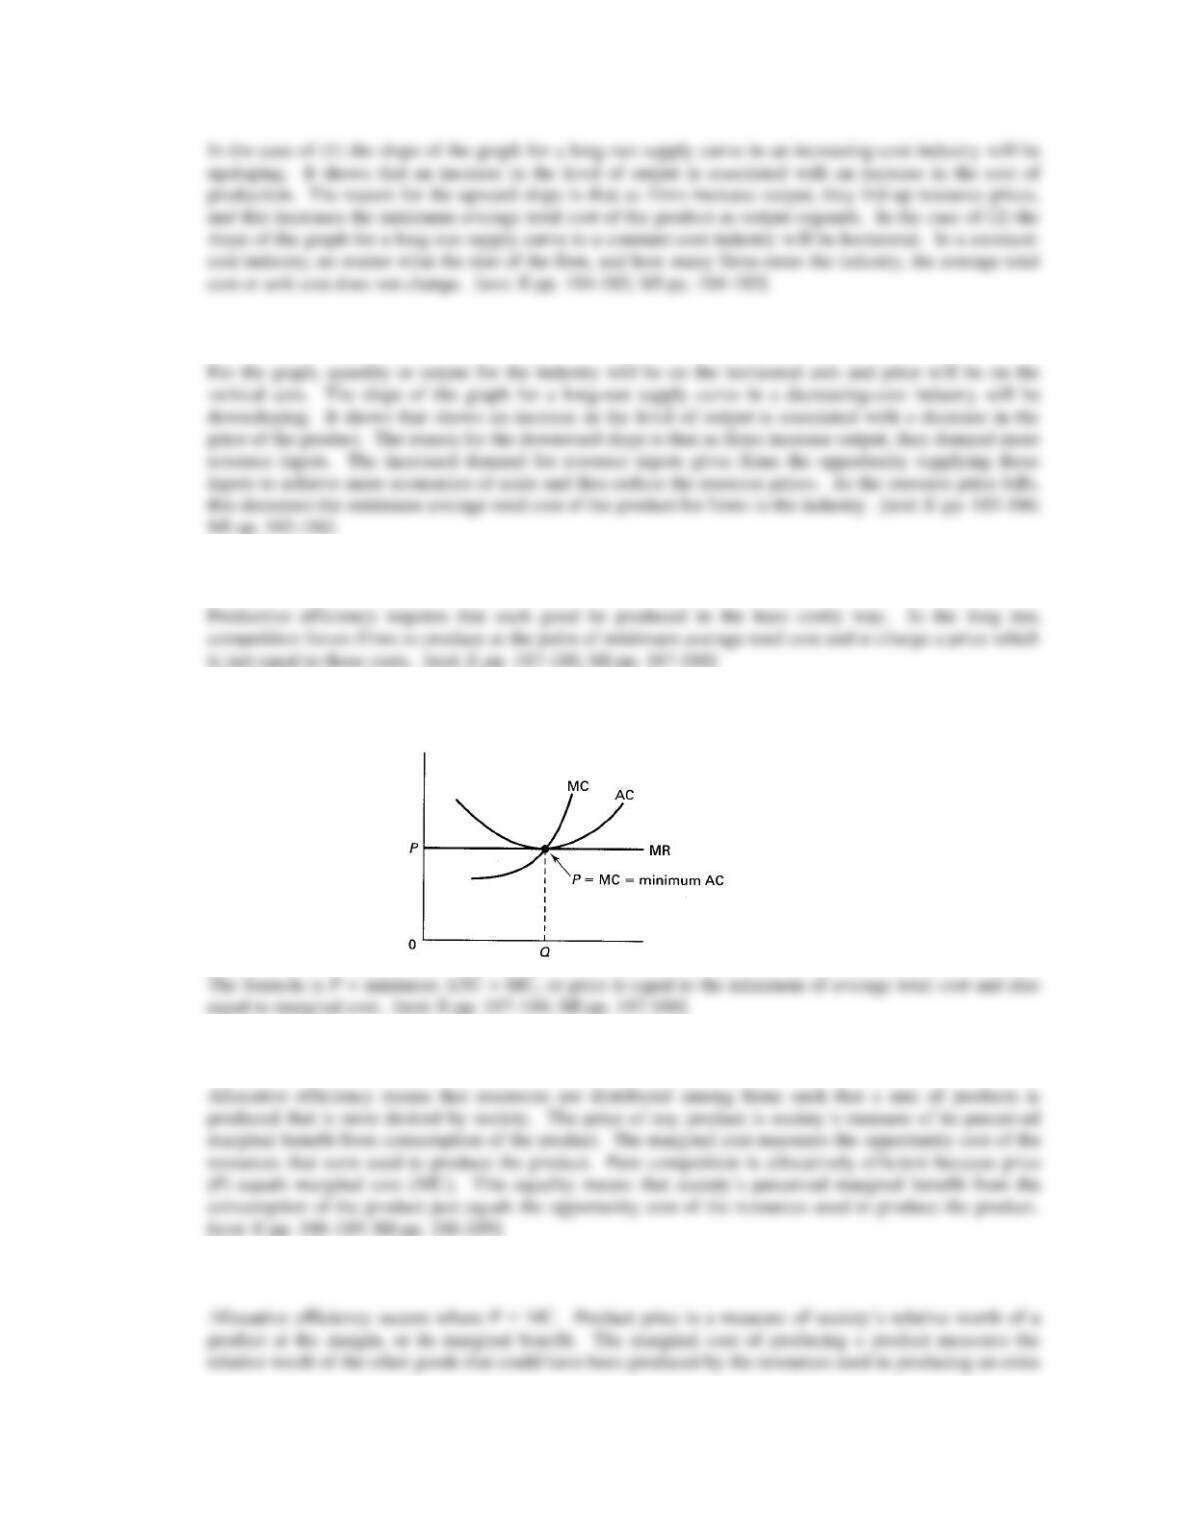
15. Below is a graph of two possible long-run industry supply curves for a purely competitive industry.
Explain why (1) is upsloping and (2) is horizontal.
Chapter 09 – Pure Competition in the Long Run
9-9
16. Describe the graph for a long-run supply curve in a decreasing-cost industry. Why does it have this slope?
17. What economic conditions are necessary to achieve productive efficiency under pure competition?
18. Draw a graph on the diagram below showing the long-run equilibrium position of a competitive firm.
Write a formula to express the equalities in the graph.
19. What economic conditions are necessary to achieve allocative efficiency under pure competition?
20. Explain what allocative efficiency is and how it is achieved in pure competition.
Chapter 09 – Pure Competition in the Long Run
21. Why does pure competition provide consumers with the largest consumer and producer surpluses?
22. Consider the supply and demand graph below to answer three questions: (a) Use a letter to identify the area
of maximum consumer surplus; (b) Use a letter to identify the area of maximum producer surplus; (c) Why
is the output level shown by the vertical dashed line one that is allocatively efficient from a marginal cost
and marginal benefit perspective?
23. How are producer and consumer surpluses maximized in a competitive market?
Chapter 09 – Pure Competition in the Long Run
9-11
24. How would a purely competitive industry adjust and restore allocative efficiency when there is an increase
in the demand for a product?
25. How does the “invisible hand” work in a competitive market system?
26. What are the differences between competition in a purely competitive industry and competition in an
industry with technological advance and innovation?
27. What are two strategies that entrepreneurs use to earn more than the normal profit? Will these strategies
earn economic profits that normally persist over time? Explain.
28. What is the concept of creative destruction? Describe two industry examples and how it has worked over
time.
Chapter 09 – Pure Competition in the Long Run
29. (Last Word) Use the features of the competitive model to explain why the entry of generic drugs can reduce
the price of a medication by 30 to 40 percent.