b.
L+M+N+Y+B.
c.
L+M+Y.
d.
J.
72. Refer to Figure 8-1. Suppose the government imposes a tax of P’ – P”’. The area measured by J+K+I represents
a.
consumer surplus after the tax.
b.
consumer surplus before the tax.
c.
producer surplus after the tax.
d.
producer surplus before the tax.
73. Refer to Figure 8-1. Suppose the government imposes a tax of P’ – P”’. The consumer surplus before the tax is
measured by the area
a.
M.
b.
L+M+Y.
c.
J.
d.
J+K+I.
74. Refer to Figure 8-1. Suppose the government imposes a tax of P’ – P”’. The area measured by J represents
a.
consumer surplus after the tax.
b.
consumer surplus before the tax.
c.
producer surplus after the tax.
d.
producer surplus before the tax.
75. Refer to Figure 8-1. Suppose the government imposes a tax of P’ – P”’. The consumer surplus after the tax is measured
by the area
a.
J+K+I.
b.
J.
c.
M.
d.
L+M+Y.
76. Refer to Figure 8-1. Suppose the government imposes a tax of P’ – P”’. The area measured by I+Y represents the
a.
deadweight loss due to the tax.
b.
loss in consumer surplus due to the tax.
c.
loss in producer surplus due to the tax.
d.
total surplus before the tax.
77. Refer to Figure 8-1. Suppose the government imposes a tax of P’ – P”’. The deadweight loss due to the tax is
measured by the area
a.
J+K+L+M.
b.
J+K+L+M+N.
c.
I+Y.
d.
I+Y+B.
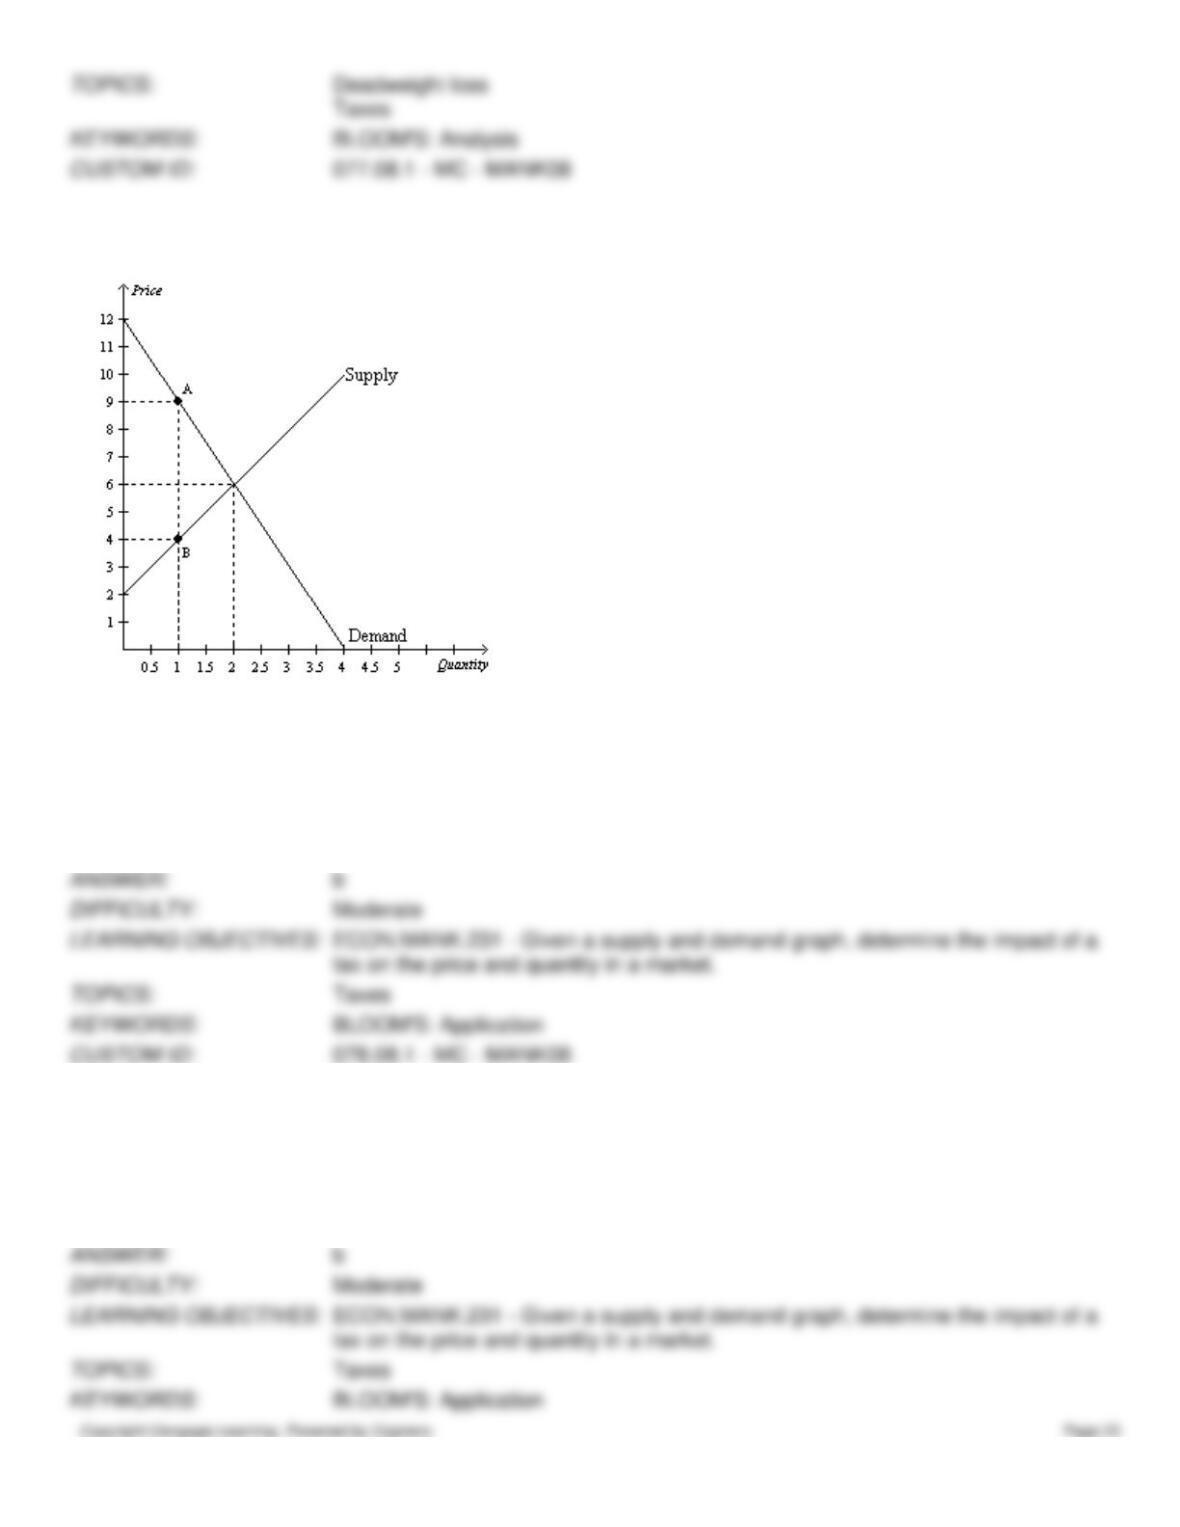
Figure 8-2
The vertical distance between points A and B represents a tax in the market.
78. Refer to Figure 8-2. The imposition of the tax causes the quantity sold to
a.
increase by 1 unit.
b.
decrease by 1 unit.
c.
increase by 2 units.
d.
decrease by 2 units.
79. Refer to Figure 8-2. The imposition of the tax causes the price paid by buyers to
a.
decrease by $2.
b.
increase by $3.
c.
decrease by $4.
d.
increase by $5.
80. Refer to Figure 8-2. The imposition of the tax causes the price received by sellers to
a.
decrease by $2.
b.
increase by $3.
c.
decrease by $4.
d.
increase by $5.
81. Refer to Figure 8-2. The amount of the tax on each unit of the good is
a.
$1.
b.
$4.
c.
$5.
d.
$9.
82. Refer to Figure 8-2. The per-unit burden of the tax on buyers is
a.
$2.
b.
$3.
c.
$4.
d.
$5.
83. Refer to Figure 8-2. The per-unit burden of the tax on sellers is
a.
$2.
b.
$3.
c.
$4.
d.
$5.
84. Refer to Figure 8-2. The amount of tax revenue received by the government is
a.
$2.50.
b.
$4.
c.
$5.
d.
$9.
85. Refer to Figure 8-2. The amount of deadweight loss as a result of the tax is
a.
$2.50.
b.
$5.
c.
$7.50.
d.
$10.
86. Refer to Figure 8-2. The loss of consumer surplus as a result of the tax is
a.
$1.50.
b.
$3.
c.
$4.50.
d.
$6.
87. Refer to Figure 8-2. The loss of producer surplus as a result of the tax is
a.
$1.
b.
$2.
c.
$3.
d.
$4.
88. Refer to Figure 8-2. Consumer surplus without the tax is
a.
$6, and consumer surplus with the tax is $1.50.
b.
$6, and consumer surplus with the tax is $4.50.
c.
$10, and consumer surplus with the tax is $1.50.
d.
$10, and consumer surplus with the tax is $4.50.
89. Refer to Figure 8-2. Producer surplus without the tax is
a.
$4, and producer surplus with the tax is $1.
b.
$4, and producer surplus with the tax is $3.
c.
$10, and producer surplus with the tax is $1.
d.
$10, and producer surplus with the tax is $3.
90. Refer to Figure 8-2. Total surplus without the tax is
a.
$10, and total surplus with the tax is $2.50.
b.
$10, and total surplus with the tax is $7.50.
c.
$20, and total surplus with the tax is $2.50.
d.
$20, and total surplus with the tax is $7.50.
91. Refer to Figure 8-2. The loss of consumer surplus associated with some buyers dropping out of the market as a result
of the tax is
a.
$0.
b.
$1.50.
c.
$3.
d.
$4.50.
92. Refer to Figure 8-2. The loss of consumer surplus for those buyers of the good who continue to buy it after the tax is
imposed is
a.
$0.
b.
$1.50.
c.
$3.
d.
$4.50.
93. Refer to Figure 8-2. The loss of producer surplus associated with some sellers dropping out of the market as a result
of the tax is
a.
$0.
b.
$1.
c.
$2.
d.
$3.
94. Refer to Figure 8-2. The loss of producer surplus for those sellers of the good who continue to sell it after the tax is
imposed is
a.
$0.
b.
$1.
c.
$2.
d.
$3.
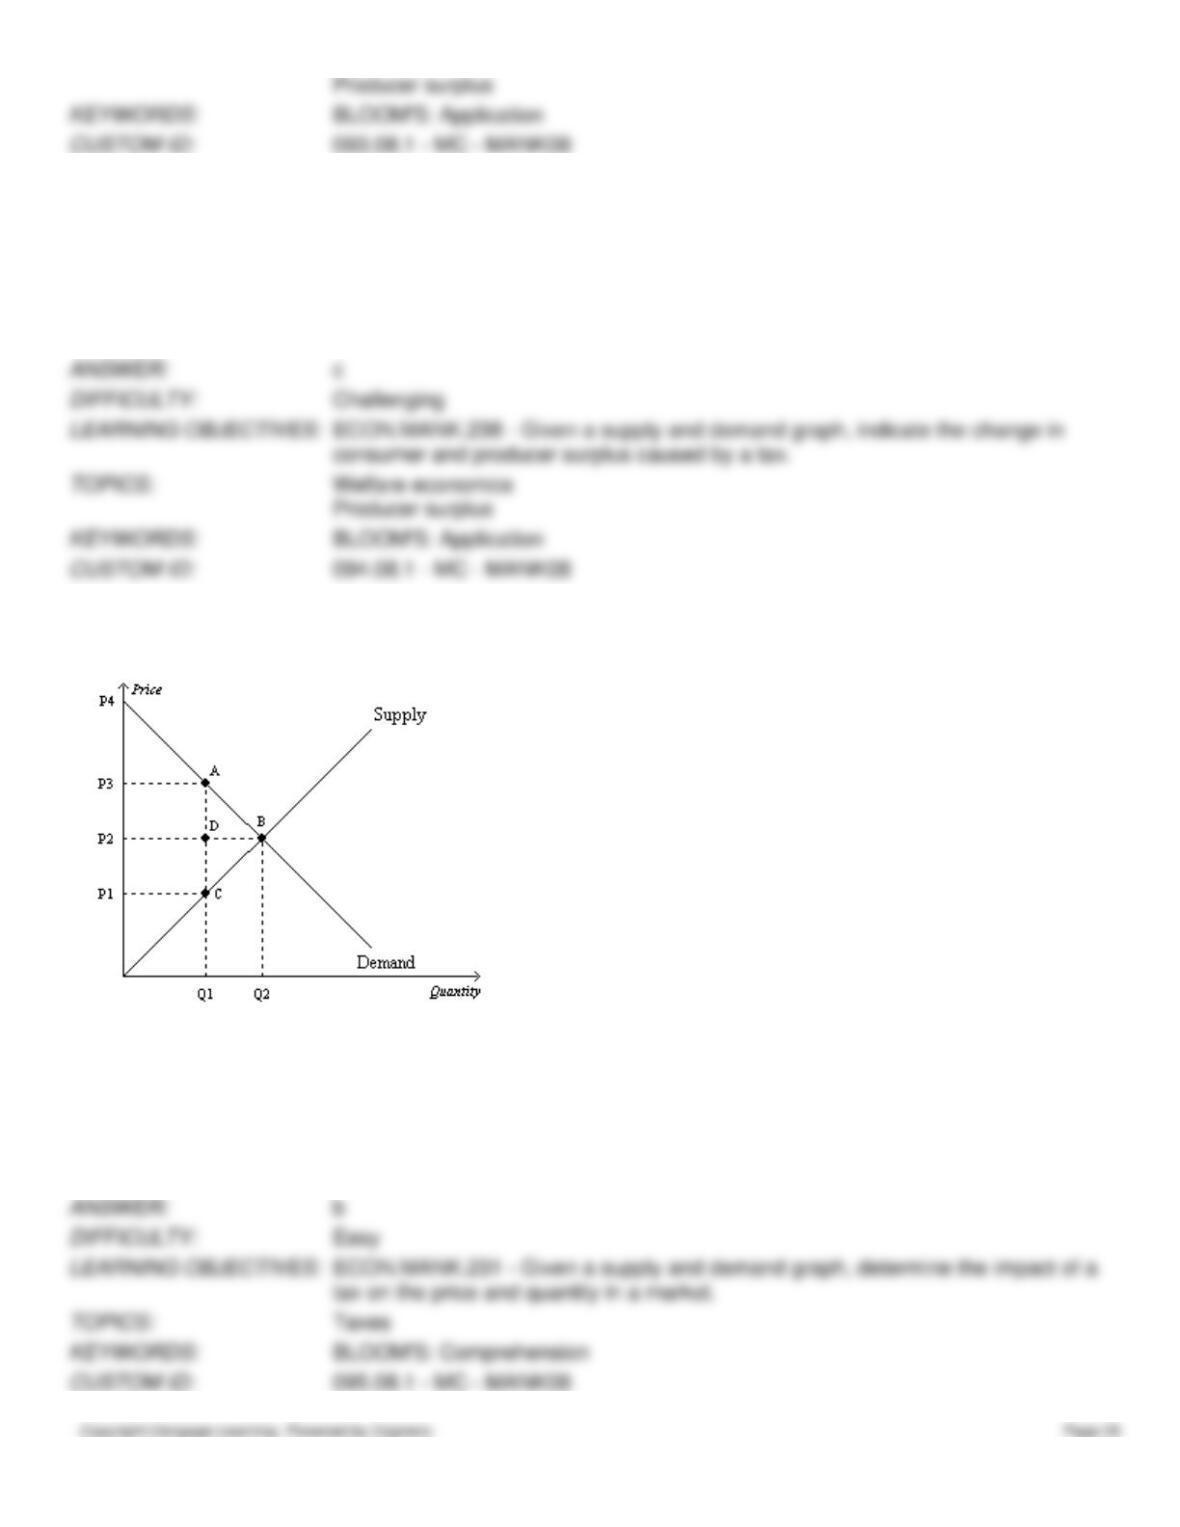
Figure 8-3
The vertical distance between points A and C represents a tax in the market.
95. Refer to Figure 8-3. The equilibrium price before the tax is imposed is
a.
P1.
b.
P2.
c.
P3.
d.
P4.
96. Refer to Figure 8-3. The price that buyers effectively pay after the tax is imposed is
a.
P1.
b.
P2.
c.
P3.
d.
P4.
97. Refer to Figure 8-3. The price that sellers effectively receive after the tax is imposed is
a.
P1.
b.
P2.
c.
P3.
d.
P4.
98. Refer to Figure 8-3. The per unit burden of the tax on buyers is
a.
P3 – P1.
b.
P3 – P2.
c.
P2 – P1.
d.
P4 – P3.
99. Refer to Figure 8-3. The per-unit burden of the tax on sellers is
a.
P3 – P1.
b.
P3 – P2.
c.
P2 – P1.
d.
P4 – P3.
100. Refer to Figure 8-3. The amount of the tax on each unit of the good is
a.
P3 – P1.
b.
P3 – P2.
c.
P2 – P1.
d.
P4 – P3.
101. Refer to Figure 8-3. The amount of tax revenue received by the government is equal to the area
a.
P3ACP1.
b.
ABC.
c.
P2DAP3.
d.
P1CDP2.
102. Refer to Figure 8-3. The amount of deadweight loss associated with the tax is equal to
a.
P3ACP1.
b.
ABC.
c.
P2ADP3.
d.
P1DCP2.
103. Refer to Figure 8-3. The loss in consumer surplus caused by the tax is measured by the area
a.
P1P3AC.
b.
P3ABP2.
c.
P1P3ABC.
d.
ABC.
104. Refer to Figure 8-3. The loss in producer surplus caused by the tax is measured by the area
a.
ABC.
b.
P1P3ABC.
c.
P1P2BC.
d.
P1C0.
105. Refer to Figure 8-3. Which of the following equations is valid for the tax revenue that the tax provides to the
government?
a.
Tax revenue = (P2 – P1)xQ1
b.
Tax revenue = (P3 – P1)xQ1
c.
Tax revenue = (P3 – P2)xQ1
d.
Tax revenue = (P3 – P1)x(Q2 – Q1)
106. Refer to Figure 8-3. Which of the following equations is valid for the deadweight loss of the tax?
a.
Deadweight loss = (1/2)(P2 – P1)(Q2 + Q1)
b.
Deadweight loss = (1/2)(P3 – P1)(Q2 + Q1)
c.
Deadweight loss = (1/2)(P3 – P2)(Q2 – Q1)
d.
Deadweight loss = (1/2)(P3 – P1)(Q2 – Q1)
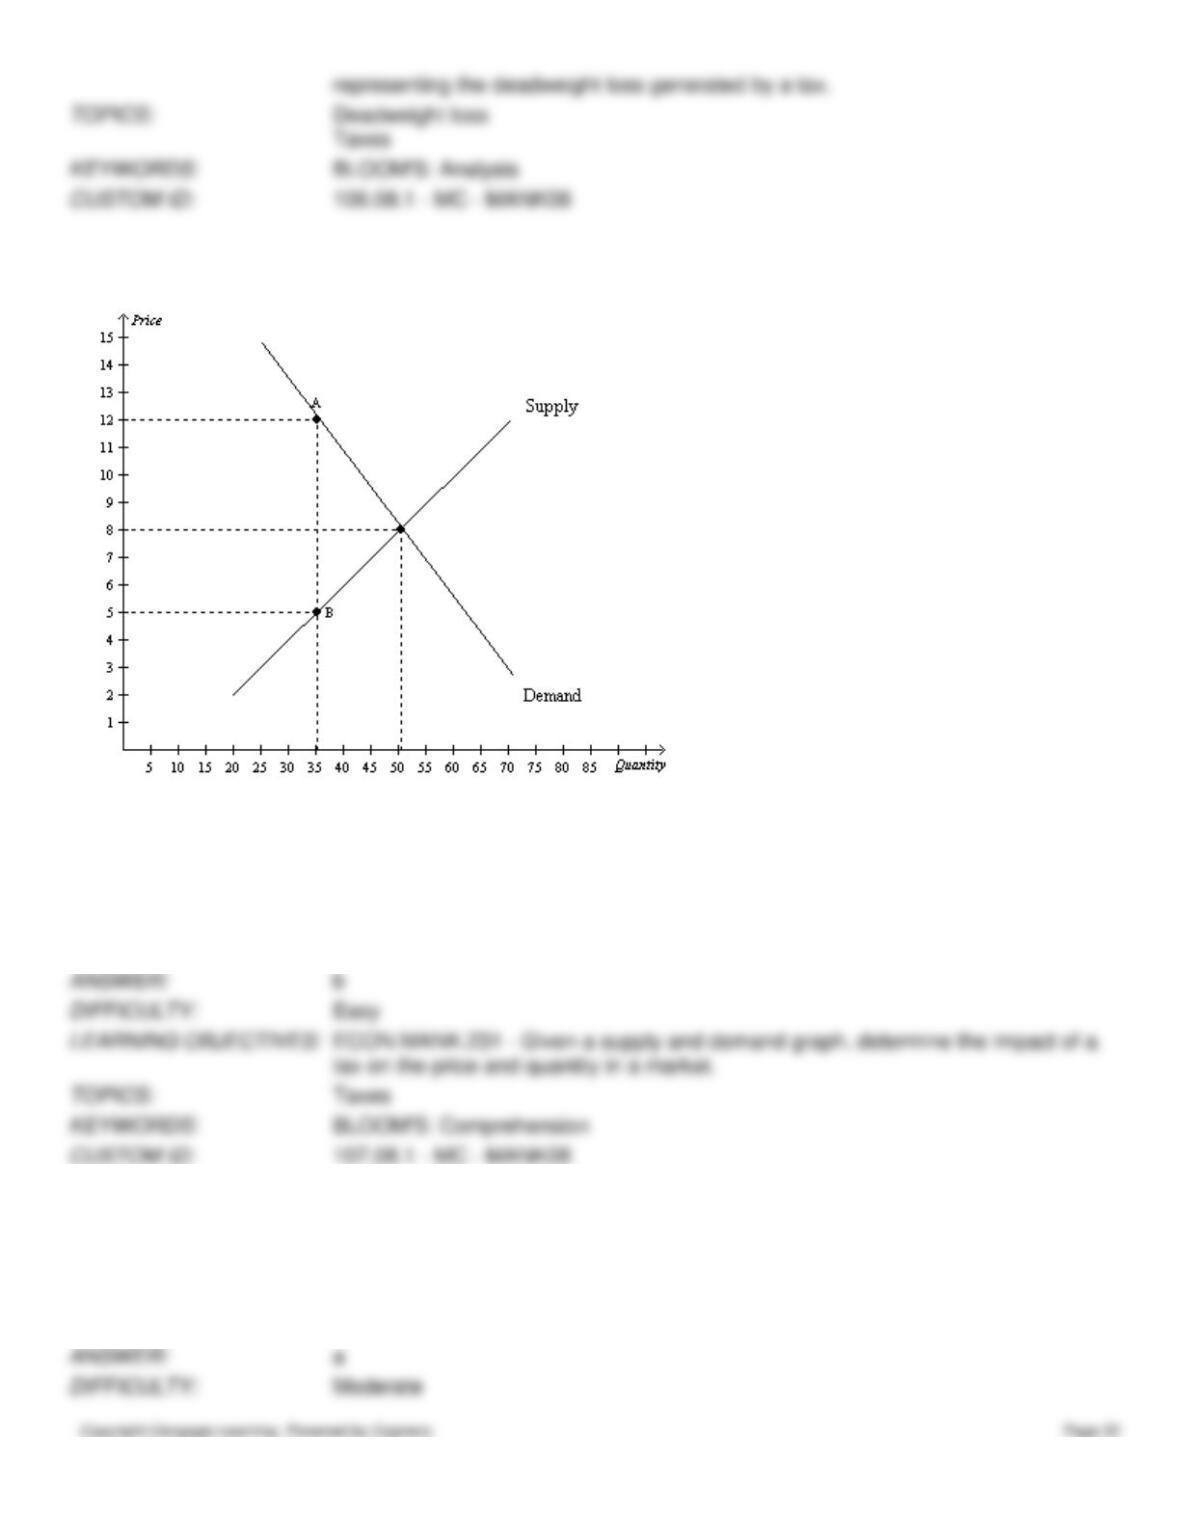
Figure 8-4
The vertical distance between points A and B represents a tax in the market.
107. Refer to Figure 8-4. The equilibrium price before the tax is imposed is
a.
$12, and the equilibrium quantity is 35.
b.
$8, and the equilibrium quantity is 50.
c.
$5, and the equilibrium quantity is 35.
d.
$5, and the equilibrium quantity is 50.
108. Refer to Figure 8-4. The price that buyers effectively pay after the tax is imposed is
a.
$12.
b.
between $8 and $12.
c.
between $5 and $8.
d.
$5.
109. Refer to Figure 8-4. The price that sellers effectively receive after the tax is imposed is
a.
$12.
b.
between $8 and $12.
c.
between $5 and $8.
d.
$5.
110. Refer to Figure 8-4. The per-unit burden of the tax on buyers is
a.
$3.
b.
$4.
c.
$5.
d.
$8.
111. Refer to Figure 8-4. The per-unit burden of the tax on sellers is
a.
$7.
b.
$5.
c.
$4.
d.
$3.
112. Refer to Figure 8-4. The amount of the tax on each unit of the good is
a.
$5.
b.
$7.
c.
$8.
d.
$12.
113. Refer to Figure 8-4. The amount of tax revenue received by the government is equal to
a.
$245.
b.
$350.
c.
$490.
d.
$700.
114. Refer to Figure 8-4. The amount of deadweight loss as a result of the tax is
a.
$35.00.
b.
$45.25.
c.
$52.50.
d.
$105.00.
115. Refer to Figure 8-4. The tax results in a loss of consumer surplus that amounts to
a.
$105.
b.
$140.
c.
$170.
d.
$210.
116. Refer to Figure 8-4. The tax results in a loss of producer surplus that amounts to
a.
$75.50.
b.
$90.00.
c.
$112.50.
d.
$127.50.
Figure 8-5
Suppose that the government imposes a tax of P3 – P1.
117. Refer to Figure 8-5. The equilibrium price before the tax is imposed is
a.
P1.
b.
P2.
c.
P3.
d.
P4.
118. Refer to Figure 8-5. The price that buyers effectively pay after the tax is imposed is
a.
P1.
b.
P2.
c.
P3.
d.
P4.
119. Refer to Figure 8-5. The price that sellers effectively receive after the tax is imposed is
a.
P1.
b.
P2.
c.
P3.
d.
P4.
120. Refer to Figure 8-5. The tax is levied on
a.
buyers only.
b.
sellers only.
c.
both buyers and sellers.
d.
This is impossible to determine from the figure.
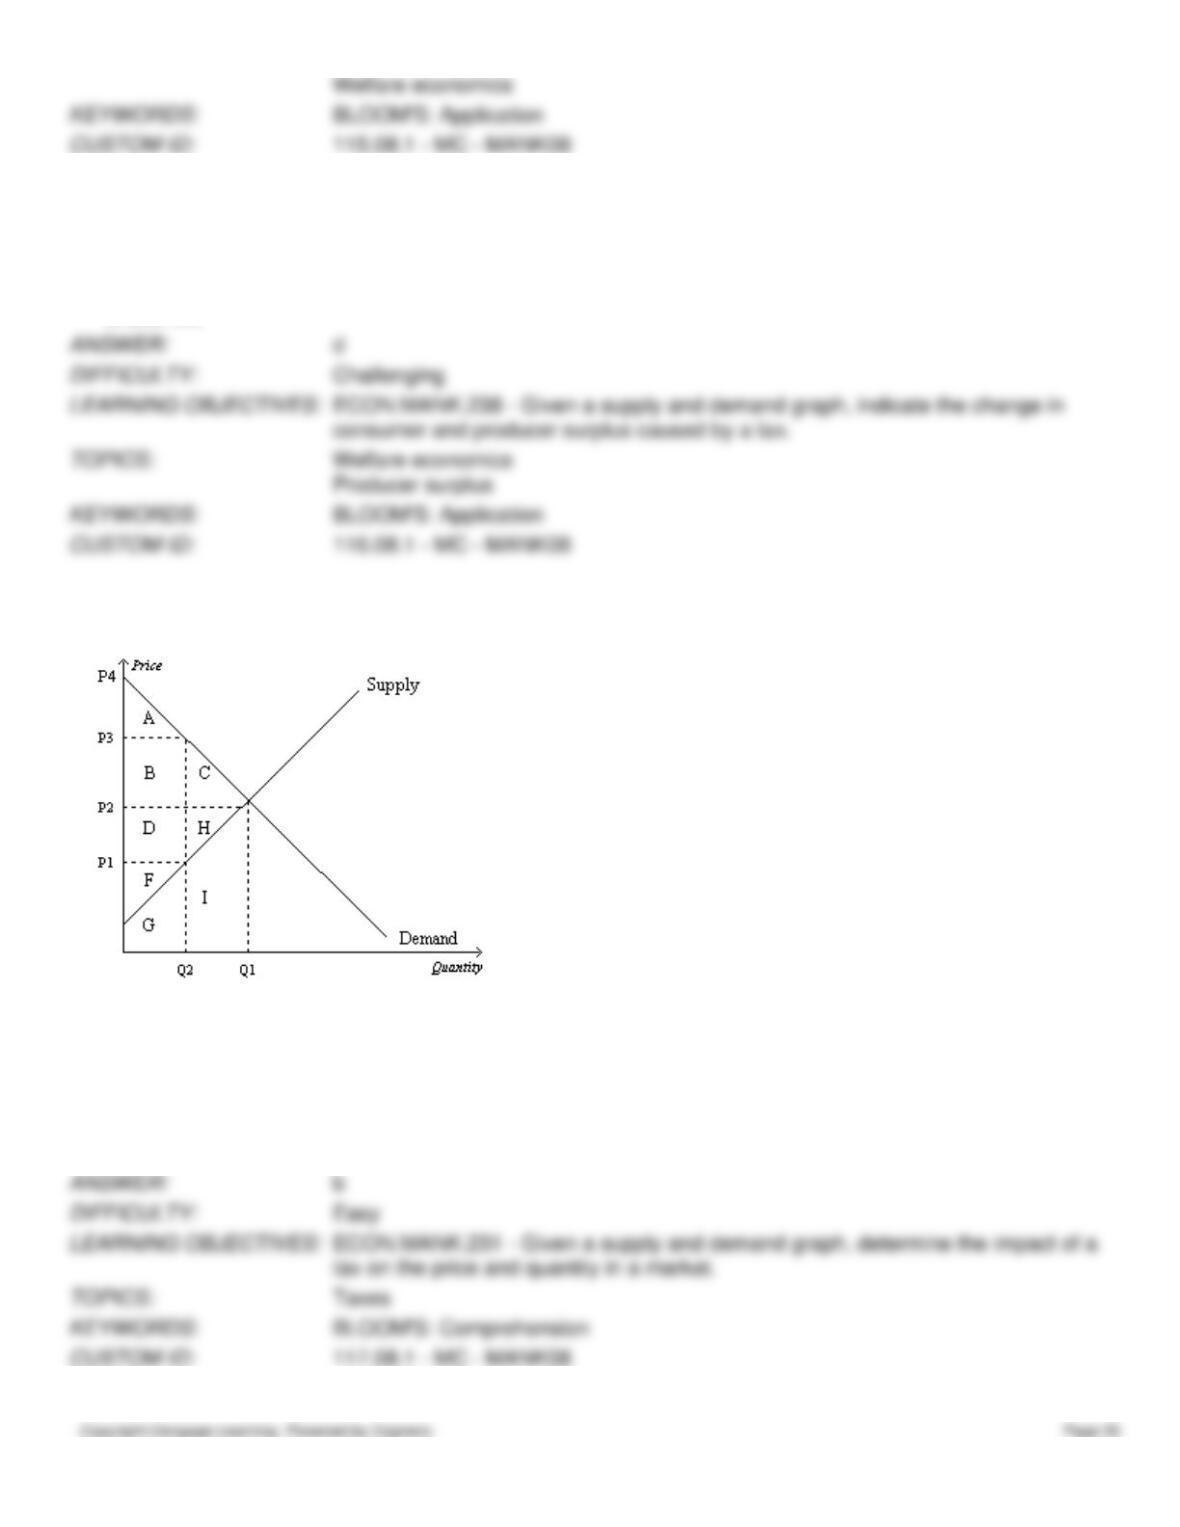
121. Refer to Figure 8-5. Consumer surplus before the tax was levied is represented by area
a.
A.
b.
A+B+C.
c.
D+H+F.
d.
F.
122. Refer to Figure 8-5. Producer surplus before the tax was levied is represented by area
a.
A.
b.
A+B+C.
c.
D+H+F.
d.
F.
123. Refer to Figure 8-5. After the tax is levied, consumer surplus is represented by area
a.
A.
b.
A+B+C.
c.
D+H+F.
d.
F.
124. Refer to Figure 8-5. After the tax is levied, producer surplus is represented by area
a.
A.
b.
A+B+C.
c.
D+H+F.
d.
F.
125. Refer to Figure 8-5. The tax causes a reduction in consumer surplus that is represented by area
a.
A.
b.
B+C.
c.
C+H.
d.
F.
126. Refer to Figure 8-5. The tax causes a reduction in producer surplus that is represented by area
a.
A.
b.
C+H.
c.
D+H.
d.
F.
127. Refer to Figure 8-5. The benefit to the government is measured by
a.
tax revenue and is represented by area A+B.
b.
tax revenue and is represented by area B+D.
c.
the net gain in total surplus and is represented by area B+D.
d.
the net gain in total surplus and is represented by area C+H.
128. Refer to Figure 8-5. The total surplus with the tax is represented by area
a.
C+H.
b.
A+B+C.
c.
D+H+F.
d.
A+B+D+F.
129. Refer to Figure 8-5. The loss in total welfare that results from the tax is represented by area
a.
A+B+D+F.
b.
A+B+C.
c.
D+H+F.
d.
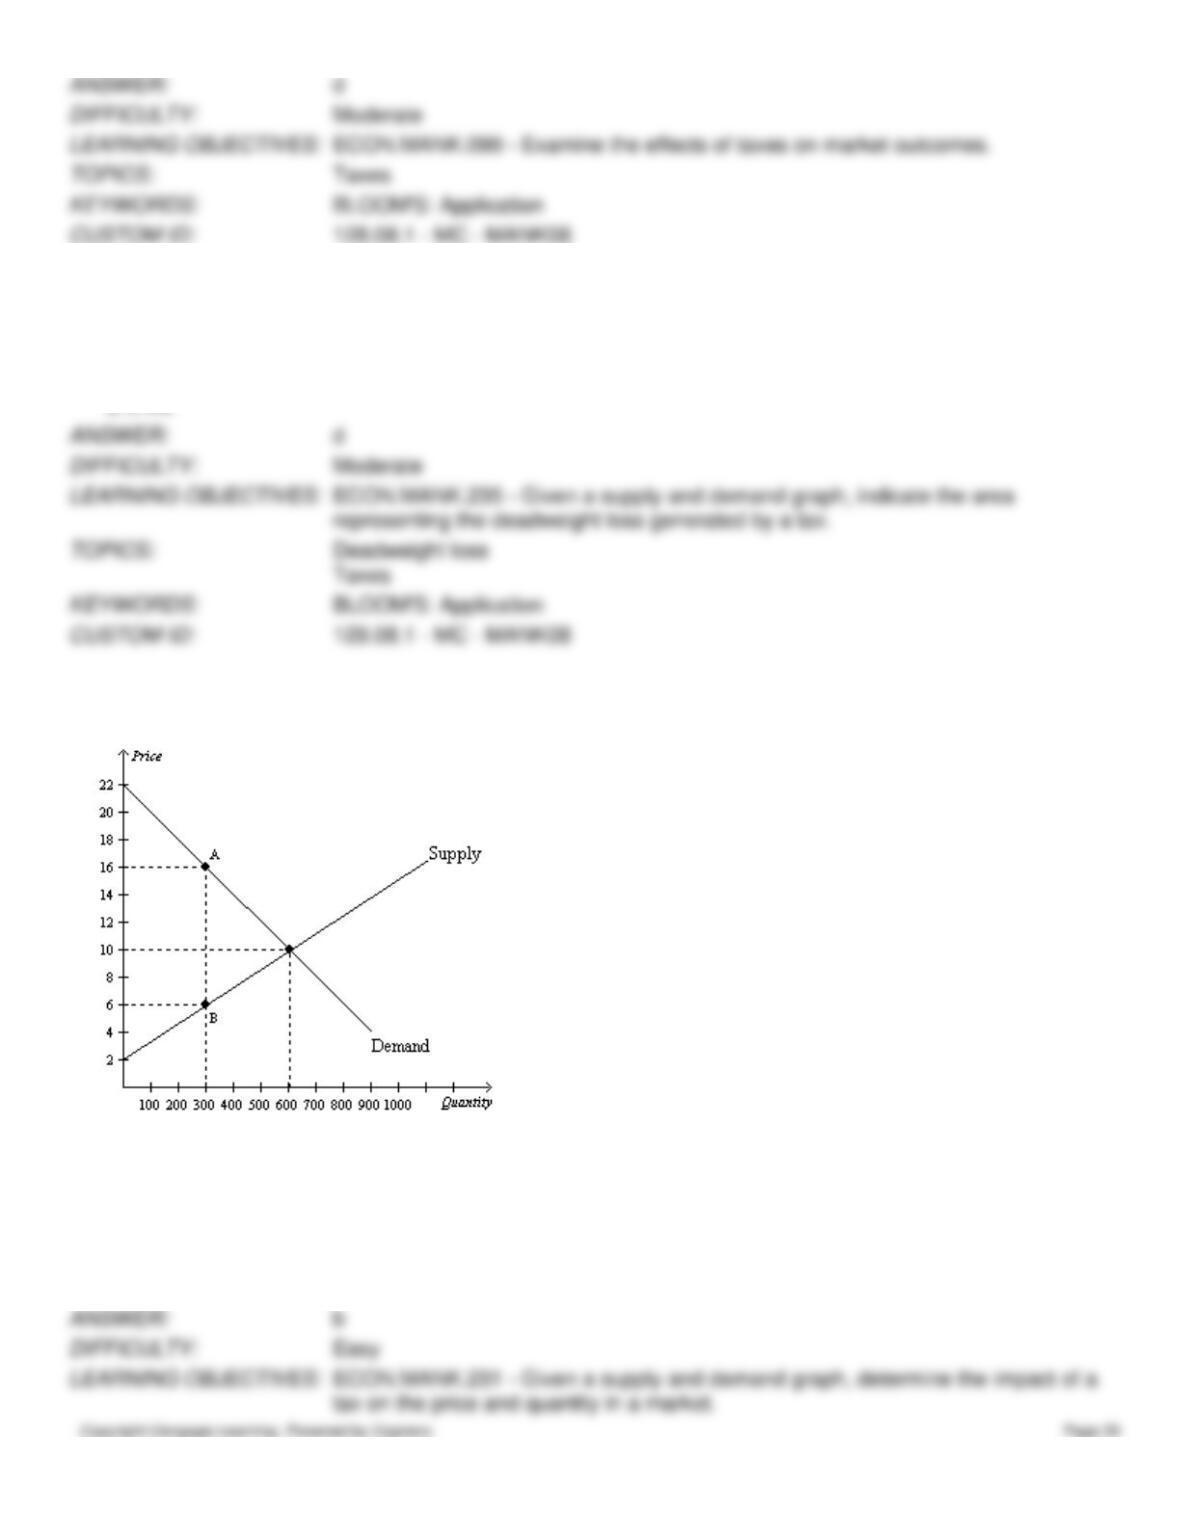
Figure 8-6
The vertical distance between points A and B represents a tax in the market.
130. Refer to Figure 8-6. Without a tax, the equilibrium price and quantity are
a.
$16 and 300.
b.
$10 and 600.
c.
$10 and 300.
d.
$6 and 300.
131. Refer to Figure 8-6. Without a tax, consumer surplus in this market is
a.
$1,500.
b.
$2,400.
c.
$3,000.
d.
$3,600.
132. Refer to Figure 8-6. Without a tax, producer surplus in this market is
a.
$1,500.
b.
$2,400.
c.
$3,000.
d.
$3,600.
133. Refer to Figure 8-6. Without a tax, total surplus in this market is
a.
$3,000.
b.
$4,800.
c.
$6,000.
d.
$7,200.
134. Refer to Figure 8-6. When the tax is imposed in this market, the price buyers effectively pay is
a.
$4.
b.
$6.