Chapter 8 Application: The Costs of Taxation
MULTIPLE CHOICE
1. In 1776, the American Revolution was sparked by anger over
a.
the extravagant lifestyle of British royalty.
b.
the crimes of British soldiers stationed in the American colonies.
c.
British taxes imposed on the American colonies.
d.
the failure of the British to protect American colonists from attack by hostile Native Americans.
2. Anger over British taxes played a significant role in bringing about the
a.
election of John Adams as the second American president.
b.
American Revolution.
c.
War of 1812.
d.
“no new taxes” clause in the U.S. Constitution.
3. Who once said that taxes are the price we pay for a civilized society?
a.
Aristotle
b.
George Washington
c.
Oliver Wendell Holmes, Jr.
d.
Ronald Reagan
4. Who once said that taxes are the price we pay for a civilized society?
a.
Milton Friedman
b.
Theodore Roosevelt
c.
Arthur Laffer
d.
Oliver Wendell Holmes, Jr.
5. To fully understand how taxes affect economic well-being, we must
a.
assume that economic well-being is not affected if all tax revenue is spent on goods and services for
the people who are being taxed.
b.
compare the taxes raised in the United States with those raised in other countries, especially France.
c.
compare the reduced welfare of buyers and sellers to the amount of revenue the government raises.
d.
take into account the fact that almost all taxes reduce the welfare of buyers, increase the welfare of
sellers, and raise revenue for the government.
2 ❖ Chapter 8/Application: The Costs of Taxation
6. To fully understand how taxes affect economic well-being, we must compare the
a.
benefit to buyers with the loss to sellers.
b.
price paid by buyers to the price received by sellers.
c.
profits earned by firms to the losses incurred by consumers.
d.
decrease in total surplus to the increase in revenue raised by the government.
7. To fully understand how taxes affect economic well-being, we must compare the
a.
consumer surplus to the producer surplus.
b.
price paid by buyers to the price received by sellers.
c.
reduced welfare of buyers and sellers to the revenue raised by the government.
d.
consumer surplus to the deadweight loss.
8. Which of the following tools help us evaluate how taxes affect economic well-being?
(i)
consumer surplus
(ii)
producer surplus
(iii)
tax revenue
(iv)
deadweight loss
a.
(i) and (ii) only
b.
(i), (ii), and (iii) only
c.
(iii) and (iv) only
d.
(i), (ii), (iii), and (iv)
THE DEADWEIGHT LOSS OF TAXATION
1. When a tax is levied on a good, the buyers and sellers of the good share the burden,
a.
provided the tax is levied on the sellers.
b.
provided the tax is levied on the buyers.
c.
provided a portion of the tax is levied on the buyers, with the remaining portion levied on the
sellers.
d.
regardless of how the tax is levied.
2. A tax on a good
a.
raises the price that buyers effectively pay and raises the price that sellers effectively receive.
b.
raises the price that buyers effectively pay and lowers the price that sellers effectively receive.
c.
lowers the price that buyers effectively pay and raises the price that sellers effectively receive.
d.
lowers the price that buyers effectively pay and lowers the price that sellers effectively receive.
Chapter 8/Application: The Costs of Taxation ❖ 3
3. When a tax is placed on a product, the price paid by buyers
a.
rises, and the price received by sellers rises.
b.
rises, and the price received by sellers falls.
c.
falls, and the price received by sellers rises.
d.
falls, and the price received by sellers falls.
4. A tax affects
a.
buyers only.
b.
sellers only.
c.
buyers and sellers only.
d.
buyers, sellers, and the government.
5. The government’s benefit from a tax can be measured by
a.
consumer surplus.
b.
producer surplus.
c.
tax revenue.
d.
All of the above are correct.
6. What happens to the total surplus in a market when the government imposes a tax?
a.
Total surplus increases by the amount of the tax.
b.
Total surplus increases but by less than the amount of the tax.
c.
Total surplus decreases.
d.
Total surplus is unaffected by the tax.
7. When a good is taxed,
a.
both buyers and sellers of the good are made worse off.
b.
only buyers are made worse off, because they ultimately bear the burden of the tax.
c.
only sellers are made worse off, because they ultimately bear the burden of the tax.
d.
neither buyers nor sellers are made worse off, since tax revenue is used to provide goods and
services that would otherwise not be provided in a market economy.
8. To measure the gains and losses from a tax on a good, economists use the tools of
a.
macroeconomics.
b.
welfare economics.
c.
international-trade theory.
d.
circular-flow analysis.
4 ❖ Chapter 8/Application: The Costs of Taxation
9. When a tax is imposed on a good, the
a.
supply curve for the good always shifts.
b.
demand curve for the good always shifts.
c.
amount of the good that buyers are willing to buy at each price always remains unchanged.
d.
equilibrium quantity of the good always decreases.
10. A tax levied on the sellers of a good shifts the
a.
supply curve upward (or to the left).
b.
supply curve downward (or to the right).
c.
demand curve upward (or to the right).
d.
demand curve downward (or to the left).
11. A tax levied on the buyers of a good shifts the
a.
supply curve upward (or to the left).
b.
supply curve downward (or to the right).
c.
demand curve downward (or to the left).
d.
demand curve upward (or to the right).
12. If a tax shifts the supply curve upward (or to the left), we can infer that the tax was levied on
a.
buyers of the good.
b.
sellers of the good.
c.
both buyers and sellers of the good.
d.
We cannot infer anything because the shift described is not consistent with a tax.
13. If a tax shifts the supply curve downward (or to the right), we can infer that the tax was levied on
a.
buyers of the good.
b.
sellers of the good.
c.
both buyers and sellers of the good.
d.
We cannot infer anything because the shift described is not consistent with a tax.
14. If a tax shifts the demand curve downward (or to the left), we can infer that the tax was levied on
a.
buyers of the good.
b.
sellers of the good.
c.
both buyers and sellers of the good.
d.
We cannot infer anything because the shift described is not consistent with a tax.
Chapter 8/Application: The Costs of Taxation ❖ 5
15. If a tax shifts the demand curve upward (or to the right), we can infer that the tax was levied on
a.
buyers of the good.
b.
sellers of the good.
c.
both buyers and sellers of the good.
d.
We cannot infer anything because the shift described is not consistent with a tax.
16. When a tax is imposed on the buyers of a good, the demand curve shifts
a.
downward by the amount of the tax.
b.
upward by the amount of the tax.
c.
downward by less than the amount of the tax.
d.
upward by more than the amount of the tax.
17. When a tax is imposed on the sellers of a good, the
a.
demand curve shifts downward by less than the amount of the tax.
b.
demand curve shifts downward by the amount of the tax.
c.
supply curve shifts upward by less than the amount of the tax.
d.
supply curve shifts upward by the amount of the tax.
18. A tax placed on buyers of airline tickets shifts the
a.
demand curve for airline tickets downward, decreasing the price received by sellers of airline
tickets and causing the quantity of airline tickets to increase.
b.
demand curve for airline tickets downward, decreasing the price received by sellers of airline
tickets and causing the quantity of airline tickets to decrease.
c.
supply curve for airline tickets upward, decreasing the effective price paid by buyers of airline
tickets and causing the quantity of airline tickets to increase.
d.
supply curve for airline tickets upward, increasing the effective price paid by buyers of airline
tickets and causing the quantity of airline tickets to decrease.
19. Suppose a tax is imposed on the sellers of fast-food French fries. The burden of the tax will
a.
fall entirely on the buyers of fast-food French fries.
b.
fall entirely on the sellers of fast-food French fries.
c.
be shared equally by the buyers and sellers of fast-food French fries.
d.
be shared by the buyers and sellers of fast-food French fries but not necessarily equally.
6 ❖ Chapter 8/Application: The Costs of Taxation
20. It does not matter whether a tax is levied on the buyers or the sellers of a good because
a.
sellers always bear the full burden of the tax.
b.
buyers always bear the full burden of the tax.
c.
buyers and sellers will share the burden of the tax.
d.
None of the above is correct; the incidence of the tax does depend on whether the buyers or the
sellers are required to pay the tax.
21. When tires are taxed and sellers of tires are required to pay the tax to the government,
a.
the quantity of tires bought and sold in the market is reduced.
b.
the price paid by buyers of tires decreases.
c.
the demand for tires decreases.
d.
there is a movement downward and to the right along the demand curve for tires.
22. One result of a tax, regardless of whether the tax is placed on the buyers or the sellers, is that the
a.
size of the market is unchanged.
b.
price the seller effectively receives is higher.
c.
supply curve for the good shifts upward by the amount of the tax.
d.
tax reduces the welfare of both buyers and sellers.
23. When a tax is placed on the buyers of a product, a result is that buyers effectively pay
a.
less than before the tax, and sellers effectively receive less than before the tax.
b.
less than before the tax, and sellers effectively receive more than before the tax.
c.
more than before the tax, and sellers effectively receive less than before the tax.
d.
more than before the tax, and sellers effectively receive more than before the tax.
24. When a tax is levied on a good,
a.
neither buyers nor sellers are made worse off.
b.
only sellers are made worse off.
c.
only buyers are made worse off.
d.
both buyers and sellers are made worse off.
25. When a tax is levied on the buyers of a good, the
a.
supply curve shifts upward by the amount of the tax.
b.
quantity supplied increases for all conceivable prices of the good.
c.
buyers of the good will send tax payments to the government.
d.
demand curve shifts to the right by the horizontal distance of the tax.
Chapter 8/Application: The Costs of Taxation ❖ 7
26. When a tax is levied on the sellers of a good, the
a.
supply curve shifts upward by the amount of the tax.
b.
quantity demanded decreases for all conceivable prices of the good.
c.
quantity supplied increases for all conceivable prices of the good.
d.
None of the above is correct.
27. A $3.50 tax per gallon of paint placed on the sellers of paint will shift the supply curve
a.
downward by exactly $3.50.
b.
downward by less than $3.50.
c.
upward by exactly $3.50.
d.
upward by less than $3.50.
28. When a tax on a good is enacted,
a.
buyers and sellers share the burden of the tax regardless of whether the tax is levied on buyers or on
sellers.
b.
buyers always bear the full burden of the tax.
c.
sellers always bear the full burden of the tax.
d.
sellers bear the full burden of the tax if the tax is levied on them; buyers bear the full burden of the
tax if the tax is levied on them.
29. A tax placed on a good
a.
causes the effective price to sellers to increase.
b.
affects the welfare of buyers of the good but not the welfare of sellers.
c.
causes the equilibrium quantity of the good to decrease.
d.
creates a burden that is usually borne entirely by the sellers of the good.
30. When a tax is levied on buyers of a good,
a.
government collects too little revenue to justify the tax if the equilibrium quantity of the good
decreases as a result of the tax.
b.
there is an increase in the quantity of the good supplied.
c.
a wedge is placed between the price buyers pay and the price sellers effectively receive.
d.
the effective price to buyers decreases because the demand curve shifts leftward.
8 ❖ Chapter 8/Application: The Costs of Taxation
31. When a tax is levied on a good,
a.
government collects revenues which might justify the loss in total welfare.
b.
there is a decrease in the quantity of the good bought and sold in the market.
c.
a wedge is placed between the price buyers pay and the price sellers effectively receive.
d.
All of the above are correct.
32. When a tax is levied on a good,
a.
government revenues exceed the loss in total welfare.
b.
there is a decrease in the quantity of the good bought and sold in the market.
c.
the price that sellers receive exceeds the price that buyers pay.
d.
All of the above are correct.
33. The benefit to buyers of participating in a market is measured by
a.
the price elasticity of demand.
b.
consumer surplus.
c.
the maximum amount that buyers are willing to pay for the good.
d.
the equilibrium price.
34. The benefit to buyers of participating in a market is measured by
a.
consumer surplus.
b.
producer surplus.
c.
total surplus.
d.
deadweight loss.
35. The benefit that government receives from a tax is measured by
a.
the change in the equilibrium quantity of the good.
b.
the change in the equilibrium price of the good.
c.
tax revenue.
d.
total surplus.
36. The benefit that government receives from a tax is measured by
a.
deadweight loss.
b.
consumer surplus.
c.
tax incidence.
d.
tax revenue.
Chapter 8/Application: The Costs of Taxation ❖ 9
37. If T represents the size of the tax on a good and Q represents the quantity of the good that is sold, total tax
revenue received by government can be expressed as
a.
T/Q.
b.
T+Q.
c.
TxQ.
d.
(TxQ)/Q.
38. When a tax is levied on buyers, the
a.
supply curves shifts upward by the amount of the tax.
b.
tax creates a wedge between the price buyers effectively pay and the price sellers receive.
c.
tax has no effect on the well-being of sellers.
d.
All of the above are correct.
39. For the purpose of analyzing the gains and losses from a tax on a good, we use tax revenue as a direct measure
of the
a.
government’s benefit from the tax.
b.
government’s loss from the tax.
c.
deadweight loss of the tax.
d.
overall net gain to society of the tax.
40. The decrease in total surplus that results from a market distortion, such as a tax, is called a
a.
wedge loss.
b.
revenue loss.
c.
deadweight loss.
d.
consumer surplus loss.
41. A tax on a good
a.
gives buyers an incentive to buy more of the good than they otherwise would buy.
b.
gives sellers an incentive to produce less of the good than they otherwise would produce.
c.
creates a benefit to the government, the size of which exceeds the loss in surplus to buyers and
sellers.
d.
All of the above are correct.
10 ❖ Chapter 8/Application: The Costs of Taxation
42. When the price of a good is measured in dollars, then the size of the deadweight loss that results from taxing
that good is measured in
a.
units of the good that is being taxed.
b.
units of a related good that is not being taxed.
c.
dollars.
d.
percentage change.
43. The benefit to sellers of participating in a market is measured by the
a.
amount of taxes collected on sales of the good.
b.
producer surplus.
c.
amount sellers receive for their product.
d.
sellers’ willingness to sell.
44. When the government places a tax on a product, the cost of the tax to buyers and sellers
a.
is less than the revenue raised from the tax by the government.
b.
is equal to the revenue raised from the tax by the government.
c.
exceeds the revenue raised from the tax by the government.
d.
Without additional information, such as the elasticity of demand for this product, it is impossible to
compare the cost of a tax to buyers and sellers with tax revenue.
45. Relative to a situation in which gasoline is not taxed, the imposition of a tax on gasoline causes the quantity of
gasoline demanded to
a.
decrease and the quantity of gasoline supplied to decrease.
b.
decrease and the quantity of gasoline supplied to increase.
c.
increase and the quantity of gasoline supplied to decrease.
d.
increase and the quantity of gasoline supplied to increase.
46. Which of the following quantities decrease in response to a tax on a good?
a.
the equilibrium quantity in the market for the good, the effective price of the good paid by buyers,
and consumer surplus
b.
the equilibrium quantity in the market for the good, producer surplus, and the well-being of buyers
of the good
c.
the effective price received by sellers of the good, the wedge between the effective price paid by
buyers and the effective price received by sellers, and consumer surplus
d.
None of the above is necessarily correct unless we know whether the tax is levied on buyers or on
sellers.
Chapter 8/Application: The Costs of Taxation ❖ 11
47. For a good that is taxed, the area on the relevant supply–and-demand graph that represents government’s tax
revenue is a
a.
triangle.
b.
rectangle.
c.
trapezoid.
d.
None of the above is correct; government’s tax revenue is the area between the supply and demand
curves, above the horizontal axis, and below the effective price to buyers.
48. For a good that is taxed, the area on the relevant supply–and-demand graph that represents government’s tax
revenue is
a.
smaller than the area that represents the loss of consumer surplus and producer surplus caused by
the tax.
b.
bounded by the supply curve, the demand curve, the effective price paid by buyers, and the
effective price received by sellers.
c.
a right triangle.
d.
a triangle, but not necessarily a right triangle.
49. Total surplus with a tax is equal to
a.
consumer surplus plus producer surplus.
b.
consumer surplus minus producer surplus.
c.
consumer surplus plus producer surplus minus tax revenue.
d.
consumer surplus plus producer surplus plus tax revenue.
50. Taxes cause deadweight losses because they
a.
lead to losses in surplus for consumers and for producers that, when taken together, exceed tax
revenue collected by the government.
b.
distort incentives to both buyers and sellers.
c.
prevent buyers and sellers from realizing some of the gains from trade.
d.
All of the above are correct.
51. Taxes cause deadweight losses because taxes
a.
reduce the sum of producer and consumer surpluses by more than the amount of tax revenue.
b.
prevent buyers and sellers from realizing some of the gains from trade.
c.
cause marginal buyers and marginal sellers to leave the market, causing the quantity sold to fall.
d.
All of the above are correct.
12 ❖ Chapter 8/Application: The Costs of Taxation
52. Deadweight loss measures the loss
a.
in a market to buyers and sellers that is not offset by an increase in government revenue.
b.
in revenue to the government when buyers choose to buy less of the product because of the tax.
c.
of equality in a market due to government intervention.
d.
of total revenue to business firms due to the price wedge caused by the tax.
53. The loss in total surplus resulting from a tax is called
a.
a deficit.
b.
economic loss.
c.
deadweight loss.
d.
inefficiency.
54. Deadweight loss is the
a.
decline in total surplus that results from a tax.
b.
decline in government revenue when taxes are reduced in a market.
c.
decline in consumer surplus when a tax is placed on buyers.
d.
loss of profits to business firms when a tax is imposed.
55. A deadweight loss is a consequence of a tax on a good because the tax
a.
induces the government to increase its expenditures.
b.
induces buyers to consume less, and sellers to produce less.
c.
increases the equilibrium price in the market.
d.
imposes a loss on buyers that is greater than the loss to sellers.
56. The supply curve for liquor is the typical upward-sloping straight line, and the demand curve for liquor is the
typical downward-sloping straight line. When liquor is taxed, the area on the relevant supply-and-demand
graph that represents the deadweight loss is
a.
larger than the area that represents consumer surplus in the absence of the tax.
b.
larger than the area that represents government’s tax revenue.
c.
a triangle.
d.
All of the above are correct.
Chapter 8/Application: The Costs of Taxation ❖ 13
57. The supply curve for cameras is the typical upward-sloping straight line, and the demand curve for cameras is
the typical downward-sloping straight line. When cameras are taxed, the area on the relevant supply-and-
demand graph that represents
a.
government’s tax revenue is a rectangle.
b.
the deadweight loss of the tax is a triangle.
c.
the loss of consumer surplus caused by the tax is neither a rectangle nor a triangle.
d.
All of the above are correct.
58. For good X, the supply curve is the typical upward-sloping straight line, and the demand curve is the typical
downward-sloping straight line. A tax of $15 per unit is imposed on good X. The tax reduces the equilibrium
quantity in the market by 300 units. The deadweight loss from the tax is
a.
$1,750.
b.
$2,250.
c.
$3,000.
d.
$4,500.
59. In the market for widgets, the supply curve is the typical upward-sloping straight line, and the demand curve is
the typical downward-sloping straight line. The equilibrium quantity in the market for widgets is 200 per
month when there is no tax. Then a tax of $5 per widget is imposed. As a result, the government is able to
raise $750 per month in tax revenue. We can conclude that the equilibrium quantity of widgets has fallen by
a.
25 per month.
b.
50 per month.
c.
75 per month.
d.
100 per month.
60. In the market for widgets, the supply curve is the typical upward-sloping straight line, and the demand curve is
the typical downward-sloping straight line. The equilibrium quantity in the market for widgets is 250 per
month when there is no tax. Then a tax of $6 per widget is imposed. As a result, the government is able to
raise $750 per month in tax revenue. We can conclude that the after-tax quantity of widgets is
a.
75 per month.
b.
100 per month.
c.
125 per month.
d.
150 per month.
14 ❖ Chapter 8/Application: The Costs of Taxation
61. In the market for widgets, the supply curve is the typical upward-sloping straight line, and the demand curve is
the typical downward-sloping straight line. The equilibrium quantity in the market for widgets is 200 per
month when there is no tax. Then a tax of $5 per widget is imposed. The price paid by buyers increases by $2
and the after-tax price received by sellers falls by $3. The government is able to raise $750 per month in reve-
nue from the tax. The deadweight loss from the tax is
a.
$250.
b.
$125.
c.
$75.
d.
$50.
Figure 8-1
Demand
Supply
P”
P’
P”’
J
K
L
M
N
I
Y
B
Quantity
Price
62. Refer to Figure 8-1. Suppose the government imposes a tax of P’ – P”’. Total surplus before the tax is meas-
ured by the area
a.
I+Y.
b.
J+K+L+M.
c.
L+M+Y.
d.
I+J+K+L+M+Y.
63. Refer to Figure 8-1. Suppose the government imposes a tax of P’ – P”’. The area measured by
I+J+K+L+M+Y represents
a.
total surplus before the tax.
b.
total surplus after the tax.
c.
consumer surplus before the tax.
d.
deadweight loss from the tax.
Chapter 8/Application: The Costs of Taxation ❖ 15
64. Refer to Figure 8-1. Suppose the government imposes a tax of P’ – P”’. Total surplus after the tax is meas-
ured by the area
a.
I+Y.
b.
J+K+L+M.
c.
I+Y+B.
d.
I+J+K+L+M+Y.
65. Refer to Figure 8-1. Suppose the government imposes a tax of P’ – P”’. The area measured by J+K+L+M
represents
a.
total surplus after the tax.
b.
total surplus before the tax.
c.
deadweight loss from the tax.
d.
tax revenue.
66. Refer to Figure 8-1. Suppose the government imposes a tax of P’ – P”’. The area measured by K+L repre-
sents
a.
tax revenue.
b.
consumer surplus before the tax.
c.
producer surplus after the tax.
d.
total surplus before the tax.
67. Refer to Figure 8-1. Suppose the government imposes a tax of P’ – P”’. The tax revenue is measured by the
area
a.
K+L.
b.
I+Y.
c.
J+K+L+M.
d.
I+J+K+L+M+Y.
68. Refer to Figure 8-1. Suppose the government imposes a tax of P’ – P”’. The area measured by L+M+Y repre-
sents
a.
consumer surplus after the tax.
b.
consumer surplus before the tax.
c.
producer surplus after the tax.
d.
producer surplus before the tax.
16 ❖ Chapter 8/Application: The Costs of Taxation
69. Refer to Figure 8-1. Suppose the government imposes a tax of P’ – P”’. The producer surplus before the tax is
measured by the area
a.
I+J+K.
b.
I+Y.
c.
L+M+Y.
d.
M.
70. Refer to Figure 8-1. Suppose the government imposes a tax of P’ – P”’. The area measured by M represents
a.
consumer surplus after the tax.
b.
consumer surplus before the tax.
c.
producer surplus after the tax.
d.
producer surplus before the tax.
71. Refer to Figure 8-1. Suppose the government imposes a tax of P’ – P”’. The producer surplus after the tax is
measured by the area
a.
M.
b.
L+M+N+Y+B.
c.
L+M+Y.
d.
J.
72. Refer to Figure 8-1. Suppose the government imposes a tax of P’ – P”’. The area measured by J+K+I repre-
sents
a.
consumer surplus after the tax.
b.
consumer surplus before the tax.
c.
producer surplus after the tax.
d.
producer surplus before the tax.
73. Refer to Figure 8-1. Suppose the government imposes a tax of P’ – P”’. The consumer surplus before the tax
is measured by the area
a.
M.
b.
L+M+Y.
c.
J.
d.
J+K+I.
Chapter 8/Application: The Costs of Taxation ❖ 17
74. Refer to Figure 8-1. Suppose the government imposes a tax of P’ – P”’. The area measured by J represents
a.
consumer surplus after the tax.
b.
consumer surplus before the tax.
c.
producer surplus after the tax.
d.
producer surplus before the tax.
75. Refer to Figure 8-1. Suppose the government imposes a tax of P’ – P”’. The consumer surplus after the tax is
measured by the area
a.
J+K+I.
b.
J.
c.
M.
d.
L+M+Y.
MSC: Analytical
76. Refer to Figure 8-1. Suppose the government imposes a tax of P’ – P”’. The area measured by I+Y represents
the
a.
deadweight loss due to the tax.
b.
loss in consumer surplus due to the tax.
c.
loss in producer surplus due to the tax.
d.
total surplus before the tax.
77. Refer to Figure 8-1. Suppose the government imposes a tax of P’ – P”’. The deadweight loss due to the tax is
measured by the area
a.
J+K+L+M.
b.
J+K+L+M+N.
c.
I+Y.
d.
I+Y+B.
18 ❖ Chapter 8/Application: The Costs of Taxation
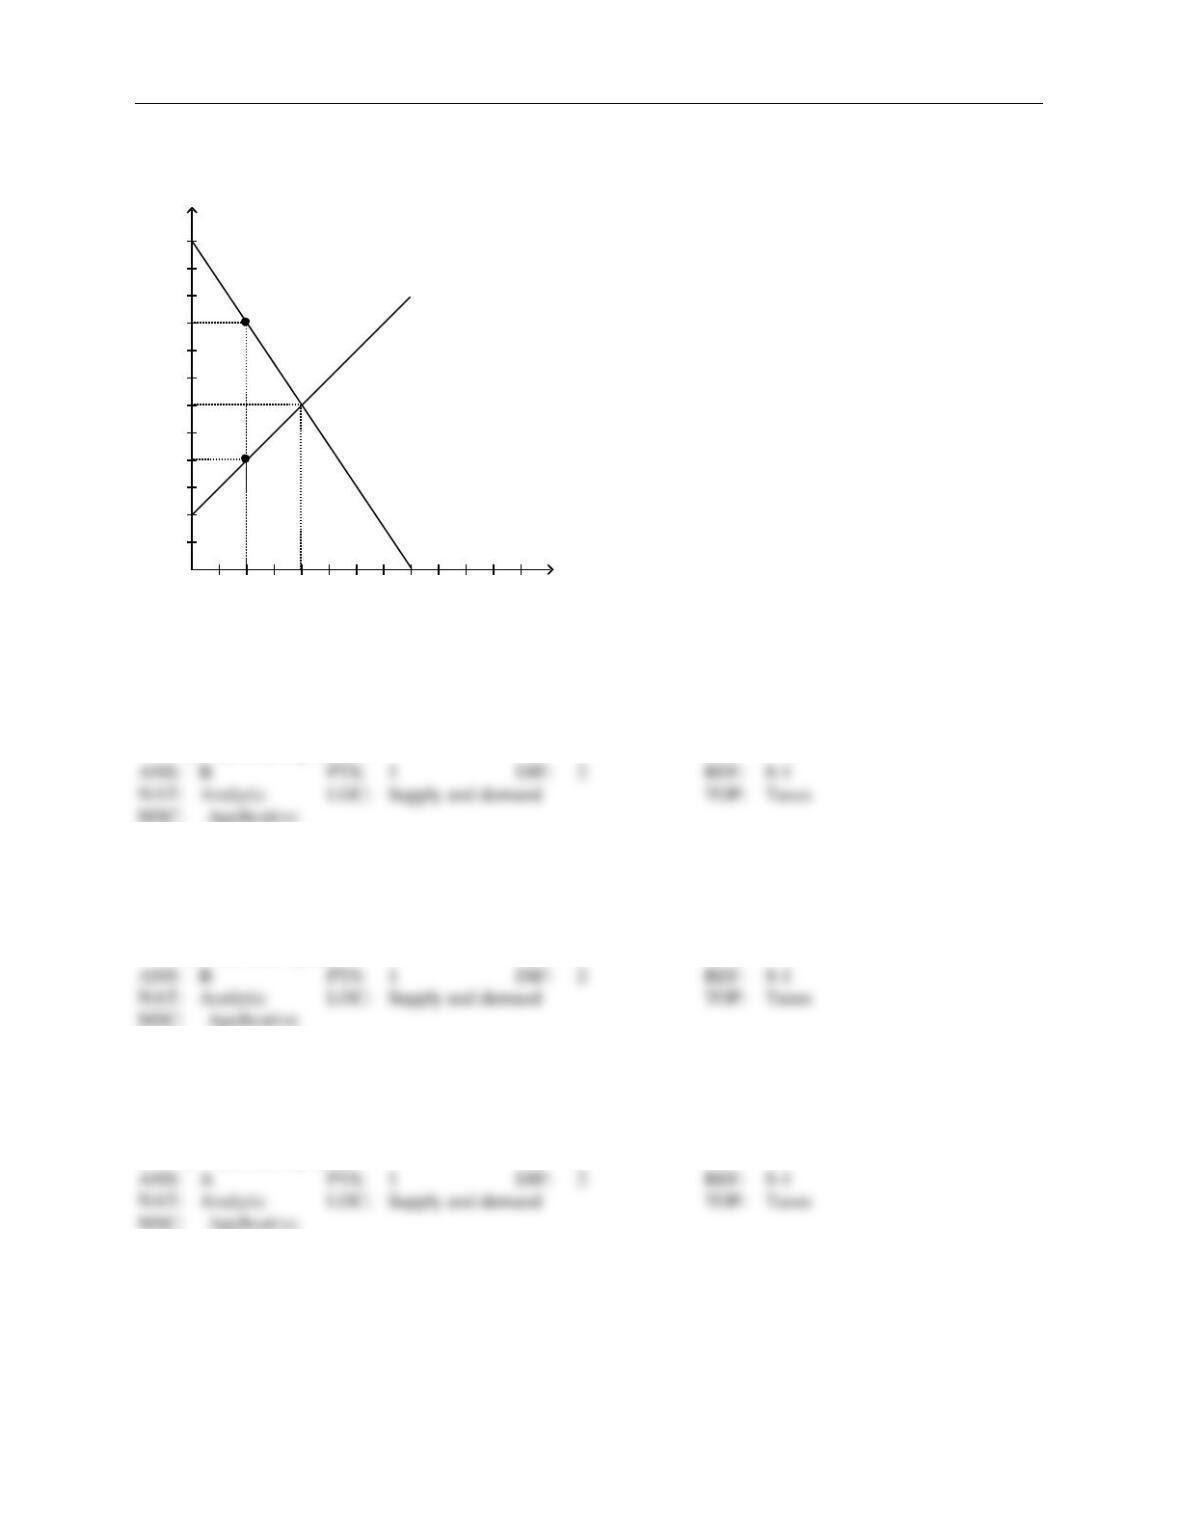
Figure 8-2
The vertical distance between points A and B represents a tax in the market.
Supply
Demand
A
B
0.5 1 1.5 2 2.5 3 3.5 4 4.5 5 Quantity
1
2
3
4
5
6
7
8
9
10
11
12
Price
78. Refer to Figure 8-2. The imposition of the tax causes the quantity sold to
a.
increase by 1 unit.
b.
decrease by 1 unit.
c.
increase by 2 units.
d.
decrease by 2 units.
79. Refer to Figure 8-2. The imposition of the tax causes the price paid by buyers to
a.
decrease by $2.
b.
increase by $3.
c.
decrease by $4.
d.
increase by $5.
80. Refer to Figure 8-2. The imposition of the tax causes the price received by sellers to
a.
decrease by $2.
b.
increase by $3.
c.
decrease by $4.
d.
increase by $5.
Chapter 8/Application: The Costs of Taxation ❖ 19
81. Refer to Figure 8-2. The amount of the tax on each unit of the good is
a.
$1.
b.
$4.
c.
$5.
d.
$9.
82. Refer to Figure 8-2. The per-unit burden of the tax on buyers is
a.
$2.
b.
$3.
c.
$4.
d.
$5.
83. Refer to Figure 8-2. The per-unit burden of the tax on sellers is
a.
$2.
b.
$3.
c.
$4.
d.
$5.
84. Refer to Figure 8-2. The amount of tax revenue received by the government is
a.
$2.50.
b.
$4.
c.
$5.
d.
$9.
85. Refer to Figure 8-2. The amount of deadweight loss as a result of the tax is
a.
$2.50.
b.
$5.
c.
$7.50.
d.
$10.
86. Refer to Figure 8-2. The loss of consumer surplus as a result of the tax is
a.
$1.50.
b.
$3.
c.
$4.50.
d.
$6.
20 ❖ Chapter 8/Application: The Costs of Taxation
87. Refer to Figure 8-2. The loss of producer surplus as a result of the tax is
a.
$1.
b.
$2.
c.
$3.
d.
$4.
88. Refer to Figure 8-2. Consumer surplus without the tax is
a.
$6, and consumer surplus with the tax is $1.50.
b.
$6, and consumer surplus with the tax is $4.50.
c.
$10, and consumer surplus with the tax is $1.50.
d.
$10, and consumer surplus with the tax is $4.50.
89. Refer to Figure 8-2. Producer surplus without the tax is
a.
$4, and producer surplus with the tax is $1.
b.
$4, and producer surplus with the tax is $3.
c.
$10, and producer surplus with the tax is $1.
d.
$10, and producer surplus with the tax is $3.
90. Refer to Figure 8-2. Total surplus without the tax is
a.
$10, and total surplus with the tax is $2.50.
b.
$10, and total surplus with the tax is $7.50.
c.
$20, and total surplus with the tax is $2.50.
d.
$20, and total surplus with the tax is $7.50.
91. Refer to Figure 8-2. The loss of consumer surplus associated with some buyers dropping out of the market as
a result of the tax is
a.
$0.
b.
$1.50.
c.
$3.
d.
$4.50.
92. Refer to Figure 8-2. The loss of consumer surplus for those buyers of the good who continue to buy it after
the tax is imposed is
a.
$0.
b.
$1.50.
c.
$3.
d.
$4.50.