37. The view held by Arthur Laffer and Ronald Reagan that cuts in tax rates would encourage people to increase the
quantity of labor they supplied became known as
a.
California economics.
b.
welfare economics.
c.
supply-side economics.
d.
elasticity economics.
38. Which of the following scenarios is consistent with the Laffer curve?
a.
The tax rate is 1 percent, and tax revenue is very low.
b.
The tax rate is 1 percent, and tax revenue is very high.
c.
The tax rate is 99 percent, and tax revenue is very high.
d.
The tax rate is moderate (between very high and very low), and tax revenue is very low.
39. Which of the following scenarios is not consistent with the Laffer curve?
a.
The tax rate is very low, and tax revenue is very low.
b.
The tax rate is very high, and tax revenue is very low.
c.
The tax rate is very high, and tax revenue is very high.
d.
The tax rate is moderate (between very high and very low), and tax revenue is relatively high.
40. When a country is on the downward-sloping side of the Laffer curves, a cut in the tax rate will
a.
decrease tax revenue and decrease the deadweight loss.
b.
decrease tax revenue and increase the deadweight loss.
c.
increase tax revenue and decrease the deadweight loss.
d.
increase tax revenue and increase the deadweight loss.
41. In the early 1980s, which of the following countries had a marginal tax rate of about 80 percent?
a.
United States
b.
Canada
c.
Japan
d.
Sweden
42. Which of the following ideas is the most plausible?
a.
Reducing a high tax rate is less likely to increase tax revenue than is reducing a low tax rate.
b.
Reducing a high tax rate is more likely to increase tax revenue than is reducing a low tax rate.
c.
Reducing a high tax rate will have the same effect on tax revenue as reducing a low tax rate.
d.
Reducing a tax rate can never increase tax revenue.
43. Which of the following would likely have the smallest deadweight loss relative to the tax revenue?
a.
a head tax (that is, a tax everyone must pay regardless of what one does or buys)
b.
an income tax
c.
a tax on compact discs
d.
a tax on caviar
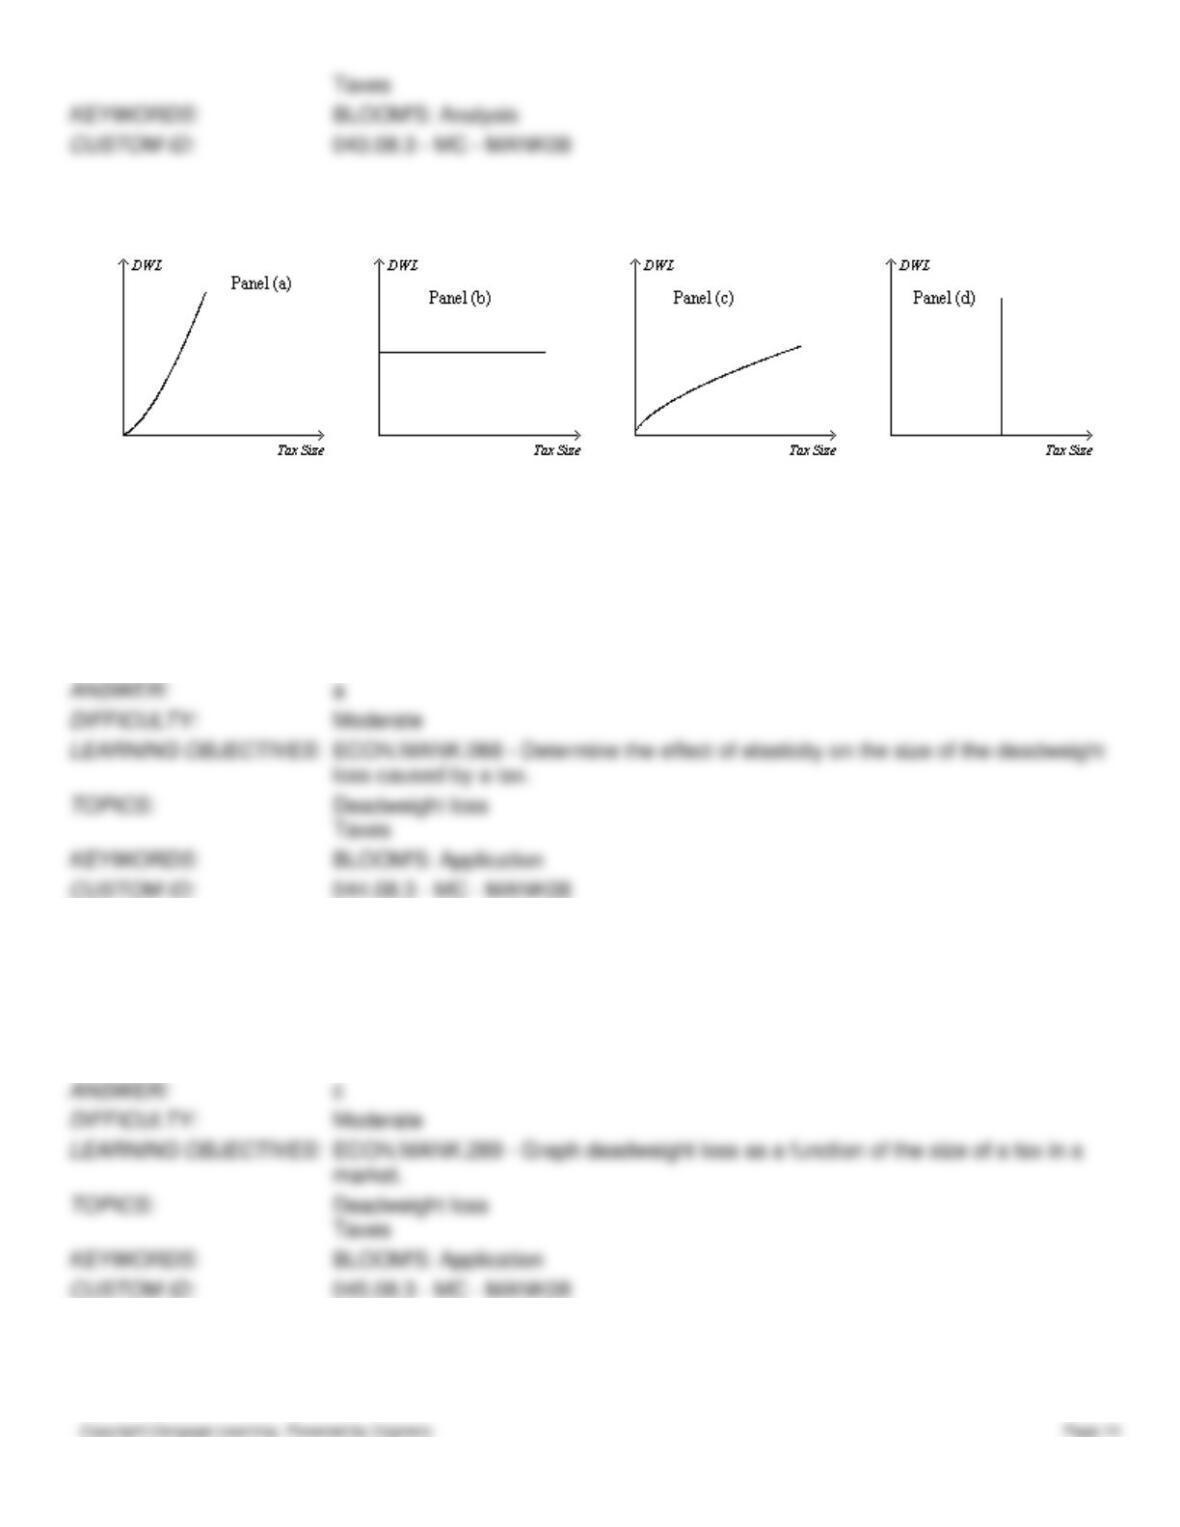
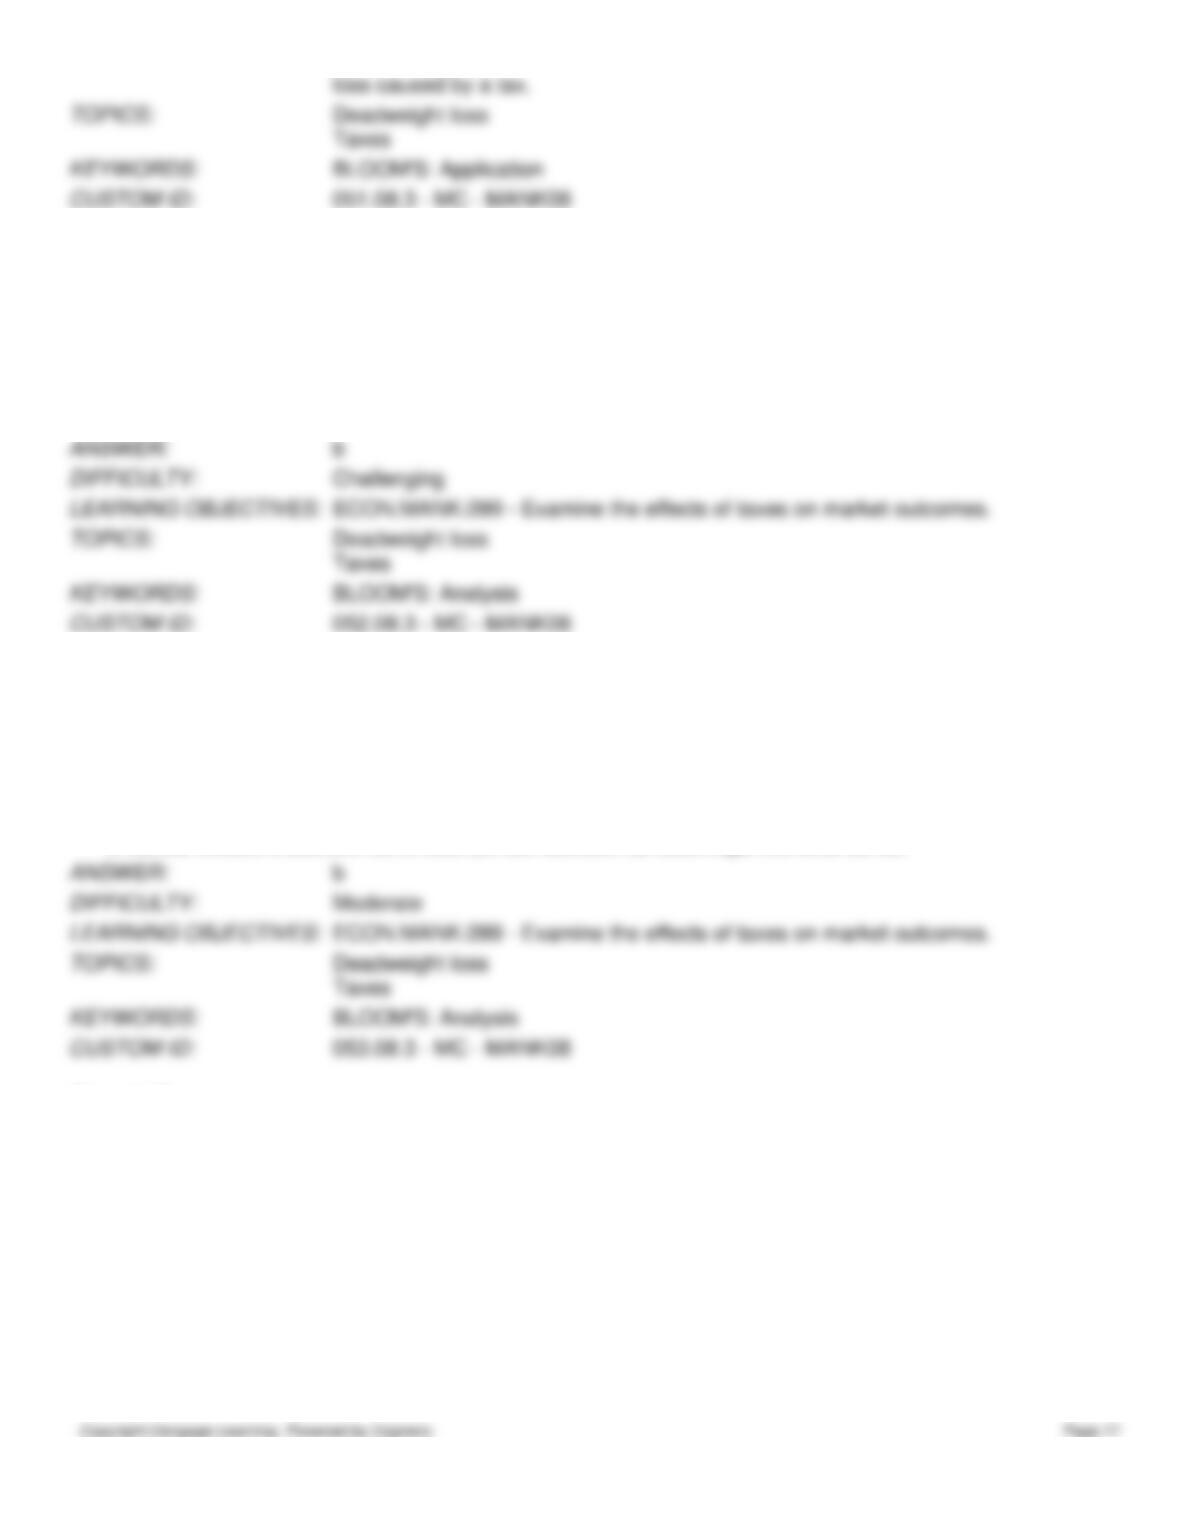
Figure 8-20
On the vertical axis of each graph, DWL is deadweight loss.
44. Refer to Figure 8-20. Which graph correctly illustrates the relationship between the size of a tax and the size of the
deadweight loss associated with the tax?
a.
Panel (a)
b.
Panel (b)
c.
Panel (c)
d.
Panel (d)
45. If the tax on gasoline increases from $2 to $4 per gallon, the deadweight loss from the tax increases by a factor of
a.
one-half.
b.
two.
c.
four.
d.
six.
46. As the size of a tax rises, the deadweight loss
a.
rises, and tax revenue first rises, then falls.
b.
rises as does tax revenue.
c.
falls, and tax revenue first rises, then falls.
d.
falls as does tax revenue.
47. Suppose the federal government doubles the gasoline tax. The deadweight loss associated with the tax
a.
also doubles.
b.
triples.
c.
quadruples.
d.
rises by a factor of 8.
48. The Laffer curve illustrates that
a.
deadweight loss rises by the square of the increase in a tax.
b.
deadweight loss rises exponentially as a tax increases.
c.
tax revenue first rises, then falls as a tax increases.
d.
Both a) and b) are correct.
49. Which of the following statements is correct?
a.
A decrease in the size of a tax always decreases the tax revenue raised by that tax.
b.
A decrease in the size of a tax always decreases the deadweight loss of that tax.
c.
Tax revenue decreases when there is a small decrease in the tax rate and the economy is on the downward-
sloping part of the Laffer curve.
d.
An increase in the size of a tax leads to an increase in the deadweight loss of the tax only if the economy is on
the upward-sloping part of the Laffer curve.
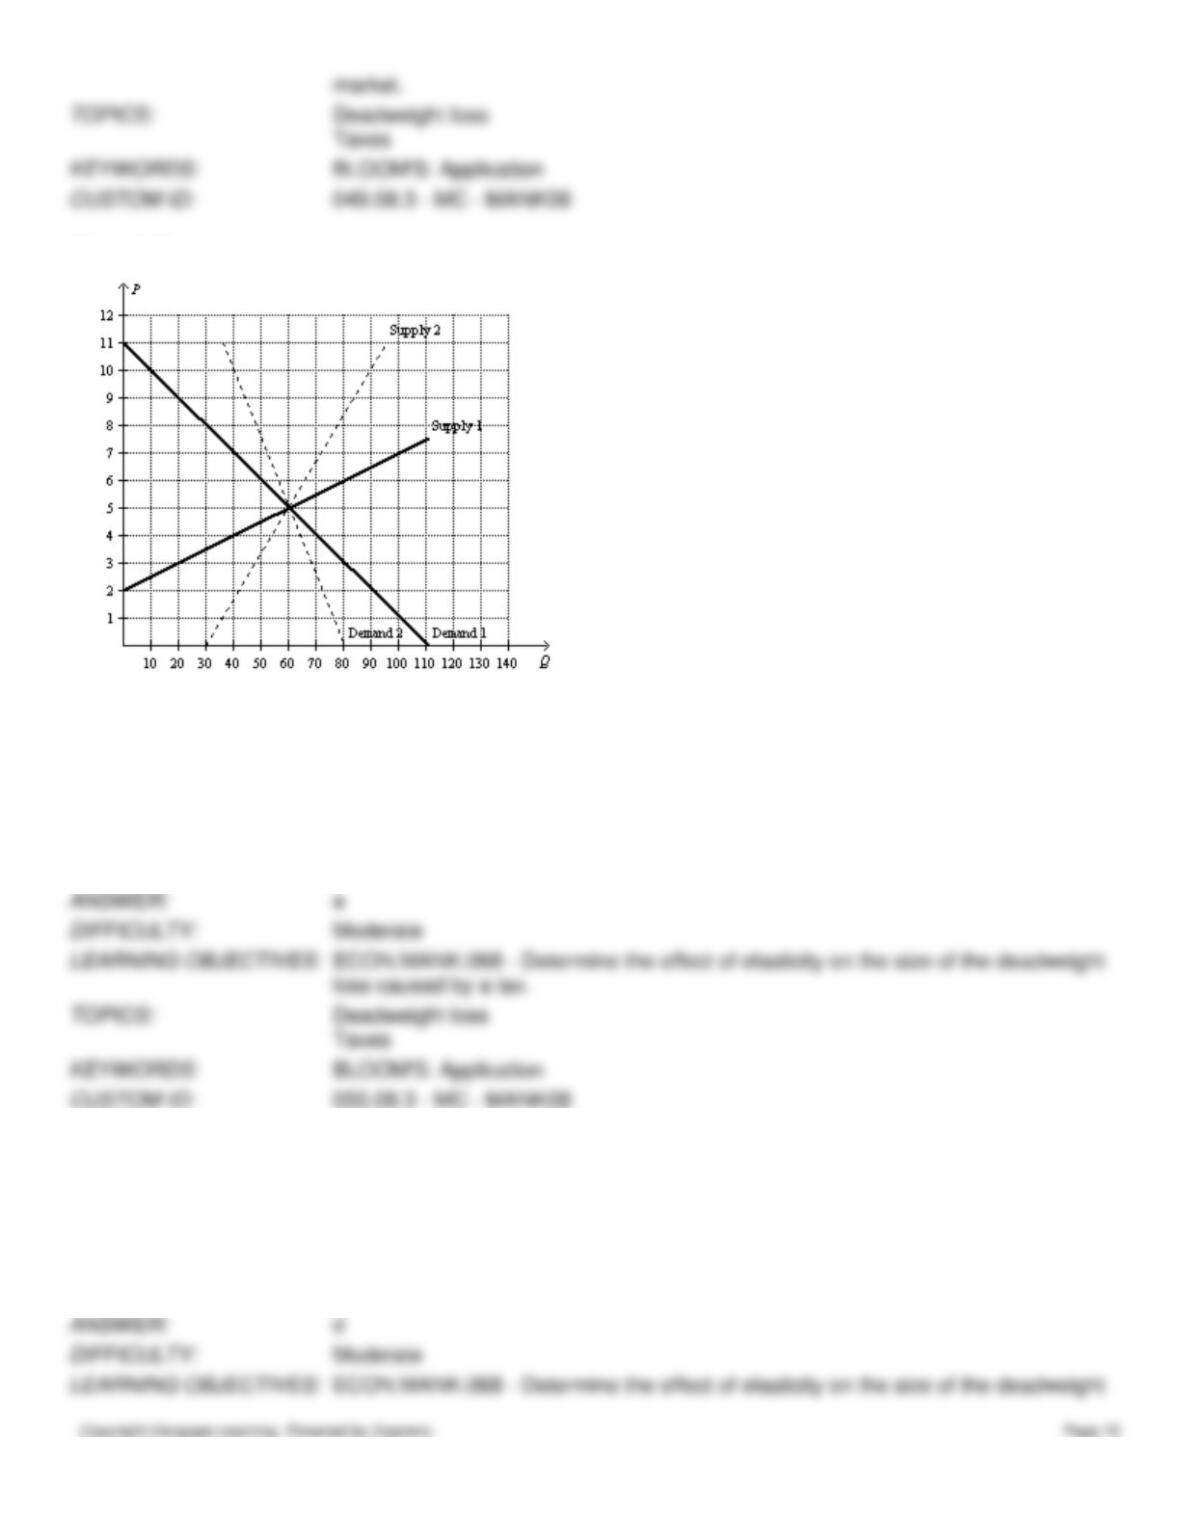
Figure 8-21
50. Refer to Figure 8-21. Suppose the government places a $3 per-unit tax on this good. The largest deadweight loss
from the tax would occur in a market where demand is represented by
a.
Demand 1, and supply is represented by Supply 1.
b.
Demand 1, and supply is represented by Supply 2.
c.
Demand 2, and supply is represented by Supply 1.
d.
Demand 2, and supply is represented by Supply 2.
51. Refer to Figure 8-21. Suppose the government places a $3 per-unit tax on this good. The smallest deadweight loss
from the tax would occur in a market where demand is represented by
a.
Demand 1, and supply is represented by Supply 1.
b.
Demand 1, and supply is represented by Supply 2.
c.
Demand 2, and supply is represented by Supply 1.
d.
Demand 2, and supply is represented by Supply 2.
52. Refer to Figure 8-21. Suppose the market is represented by Demand 1 and Supply 1. At first the government places a
$3 per-unit tax on this good. Then the government decides to raise the tax to $6 per unit. Compared to the original tax
rate, the higher tax will
a.
increase tax revenue and increase the deadweight loss from the tax.
b.
not change tax revenue and increase the deadweight loss from the tax.
c.
decrease tax revenue and increase the deadweight loss from the tax.
d.
decrease tax revenue and decrease the deadweight loss from the tax.
53. Refer to Figure 8-21. Suppose the market is represented by Demand 1 and Supply 1. At first the government places a
$3 per-unit tax on this good. Then the government decides to raise the tax to $6 per unit. How would you characterize the
decision to raise the tax rate from $3 to $6 per unit? The decision is
a.
a good one because it increases tax revenue while decreasing the deadweight loss from the tax.
b.
a bad one because it does not increase tax revenue yet increases the deadweight loss from the tax.
c.
a bad one because it decreases tax revenue while increasing the deadweight loss from the tax.
d.
unclear because it increases tax revenue yet also increases the deadweight loss from the tax.
Figure 8-22
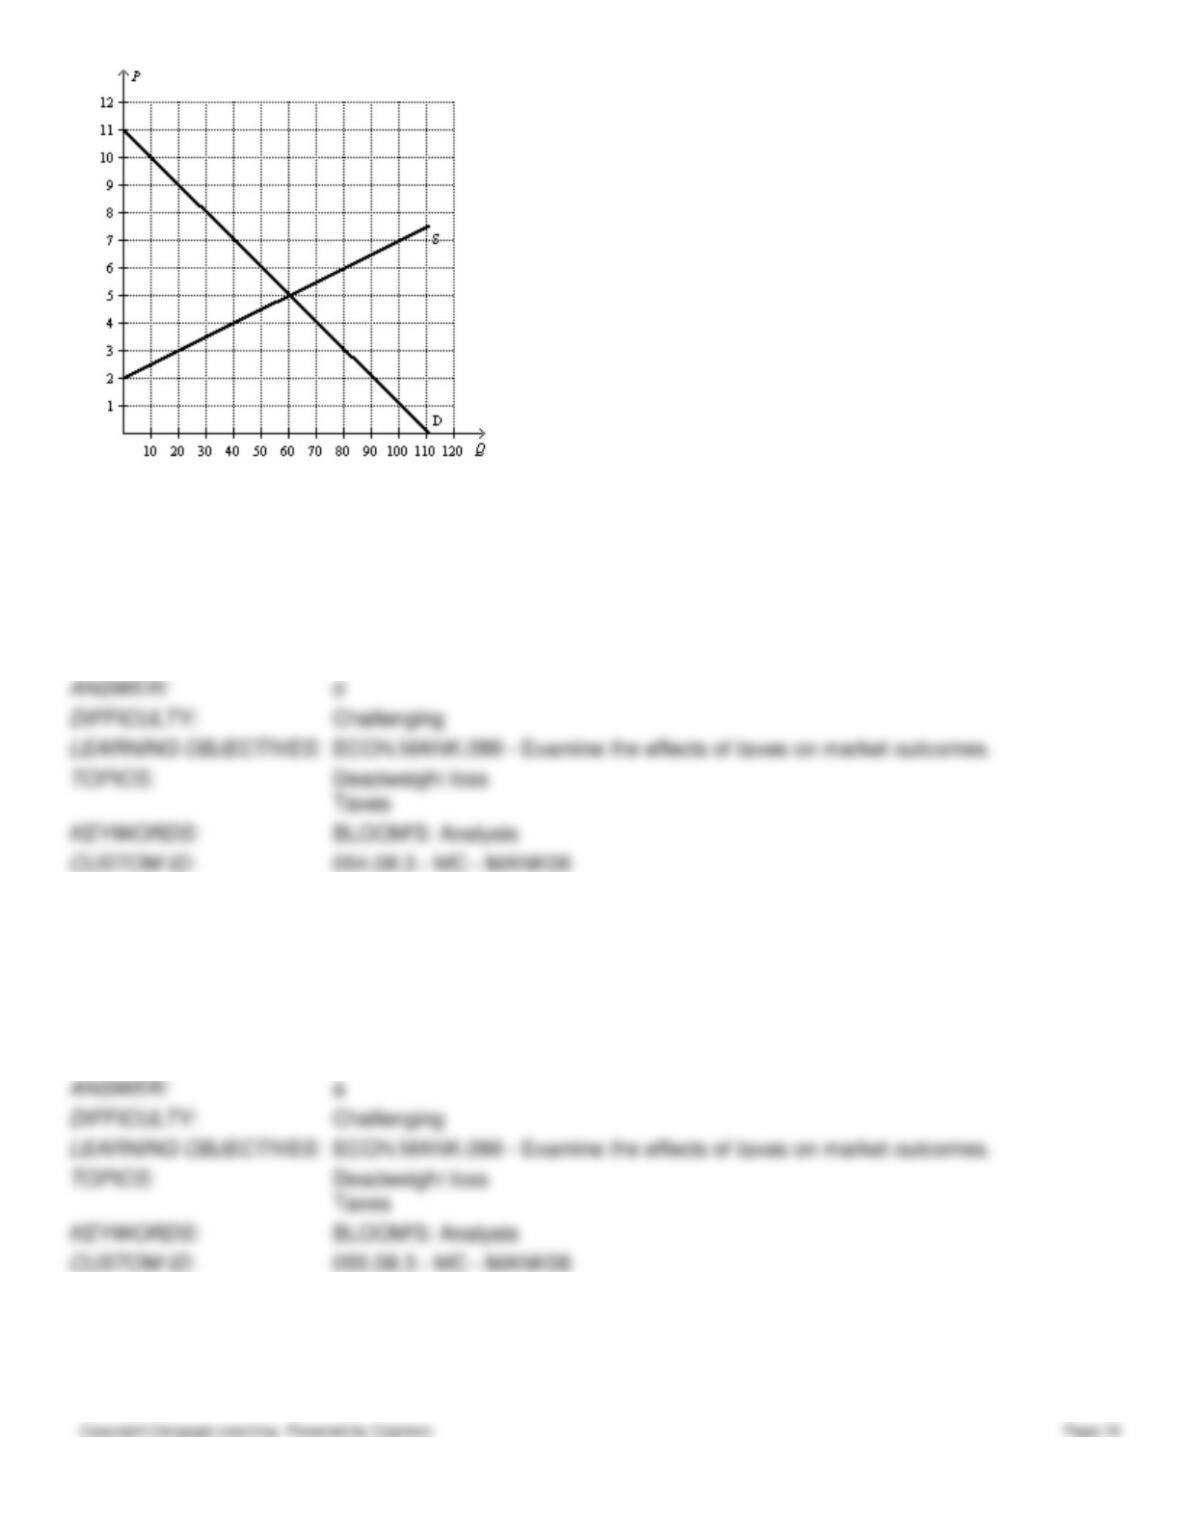
54. Refer to Figure 8-22. Suppose the government changed the per-unit tax on this good from $3.00 to $1.50. Compared
to the original tax rate, this lower tax rate would
a.
increase tax revenue and increase the deadweight loss from the tax.
b.
increase tax revenue and decrease the deadweight loss from the tax.
c.
decrease tax revenue and increase the deadweight loss from the tax.
d.
decrease tax revenue and decrease the deadweight loss from the tax.
55. Refer to Figure 8-22. Suppose the government changed the per-unit tax from $3.00 to $4.50. Compared to the
original tax rate, this higher tax rate would
a.
increase tax revenue and increase the deadweight loss from the tax.
b.
increase tax revenue and decrease the deadweight loss from the tax.
c.
decrease tax revenue and increase the deadweight loss from the tax.
d.
decrease tax revenue and decrease the deadweight loss from the tax.
56. Refer to Figure 8-22. Suppose the government initially imposes a $3 per-unit tax on this good. Now suppose the
government is deciding whether to lower the tax to $1.50 or raise it to $4.50. Which of the following statements is
correct?
a.
Compared to the original tax, the smaller tax will decrease both tax revenue and deadweight loss.
b.
Compared to the original tax, the larger tax will increase both tax revenue and deadweight loss.
c.
Compared to the original tax, the larger tax will decrease tax revenue and increase deadweight loss.
d.
Both a and b are correct.
57. Refer to Figure 8-22. Suppose the government initially imposes a $3 per-unit tax on this good. Now suppose the
government is deciding whether to lower the tax to $1.50 or raise it to $4.50. Which of the following statements is not
correct?
a.
Compared to the original tax, the larger tax will decrease tax revenue.
b.
Compared to the original tax, the smaller tax will decrease deadweight loss.
c.
Compared to the original tax, the smaller tax will decrease tax revenue.
d.
Compared to the original tax, the larger tax will increase deadweight loss.
58. Refer to Figure 8-22. Suppose the government initially imposes a $3 per-unit tax on this good. Now suppose the
government is deciding whether to lower the tax to $1.50 or raise it to $4.50. Which of the following statements is not
correct?
a.
Compared to the original tax, the larger tax will decrease tax revenue.
b.
Compared to the original tax, the smaller tax will decrease deadweight loss.
c.
Compared to the original tax, the smaller tax will decrease tax revenue.
d.
Compared to the original tax, the larger tax will increase deadweight loss.
Figure 8-23. The figure represents the relationship between the size of a tax and the tax revenue raised by that tax.
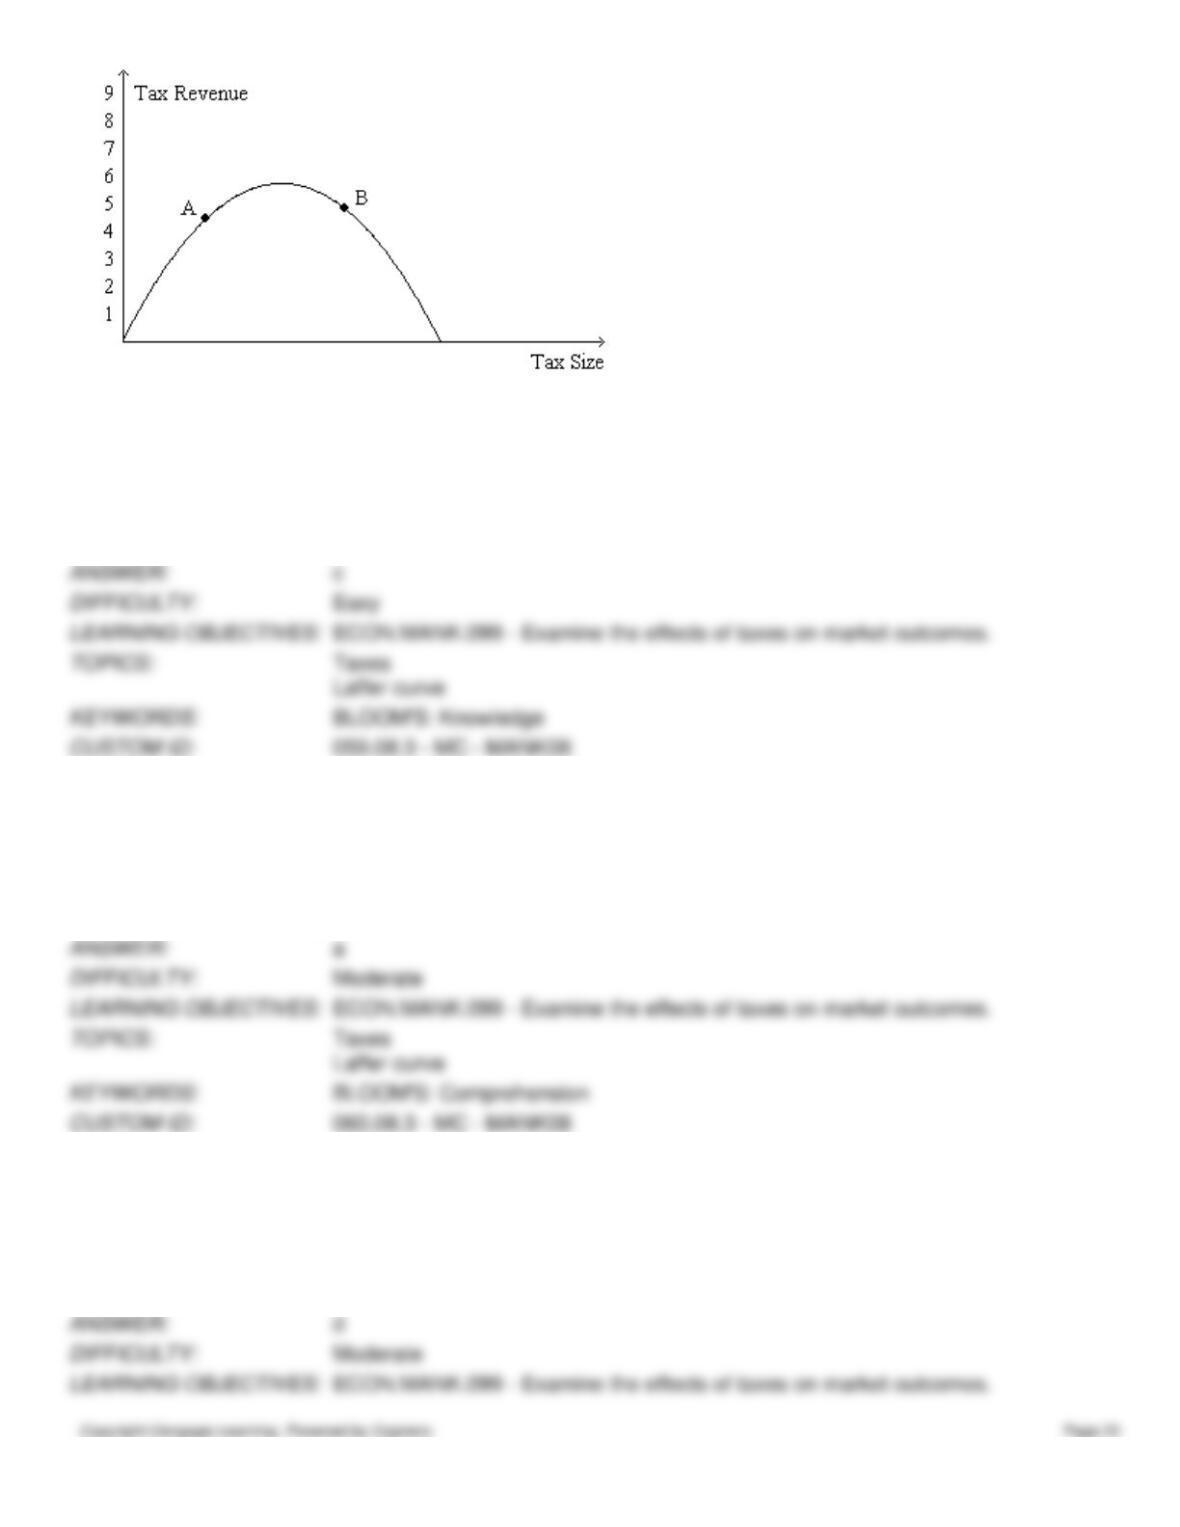
59. Refer to Figure 8-23. The curve that is shown on the figure is called the
a.
deadweight-loss curve.
b.
tax-incidence curve.
c.
Laffer curve.
d.
Lorenz curve.
60. Refer to Figure 8-23. If the economy is at point A on the curve, then a small increase in the tax rate will
a.
increase the deadweight loss of the tax and increase tax revenue.
b.
increase the deadweight loss of the tax and decrease tax revenue.
c.
decrease the deadweight loss of the tax and increase tax revenue.
d.
decrease the deadweight loss of the tax and decrease tax revenue.
61. Refer to Figure 8-23. If the economy is at point A on the curve, then a decrease in the tax rate will
a.
increase the deadweight loss of the tax and increase tax revenue.
b.
increase the deadweight loss of the tax and decrease tax revenue.
c.
decrease the deadweight loss of the tax and increase tax revenue.
d.
decrease the deadweight loss of the tax and decrease tax revenue.
62. Refer to Figure 8-23. If the economy is at point B on the curve, then an increase in the tax rate will
a.
increase the deadweight loss of the tax and increase tax revenue.
b.
increase the deadweight loss of the tax and decrease tax revenue.
c.
decrease the deadweight loss of the tax and increase tax revenue.
d.
decrease the deadweight loss of the tax and decrease tax revenue.
63. Refer to Figure 8-23. If the economy is at point B on the curve, then a small decrease in the tax rate will
a.
increase the deadweight loss of the tax and increase tax revenue.
b.
increase the deadweight loss of the tax and decrease tax revenue.
c.
decrease the deadweight loss of the tax and increase tax revenue.
d.
decrease the deadweight loss of the tax and decrease tax revenue.
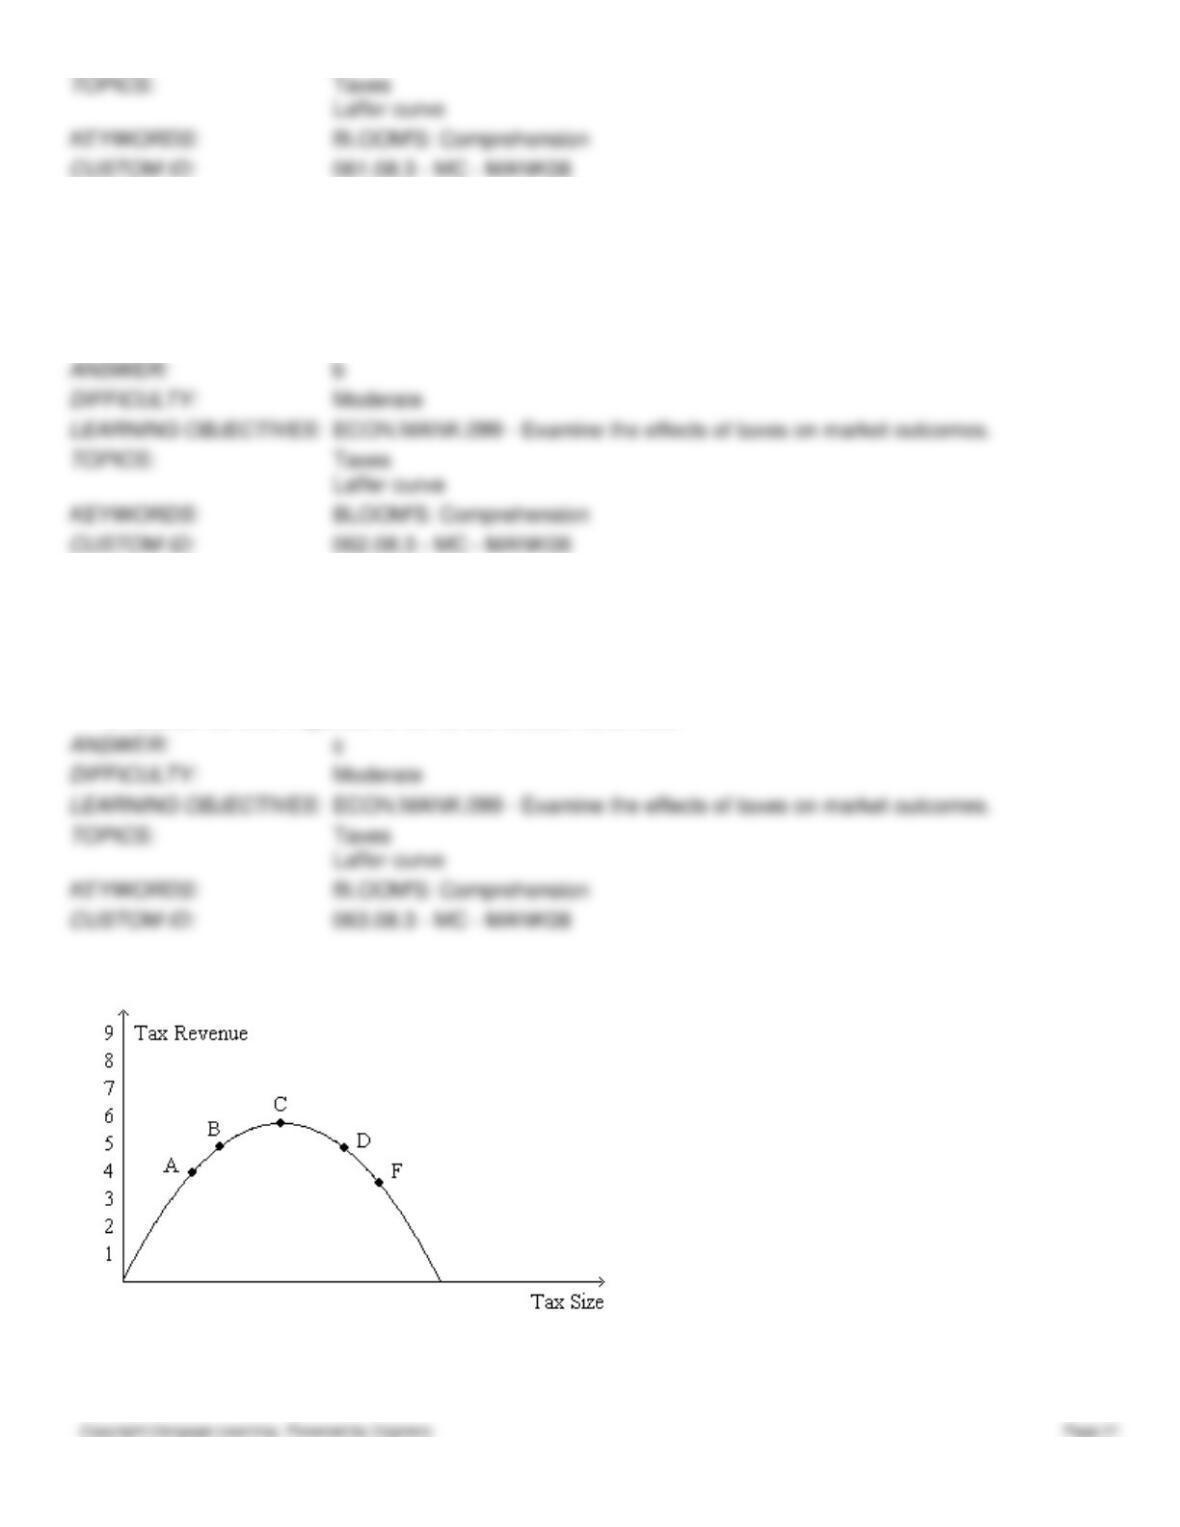
Figure 8-24. The figure represents the relationship between the size of a tax and the tax revenue raised by that tax.
64. Refer to Figure 8-24. Tax revenue would
a.
decrease if the economy began at point B and then the tax rate was decreased.
b.
increase if the economy began at point F and then the tax rate was decreased.
c.
decrease if the economy began at point C and then the tax rate was increased.
d.
All of the above are correct.
65. Refer to Figure 8-24. For an economy that is currently at point D on the curve, a decrease in the tax rate would
a.
decrease consumer surplus.
b.
decrease producer surplus.
c.
increase tax revenue.
d.
increase the deadweight loss of the tax.