a.
$20.
b.
$200.
c.
$300.
d.
$500.
194. Refer to Figure 8-9. The imposition of the tax causes the price paid by buyers to
a.
increase from $600 to $800.
b.
increase from $300 to $800.
c.
decrease from $600 to $300.
d.
remain unchanged at $600.
195. Refer to Figure 8-9. The imposition of the tax causes the price received by sellers to decrease by
a.
$20.
b.
$200.
c.
$300.
d.
$500.
196. Refer to Figure 8-9. The imposition of the tax causes the price received by sellers to
a.
increase from $600 to $800.
b.
decrease from $800 to $300.
c.
decrease from $600 to $300.
d.
remain unchanged at $600.
197. Refer to Figure 8-9. The amount of the tax on each unit of the good is
a.
$20.
b.
$200.
c.
$300.
d.
$500.
198. Refer to Figure 8-9. The per-unit burden of the tax on buyers is
a.
$20.
b.
$200.
c.
$300.
d.
$500.
199. Refer to Figure 8-9. The per-unit burden of the tax on sellers is
a.
$20.
b.
$200.
c.
$300.
d.
$500.
200. Refer to Figure 8-9. The amount of tax revenue received by the government is
a.
$4,000.
b.
$6,000.
c.
$10,000.
d.
$24,000.
201. Refer to Figure 8-9. The consumer surplus without the tax is
a.
$2,000.
b.
$5,000.
c.
$8,000.
d.
$16,000.
202. Refer to Figure 8-9. The consumer surplus with the tax is
a.
$2,000.
b.
$4,000.
c.
$6,000.
d.
$8,000.
203. Refer to Figure 8-9. The loss of consumer surplus as a result of the tax is
a.
$2,000.
b.
$4,000.
c.
$6,000.
d.
$8,000.
204. Refer to Figure 8-9. The producer surplus without the tax is
a.
$3,000.
b.
$8,000.
c.
$12,000.
d.
$24,000.
205. Refer to Figure 8-9. The producer surplus with the tax is
a.
$3,000.
b.
$6,000.
c.
$9,000.
d.
$12,000.
206. Refer to Figure 8-9. The loss of producer surplus as a result of the tax is
a.
$3,000.
b.
$6,000.
c.
$9,000.
d.
$12,000.
207. Refer to Figure 8-9. The total surplus without the tax is
a.
$8,000.
b.
$12,000.
c.
$20,000.
d.
$40,000.
208. Refer to Figure 8-9. The total surplus with the tax is
a.
$2,000.
b.
$3,000.
c.
$15,000.
d.
$20,000.
209. Refer to Figure 8-9. The amount of amount of deadweight loss as a result of the tax is
a.
$4,000.
b.
$5,000.
c.
$6,000.
d.
$10,000.
Figure 8-10
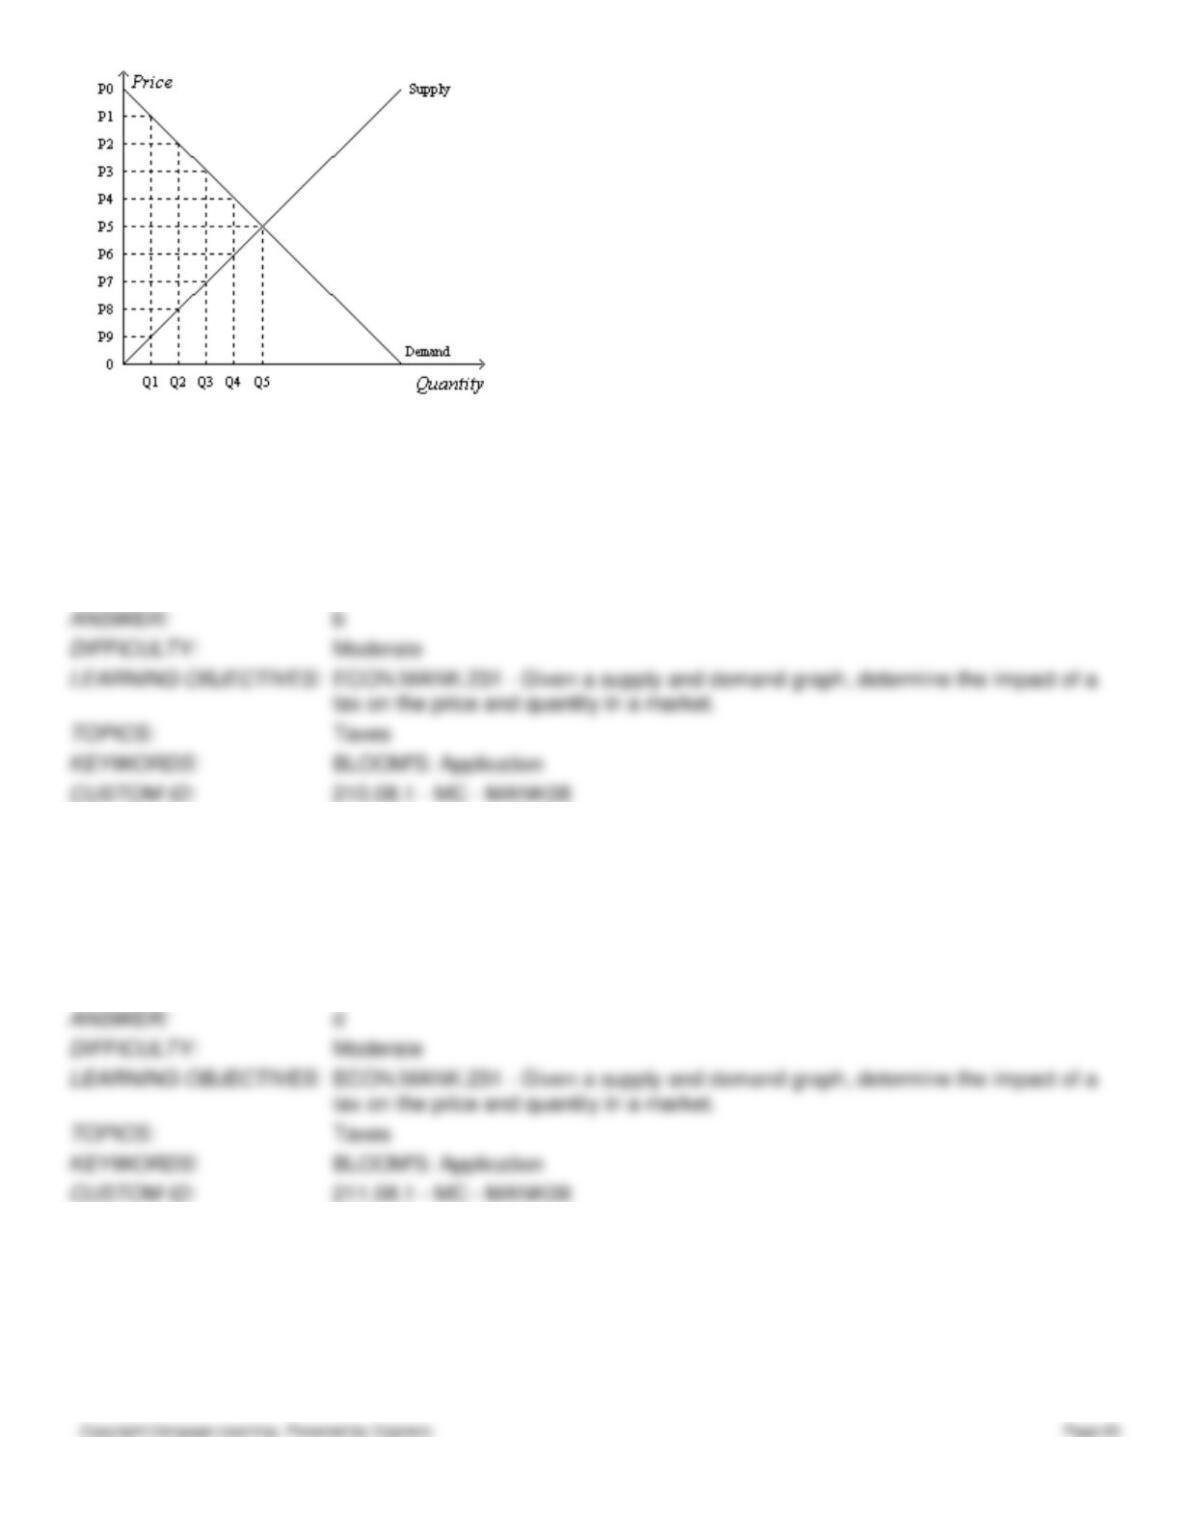
210. Refer to Figure 8-10. Suppose the government imposes a tax that reduces the quantity sold in the market after the
tax to Q2. The price that buyers pay is
a.
P0.
b.
P2.
c.
P5.
d.
P8.
211. Refer to Figure 8-10. Suppose the government imposes a tax that reduces the quantity sold in the market after the
tax to Q2. The price that sellers receive is
a.
P0.
b.
P2.
c.
P5.
d.
P8.
212. Refer to Figure 8-10. Suppose the government imposes a tax that reduces the quantity sold in the market after the
tax to Q2. The size of the tax is
a.
P0-P2.
b.
P2-P8.
c.
P2-P5.
d.
P5-P8.
213. Refer to Figure 8-10. Suppose the government imposes a tax that reduces the quantity sold in the market after the
tax to Q2. The tax revenue is
a.
(P0-P2) x Q2.
b.
(P2-P8) x Q2.
c.
(P2-P5) x Q5.
d.
(P5-P8) x Q5.
214. Refer to Figure 8-10. Suppose the government imposes a tax that reduces the quantity sold in the market after the
tax to Q2. Without the tax, the consumer surplus is
a.
(P0-P2) x Q2.
b.
1/2 x (P0-P2) x Q2.
c.
(P0-P5) x Q5.
d.
1/2 x (P0-P5) x Q5.
215. Refer to Figure 8-10. Suppose the government imposes a tax that reduces the quantity sold in the market after the
tax to Q2. With the tax, the consumer surplus is
a.
(P0-P2) x Q2.
b.
1/2 x (P0-P2) x Q2.
c.
(P0-P5) x Q5.
d.
1/2 x (P0-P5) x Q5.
216. Refer to Figure 8-10. Suppose the government imposes a tax that reduces the quantity sold in the market after the
tax to Q2. Without the tax, the producer surplus is
a.
(P5-0) x Q5.
b.
1/2 x (P5-0) x Q5.
c.
(P8-0) x Q2.
d.
1/2 x (P8-0) x Q2.
217. Refer to Figure 8-10. Suppose the government imposes a tax that reduces the quantity sold in the market after the
tax to Q2. With the tax, the producer surplus is
a.
(P5-0) x Q5.
b.
1/2 x (P5-0) x Q5.
c.
(P8-0) x Q2.
d.
1/2 x (P8-0) x Q2.
218. Refer to Figure 8-10. Suppose the government imposes a tax that reduces the quantity sold in the market after the
tax to Q2. Without the tax, the total surplus is
a.
[1/2 x (P0-P5) x Q5] + [1/2 x (P5-0) x Q5].
b.
[1/2 x (P0-P2) x Q2] +[(P2-P8) x Q2] + [1/2 x (P8-0) x Q2].
c.
(P2-P8) x Q2.
d.
1/2 x (P2-P8) x (Q5-Q2).
219. Refer to Figure 8-10. Suppose the government imposes a tax that reduces the quantity sold in the market after the
tax to Q2. With the tax, the total surplus is
a.
[1/2 x (P0-P5) x Q5] + [1/2 x (P5-0) x Q5].
b.
[1/2 x (P0-P2) x Q2] +[(P2-P8) x Q2] + [1/2 x (P8-0) x Q2].
c.
(P2-P8) x Q2.
d.
1/2 x (P2-P8) x (Q5-Q2).
220. Refer to Figure 8-10. Suppose the government imposes a tax that reduces the quantity sold in the market after the
tax to Q2. The deadweight loss of the tax is
a.
[1/2 x (P0-P5) x Q5] + [1/2 x (P5-0) x Q5].
b.
[1/2 x (P0-P2) x Q2] +[(P2-P8) x Q2] + [1/2 x (P8-0) x Q2].
c.
(P2-P8) x Q2.
d.
1/2 x (P2-P8) x (Q5-Q2).
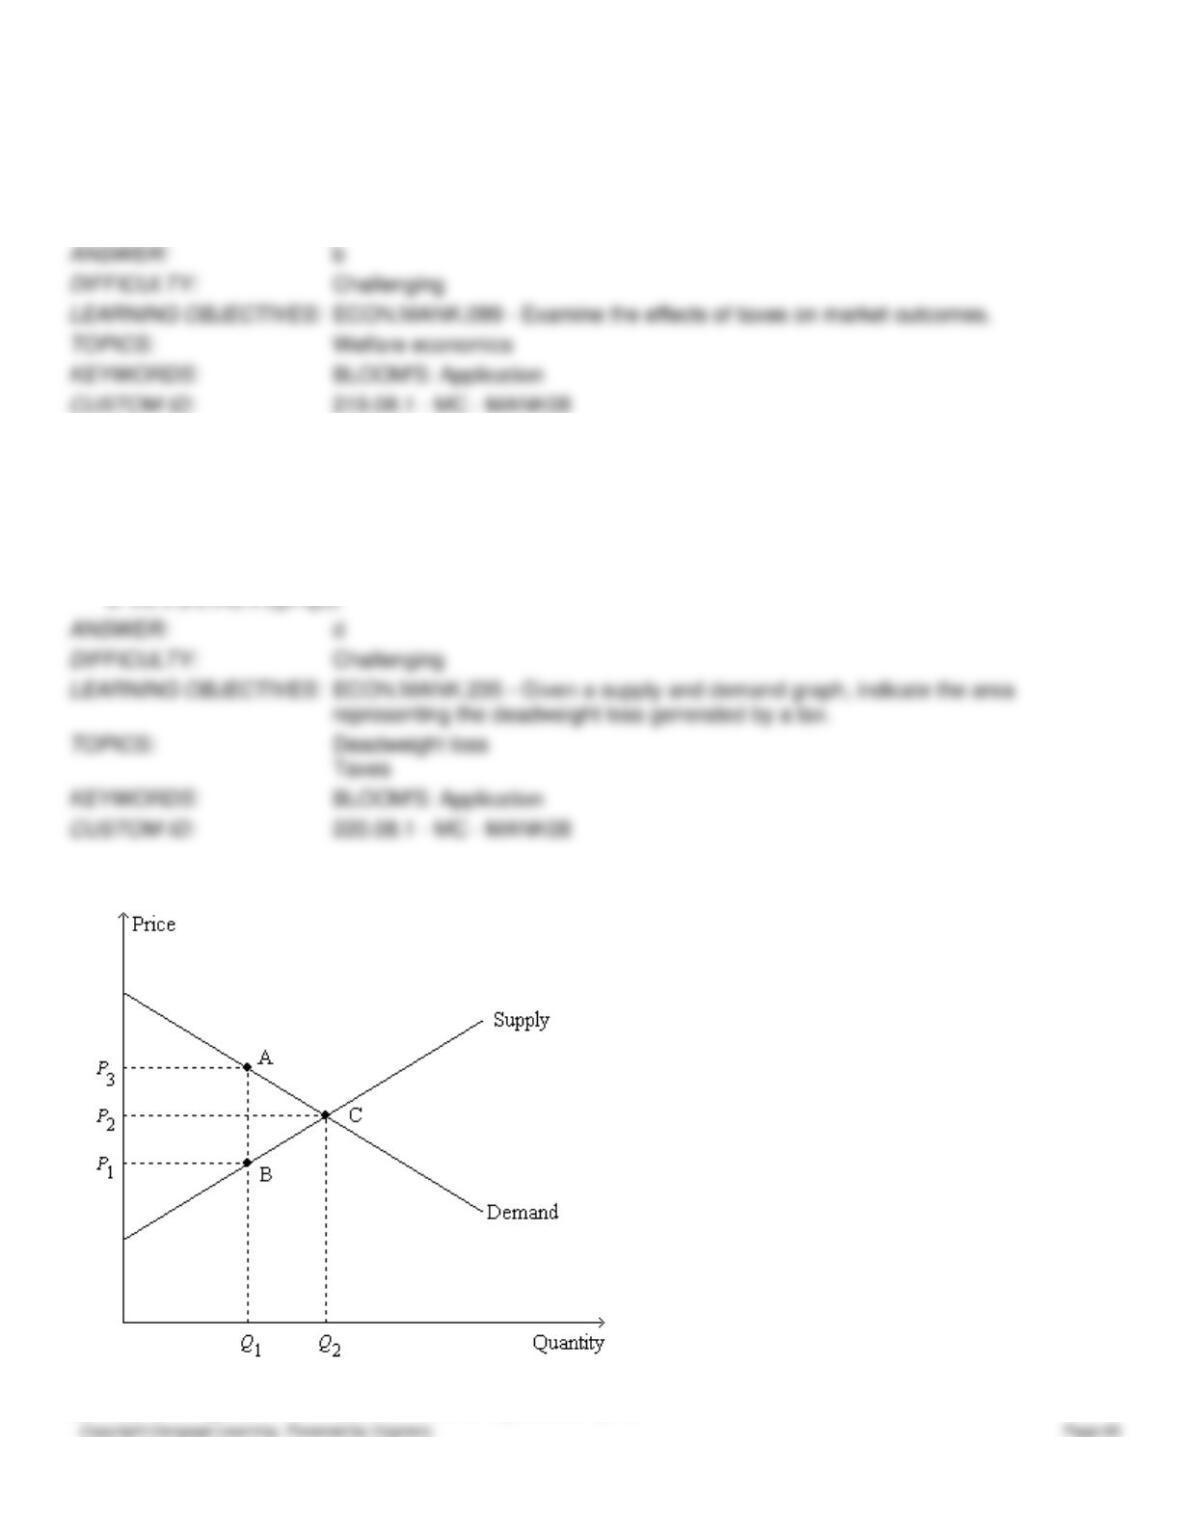
Figure 8-11
221. Refer to Figure 8-11. The size of the tax is represented by the
a.
length of the line segment connecting points A and B.
b.
length of the line segment connecting points A and C.
c.
length of the line segment connecting points B and C.
d.
area of the triangle bounded by the points A, B, and C.
222. Refer to Figure 8-11. The length of the line segment connecting points A and B represents
a.
the difference between the price paid by buyers after the tax is imposed and the price received by sellers after
the tax is imposed.
b.
the size of the tax.
c.
the “tax wedge.”
d.
All of the above are correct.
223. Refer to Figure 8-11. The deadweight loss of the tax is represented by the
a.
length of the line segment connecting points A and B.
b.
length of the line segment connecting points A and C.
c.
length of the line segment connecting points B and C.
d.
area of the triangle bounded by the points A, B, and C.
224. Refer to Figure 8-11. The price labeled as P1 on the vertical axis represents the price
a.
received by sellers before the tax is imposed.
b.
received by sellers after the tax is imposed.
c.
paid by buyers before the tax is imposed.
d.
paid by buyers after the tax is imposed.
225. Refer to Figure 8-11. The price labeled as P2 on the vertical axis represents the
a.
difference between the price paid by buyers after the tax is imposed and the price paid by buyers before the tax
is imposed.
b.
difference between the price received by sellers before the tax is imposed and the price received by sellers
after the tax is imposed.
c.
price of the good before the tax is imposed.
d.
price of the good after the tax is imposed.
226. Refer to Figure 8-11. The price labeled as P3 on the vertical axis represents the price
a.
received by sellers before the tax is imposed.
b.
received by sellers after the tax is imposed.
c.
paid by buyers before the tax is imposed.
d.
paid by buyers after the tax is imposed.
227. Refer to Figure 8-11. Neither a shift of the demand curve nor a shift of the supply curve is shown on the figure.
However, we know that, when the tax is imposed,
a.
the demand curve will shift.
b.
the supply curve will shift.
c.
either the demand curve or the supply curve will shift.
d.
None of the above are correct; the tax causes neither the demand curve nor the supply curve to shift.
228. Refer to Figure 8-11. The tax revenue that the government collects equals
a.
.
b.
.
c.
.
d.
.
229. Refer to Figure 8-11. Suppose Q1 = 4; Q2 = 7; P1 = $6; P2 = $8; and P3 = $10. Then the deadweight loss of the tax
is
a.
$6.
b.
$8.
c.
$9.
d.
$12.
230. Refer to Figure 8-11. Suppose Q1 = 4; Q2 = 7; P1 = $6; P2 = $8; and P3 = $10. Then, when the tax is imposed,
a.
consumer surplus decreases by $13.
b.
producer surplus decreases by $13.
c.
the deadweight loss amounts to $6.
d.
the amount of the good that is sold remains unchanged.
231. Refer to Figure 8-11. Suppose Q1 = 4; Q2 = 7; P1 = $6; P2 = $8; and P3 = $10. Then, when the tax is imposed,
a.
the government collects $28 in tax revenue.
b.
producer surplus decreases by $13.
c.
consumer surplus decreases by $11.
d.
the deadweight loss amounts to $9.
232. Refer to Figure 8-11. Suppose Q1 = 4; Q2 = 7; P1 = $6; P2 = $8; and P3 = $10. Then, when the tax is imposed,
a.
consumer surplus decreases by $11.
b.
producer surplus decreases by $11.
c.
the deadweight loss amounts to $6.
d.
All of the above are correct.
Figure 8-12
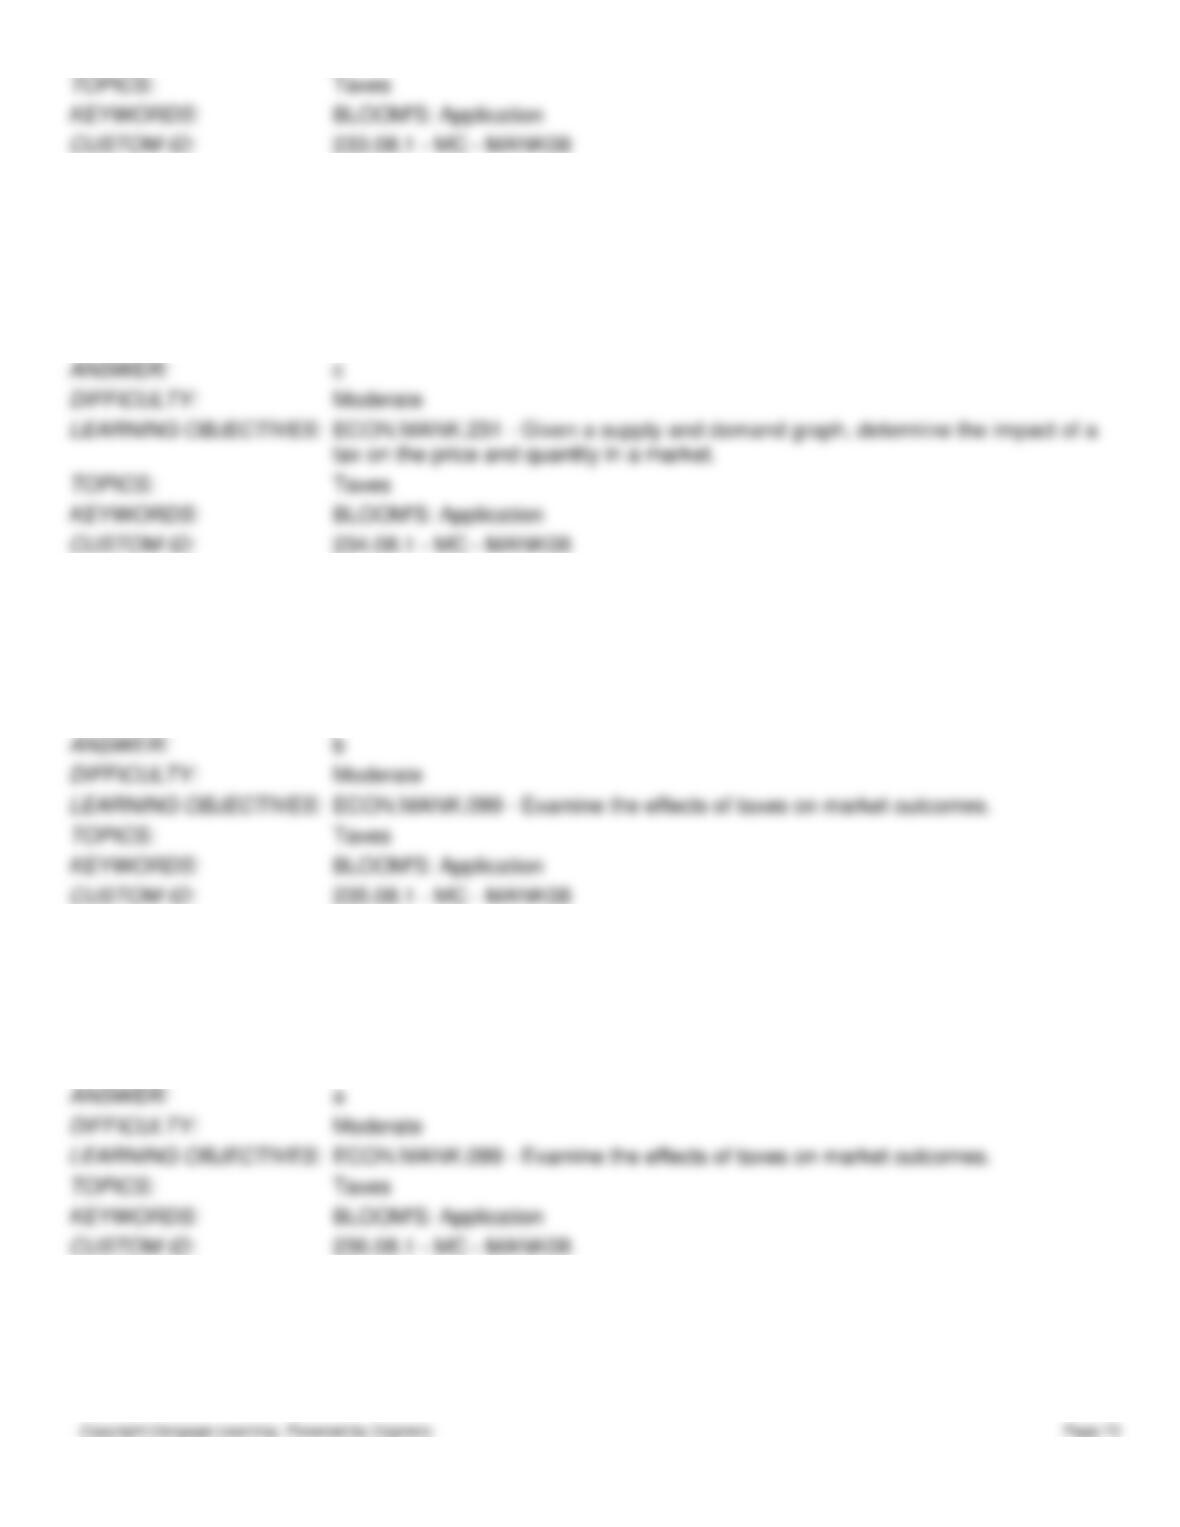
233. Refer to Figure 8-12. Suppose a $3 per-unit tax is placed on this good. The tax causes the price paid by buyers to
a.
decrease by $3.
b.
increase by $2.
c.
decrease by $1.
d.
increase by $6.
234. Refer to Figure 8-12. Suppose a $3 per-unit tax is placed on this good. The tax causes the price received by sellers
to
a.
decrease by $3.
b.
increase by $2.
c.
decrease by $1.
d.
increase by $6.
235. Refer to Figure 8-12. Suppose a $3 per-unit tax is placed on this good. The per-unit burden of the tax on buyers is
a.
$1.
b.
$2.
c.
$3.
d.
$4.
236. Refer to Figure 8-12. Suppose a $3 per-unit tax is placed on this good. The per-unit burden of the tax on sellers is
a.
$1.
b.
$2.
c.
$3.
d.
$4.
237. Refer to Figure 8-12. Suppose a $3 per-unit tax is placed on this good. The amount of tax revenue collected by the
government is
a.
$7.50.
b.
$15.00.
c.
$22.50.
d.
$45.00.
238. Refer to Figure 8-12. Suppose a $3 per-unit tax is placed on this good. The amount of deadweight loss resulting
from this tax is
a.
$7.50.
b.
$15.00.
c.
$22.50.
d.
$45.00.
239. Refer to Figure 8-12. Suppose a $3 per-unit tax is placed on this good. The loss of consumer surplus resulting from
this tax is
a.
$35.
b.
$45.
c.
$70.
d.
$80.
240. Refer to Figure 8-12. Suppose a $3 per-unit tax is placed on this good. The loss of producer surplus resulting from
this tax is
a.
$5.50.
b.
$17.50.
c.
$22.50.
d.
$45.00
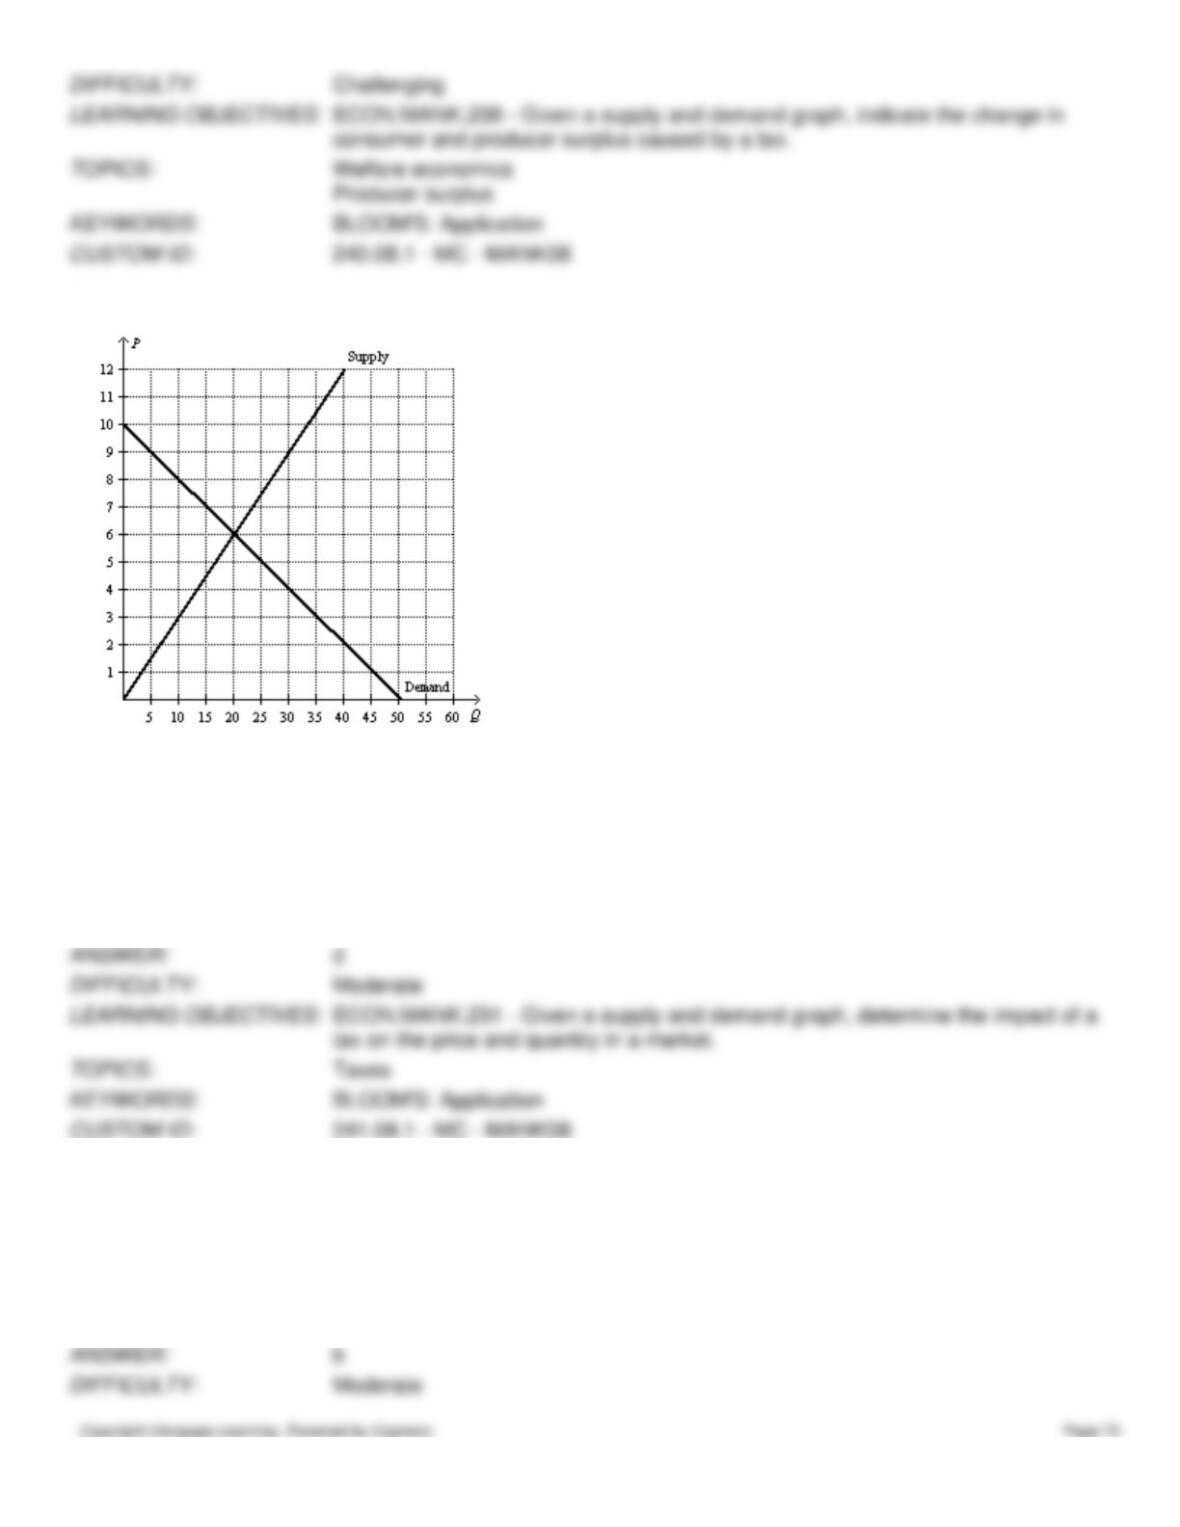
Figure 8-13
241. Refer to Figure 8-13. Suppose the government places a $5 per-unit tax on this good. The tax causes the price paid
by buyers to
a.
decrease by $5.
b.
increase by $5.
c.
increase by $3.
d.
increase by $2.
242. Refer to Figure 8-13. Suppose the government places a $5 per-unit tax on this good. The tax causes the price
received by sellers to
a.
decrease by $5.
b.
decrease by $3.
c.
decrease by $2.
d.
increase by $5.
243. Refer to Figure 8-13. Suppose the government places a $5 per-unit tax on this good. The per-unit burden of the tax
on buyers is
a.
$1.
b.
$2.
c.
$3.
d.
$5.
244. Refer to Figure 8-13. Suppose the government places a $5 per-unit tax on this good. The per-unit burden of the tax
on sellers is
a.
$1.
b.
$2.
c.
$3.
d.
$5.
245. Refer to Figure 8-13. Suppose the government places a $5 per-unit tax on this good. The amount of tax revenue
collected by the government is
a.
$120.
b.
$80.
c.
$50.
d.
$30.
246. Refer to Figure 8-13. Suppose the government places a $5 per-unit tax on this good. The amount of deadweight loss
resulting from this tax is
a.
$120.
b.
$80.
c.
$50.
d.
$25.
247. Refer to Figure 8-13. Suppose the government places a $5 per-unit tax on this good. The consumer surplus after this
tax is
a.
$80.
b.
$40.
c.
$30.
d.
$10.
248. Refer to Figure 8-13. Suppose the government places a $5 per-unit tax on this good. The loss of consumer surplus
resulting from this tax is
a.
$80.
b.
$40.
c.
$30.
d.
$10.
249. Refer to Figure 8-13. Suppose the government places a $5 per-unit tax on this good. The producer surplus after this
tax is
a.
$60.
b.
$45.
c.
$30.
d.
$15.
250. Refer to Figure 8-13. Suppose the government places a $5 per-unit tax on this good. The loss of producer surplus
resulting from this tax is
a.
$60.
b.
$45.
c.
$30.
d.
$15.